- Market Value (2025): USD 758.6 Mn
- Estimated Value (2026): USD 880.0 Mn
- Forecast Value (2036): USD 3882.0 Mn
- CAGR (2026-2036): 16.0%
What is the Multi-Vendor Sync Tools Market forecast to be worth by 2036?
USD 880.0 million in 2026 to USD 3882.0 million by 2036 at a 16.0% CAGR.
- The multi-vendor sync tools market reached USD 758.6 million in 2025.
- Demand is projected to rise from USD 880.0 million in 2026 to USD 3882.0 million by 2036.
- The market is forecast to record 16.0% CAGR from 2026 to 2036 as teams prioritize cross-application data movement.
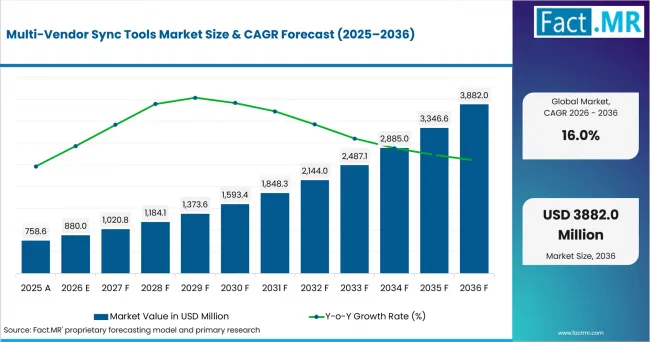
Multi Vendor Sync Tools Market Value Analysis | Source: Fact.MR
What are the defining numbers behind Multi-Vendor Sync Tools Market growth?
USD 3,002.0 million absolute opportunity between 2026 and 2036.
- Demand Drivers in the Market
- IT teams need reusable sync rules for every new application route.
- Revenue teams need cleaner account records across sales, support and finance.
- U.S. retail e-commerce sales reached USD 340.2 billion in Q2 2026, highlighting the scale of digital commerce and the value of timely data updates for commerce teams.
- Data teams need governed connectors across finance, database and development cloud services.
- AI teams need connected systems to give agents safer operating context.
- Key Segments Analyzed
- By Offering: Software platform is expected to hold 36.0% share in 2026 because buyers need a common layer for templates, monitoring and governance across synchronization workflows.
- By Deployment: Cloud is projected to account for 49.0% share in 2026 as hosted connectors support integration across SaaS applications and distributed enterprise environments.
- By Capability: Forecasting-related synchronization workflows are anticipated to capture 44.0% share in 2026 because planning teams depend on current and consistent data across connected systems.
- By Customer: Large enterprise is estimated to represent 38.0% share in 2026 owing to larger application estates, more complex integration requirements and stronger demand for centralized governance.
- Analyst Opinion at Fact.MR
- Shambhu Nath Jha, Principal Consultant at Fact.MR, states, "Multi-vendor sync tools are becoming part of the operating fabric for enterprises with several systems of record. The market is expected to reward stable connectors, clean monitoring and lower maintenance. Suppliers that combine orchestration depth with plain governance fit enterprise approval needs."
- Strategic Implications
- Platform vendors should track API changes before sync failures reach users.
- System integrators should package repeatable CRM, ERP, commerce and support templates.
- Enterprise IT teams should assign ownership for sync rules and audit trails.
- Security teams should review tokens, scopes and data movement logs.
The USA is projected to post 20.6% CAGR through 2036 due to e-commerce volume and software adoption. South Korea is anticipated to record 18.1% CAGR, supported by small-business digital tool uptake. The UK is expected to advance at 16.5% CAGR as large firms integrate AI tools. Japan is forecast to reach 15.0% CAGR as public cloud migration expands integration needs. Germany is estimated to hold 14.4% CAGR as EU cloud and e-business software adoption sustain demand.
How does the Multi-Vendor Sync Tools Market break down by segment?
Cloud leads Deployment at 49.0%; Forecasting leads Capability at 44.0%.
Which Offering dominates?
Software platform at 36.0% share in 2026.
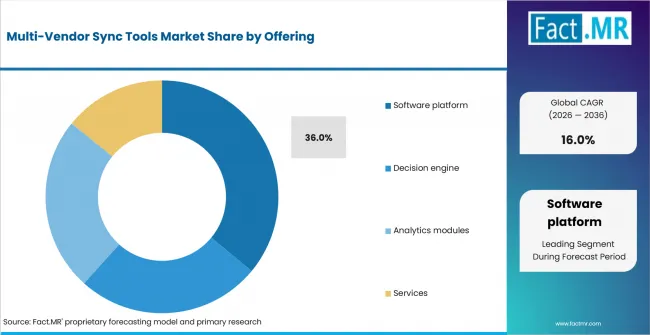
Multi Vendor Sync Tools Market Analysis By Offering | Source: Fact.MR
Software platform is favored by enterprise accounts that want sync design and monitoring in one subscription. Reusable connectors lower rebuild work when SaaS versions change. Decision engines support conditional routing across approval paths. Analytics modules show sync quality and failed records. Services remain useful for migration and custom connector work. Boomi expanded API management in February 2025 as part of the Boomi Enterprise Platform.
What leads the Deployment segment?
Cloud at 49.0% share in 2026.
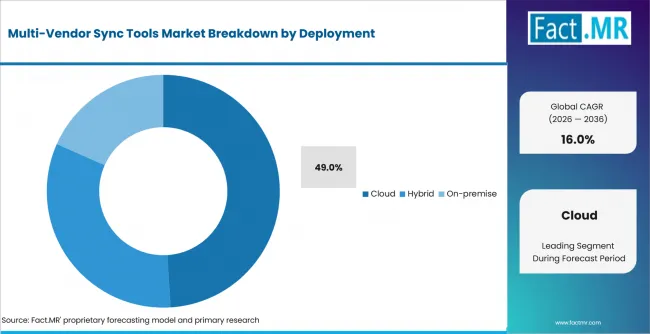
Multi Vendor Sync Tools Market Analysis By Deployment | Source: Fact.MR
Cloud deployment leads since most sync targets are SaaS applications. Hosted tools reduce connector patching across business units and give administrators central monitoring. Hybrid deployment serves private data stores where sensitive records remain controlled. On-premise options serve strict access requirements. Eurostat reported that 52.7% of EU enterprises used paid cloud computing services in 2025. This substantial cloud-installed base provides a broad adoption backdrop for cloud-native synchronization platforms.
How does Capability shape demand?
Forecasting-related synchronization workflows at 44.0% share in 2026.
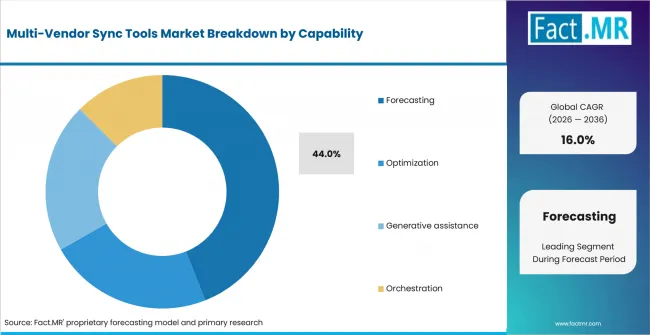
Multi Vendor Sync Tools Market Analysis By Capability | Source: Fact.MR
Forecasting leads since planning teams need current order, pipeline and inventory data. The segment benefits when sync tools refresh planning inputs before sales, inventory or service decisions. Optimization tools route records through cleaner rules. Generative assistance helps users question flows and fixes. Celigo introduced an AI Copilot in September 2025 to guide flow building, connector setup and troubleshooting.
What supports Large enterprise within Customer?
Large enterprise at 38.0% share in 2026.
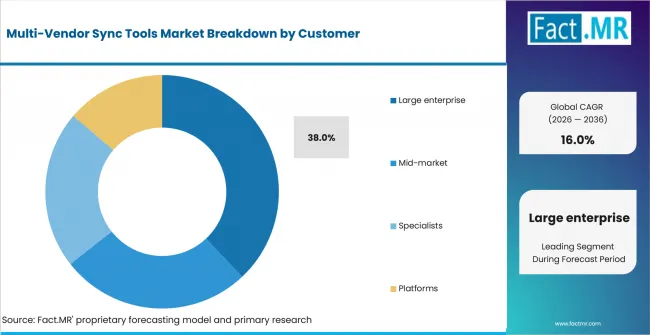
Multi Vendor Sync Tools Market Analysis By Customer | Source: Fact.MR
Large enterprises lead owing to wider application estates and more business rules. Dedicated IT and revenue operations teams own sync governance across finance, service and commerce records. Mid-market customers use templates to reduce project work. DSIT reported in June 2026 that 57% of large UK businesses using AI had integrated AI tools into existing business systems. This level of integration increases the relevance of governance features such as access controls, audit trails and documented AI policies in enterprise deployments.
What is accelerating Multi-Vendor Sync Tools Market adoption, and what is holding it back?
Application sprawl drives it; connector maintenance restrains it.
Drivers Impact Analysis
| Driver | (~) % IMPACT ON CAGR | Geographic Relevance | Impact Timeline |
|---|---|---|---|
| SaaS application sprawl | +2.1% | Global | Short term (<= 2 years) |
| AI-ready data workflows | +1.7% | North America, Europe, East Asia | Medium term (2-4 years) |
| E-commerce and order synchronization | +1.3% | USA, South Korea, UK | Short term (<= 2 years) |
| Cloud adoption among enterprises | +1.1% | Europe, North America | Medium term (2-4 years) |
| Low-code integration ownership | +0.8% | Global | Long term (>= 4 years) |
- SaaS application sprawl: Enterprises add CRM, ERP, commerce and support tools faster than IT teams build custom links.
- AI-ready data workflows: Agent and copilot projects need clean business data before actions are approved.
- Low-code integration ownership: Business technologists want guarded flow changes without waiting for every IT backlog cycle.
Opportunity Impact Analysis
| Opportunity | (~) % IMPACT ON CAGR | Geographic Relevance | Impact Timeline |
|---|---|---|---|
| Agent-ready sync orchestration | +1.5% | North America, Europe | Medium term (2-4 years) |
| Industry templates for commerce and finance | +1.1% | Global | Short term (<= 2 years) |
| Data quality monitoring inside sync flows | +0.9% | Global | Medium term (2-4 years) |
| Partner-led migration bundles | +0.7% | USA, UK, Japan | Long term (>= 4 years) |
- Agent-ready sync orchestration: AI agents need trusted tools and known action paths tied to enterprise records.
- Industry templates for commerce and finance: Templates reduce time spent connecting orders, invoices, returns and customer cases.
- Data quality monitoring inside sync flows: Dashboards that show failed jobs and latency make sync health easier to manage.
- Partner-led migration bundles: Consulting partners package discovery, mapping and sync testing into fixed SaaS migration packages.
Restraints Impact Analysis
| Restraint | (~) % IMPACT ON CAGR | Geographic Relevance | Impact Timeline |
|---|---|---|---|
| Connector breakage from API changes | -0.7% | Global | Short term (<= 2 years) |
| Security review of cross-system access | -0.6% | North America, Europe | Medium term (2-4 years) |
| Data mapping complexity | -0.5% | Global | Short term (<= 2 years) |
| Budget pressure in smaller accounts | -0.4% | UK, South Korea, Japan | Medium term (2-4 years) |
- Connector breakage from API changes: Third-party API changes create failed jobs or partial records.
- Security review of cross-system access: Enterprises must review authentication tokens, permission scopes and data-access paths when synchronization tools connect multiple business systems.
- Data mapping complexity: Inconsistent fields create duplicate records and slow production rollout.
Which countries are scaling the Multi-Vendor Sync Tools Market through 2036?
- The country comparison spans 6.2 percentage points between the USA and Germany across the forecast period.
- The USA remains 2.5 percentage points above South Korea as e-commerce scale and software adoption support complex sync estates.
- South Korea remains 1.6 percentage points above the UK as small businesses add digital tools and online channels.
- The UK remains 1.5 percentage points above Japan as large firms integrate AI tools into existing systems.
- Japan remains 0.6 percentage point above Germany as government cloud migration adds integration demand.
- Germany closes the displayed range while EU cloud and e-business software adoption sustain steady enterprise demand.
Comparable CAGRs create different entry conditions as application estates, cloud use and security needs vary by country. Full report coverage includes North America, Latin America, Western Europe, Eastern Europe, East Asia, South Asia & Pacific, Middle East & Africa.
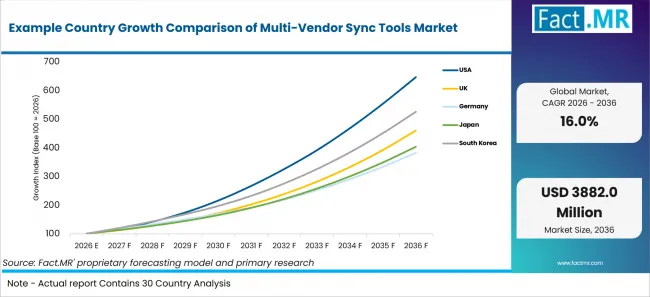
Example Country Growth Comparison Of Multi Vendor Sync Tools Market | Source: Fact.MR
| Country | CAGR (2026-2036) |
|---|---|
| USA | 20.6% |
| South Korea | 18.1% |
| UK | 16.5% |
| Japan | 15.0% |
| Germany | 14.4% |
What supports USA adoption?
20.6% CAGR, supported by software intensity and e-commerce data movement.
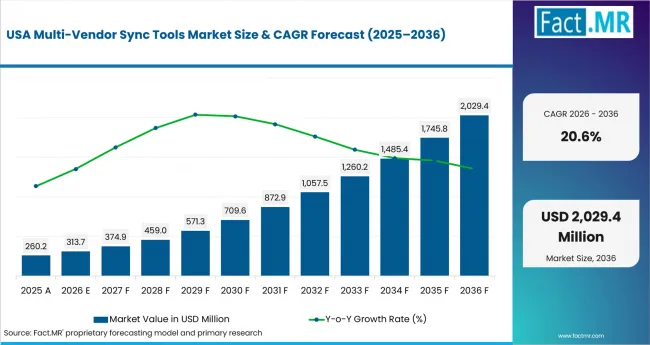
Multi Vendor Sync Tools Market Country Value Analysis | Source: Fact.MR
U.S. enterprise teams approve sync tools where application estates already depend on specialized software and digital commerce. The USA is projected to record 20.6% CAGR through 2036, and the U.S. Census Bureau reported in September 2025 that 58.9% of businesses using specialized software considered it ‘very important’ to their business processes or methods. The widespread importance of specialized software provides a broad operating backdrop for integration and synchronization across enterprise applications such as CRM, ERP, commerce and support systems.
How is South Korea scaling demand?
18.1% CAGR, led by small-business digitization and online workflow expansion.
South Korea's adoption path is shaped by smaller firms that need simpler links between store systems and online channels. The market is anticipated to record 18.1% CAGR through 2036, while MSS reported in March 2026 that 27.2% of South Korean small businesses used digital and smart technologies in 2024. Rising adoption of online sales, business-management software and other digital systems provides a broader adoption backdrop for integration and governed data-synchronization tools.
What supports the UK outlook?
16.5% CAGR, backed by AI integration and supply-chain coordination.
UK enterprise demand is tied to firms connecting AI tools with existing CRM, finance and productivity systems. The UK is expected to advance at 16.5% CAGR through 2036, and GOV.UK reported in June 2026 that 21% of AI-using businesses had AI tools integrated into existing business systems in 2025–2026. ONS reported in July 2025 that 37% of businesses with 10 or more employees had concerns about their supply chains in late June 2025, providing a relevant backdrop for cross-system visibility and coordination tools.
How does Japan perform?
15.0% CAGR, shaped by government cloud migration and e-commerce workflows.
Japan's demand is linked to public-sector cloud migration and enterprise caution around data movement. Japan is forecast to reach 15.0% CAGR through 2036, and Japan’s Digital Agency reported in its 2025 Priority Plan that Government Cloud use had increased 335%, from 671 systems in August 2024 to 2,918 systems by February 2025. The agency’s standardized migration and inter-system data-linkage work provides practical implementation context for connecting Government Cloud with existing government systems.
What underpins Germany's growth?
14.4% CAGR, driven by paid cloud use and e-business software adoption.
Germany's sync demand is concentrated in firms that connect cloud services with ERP, CRM and analytics workflows. Germany is estimated to hold 14.4% CAGR through 2036, while Destatis reported in November 2025 that 54% of German enterprises with at least 10 employees used paid cloud services in 2025. Eurostat reported that ERP use ranged from 41% of small EU enterprises to 89% of large enterprises in 2025, providing a broad operating backdrop for controlled integration between enterprise applications.
Who leads the Multi-Vendor Sync Tools Market?
MuleSoft and Boomi are active integration-platform providers, while Workato and SnapLogic also provide orchestration and AI-related integration capabilities.
MuleSoft, Boomi, Celigo and Workato are active providers across integration, orchestration and low-code automation. MuleSoft expanded secure AI-agent orchestration capabilities in June 2025, enabling governed agent actions across enterprise applications, APIs and integrations. Boomi unveiled comprehensive API Management in February 2025 to address API sprawl and support agentic AI. Celigo introduced AI Copilot in September 2025 to provide real-time guidance across flow building, connector setup and troubleshooting.
Jitterbit and SnapLogic participate through integration platforms spanning API management, AI-enabled development and agent orchestration. Workato expanded its Workato ONE capabilities in 2025 with intelligent decisioning and agent-orchestration features. Jitterbit introduced natural-language application building and modification in February 2025, while SnapLogic announced new capabilities for agents, MCP and enhanced AI governance in November 2025. Across these platforms, connector coverage, observability, mapping and transformation capabilities, API management and governance are relevant competitive considerations.
Which companies are the key providers?
Key companies include MuleSoft, Boomi, Celigo, Workato, Jitterbit, and SnapLogic.
- MuleSoft
- Boomi
- Celigo
- Workato
- Jitterbit
- SnapLogic
Bibliography
- U.S. Census Bureau. (2026, August 18). Quarterly retail e-commerce sales.
- Arledge, R. (2025, September 17). Census Bureau’s 2023 Annual Business Survey provides insight into technology adoption by businesses. U.S. Census Bureau.
- Department for Science, Innovation and Technology. (2026, June 18). UK Business Data Survey 2026. GOV.UK.
- Office for National Statistics. (2025, July 3). Business insights and impact on the UK economy: 3 July 2025.
- Federal Statistical Office (Destatis). (2025, November 24). Jedes zweite Unternehmen nutzt kostenpflichtige Cloud-Services.
- Eurostat. (2026, February 3). 53% EU enterprises used paid cloud services in 2025.
- Eurostat. (2026, May 20). Larger enterprises used more e-business apps in 2025.
- Digital Agency. (2025, June 13). Priority Plan 2025 [Provisional translation].
- Ministry of SMEs and Startups. (2026, March 13). New survey offers detailed look at Korea’s small business landscape in 2024.
- Statistics Korea. (2025, August 1). Online shopping in June 2025.
- Salesforce. (2025, June 25). New MuleSoft innovations from Salesforce enable secure, scalable AI agent orchestration for agentic transformation.
- Boomi. (2025, February 18). Boomi unveils comprehensive API management to combat API sprawl and power agentic AI.
- Smith, L. (2025, September 22). Celigo September 2025 release. Celigo.
- Dewar, C. (2026, May 18). Workato ONE: The WoW Release. Workato.
- Jitterbit. (2025, February 11). Jitterbit’s next AI infusion: Build, manage, modify business applications with natural language processing.
- SnapLogic. (2025, November 4). SnapLogic accelerates enterprise AI adoption with new capabilities for agents, MCP, and enhanced AI governance.
This Report Answers
- The report explains where multi-vendor sync tools are used across offering, deployment, capability and customer type.
- Segment analysis identifies software platform, cloud deployment, forecasting and large enterprise demand.
- Country analysis examines the USA, South Korea, the UK, Japan and Germany.
- Competitive analysis reviews MuleSoft, Boomi, Celigo, Workato, Jitterbit and SnapLogic.
- Application analysis assesses how synchronization and API governance influence purchase decisions.
What does the Multi-Vendor Sync Tools Market cover?
Software platforms, decision engines, analytics modules and services used for cross-application synchronization.
The market covers software and services that keep records aligned across applications from different vendors. It includes connector libraries, monitoring, data mapping and workflow triggers.
The assessment differs from broad system integration since it focuses on recurring synchronization across active business applications. Adjacent categories are included only when sync or orchestration is part of the product boundary.
What is included in the scope?
Multi-vendor sync tools used across cloud, hybrid and on-premise application environments.
The scope includes sync platforms, decision engines, analytics modules and services used to connect CRM, ERP, commerce, finance and support systems. It also covers workflow orchestration where application records must remain consistent across several vendors. Coverage also includes platforms that help govern data movement into analytics, catalogs and shared workflow systems. Data catalog and data marketplace platforms is close to the governance layer that sync tools must support. The boundary also touches system integration when repeatable sync assets replace custom project work.
What is excluded from the scope?
General MLOps platforms and one-time custom integration projects are outside the scope.
The scope excludes one-time consulting projects where customers license or subscribe only to project work. General workflow tools remain outside scope when they lack vendor-to-vendor record connection.
Pure data warehousing, basic file transfer, broad IT outsourcing and standalone API gateways are outside the scope unless sold with active synchronization functions.
How Was the Analysis Built?
The analysis draws on 120+ sources, 35+ company portfolios, 25+ countries, and more than 20 industry interviews.
- Primary Research: Primary research includes discussions with manufacturers, service providers, technology developers, distributors, end users, procurement teams, and subject-matter experts. These conversations examine purchasing priorities, product adoption, operational challenges, approval requirements, competitive positioning, and the factors that influence wider market acceptance.
- Desk Research: Desk research covers government statistics, regulatory publications, company filings, trade data, technical studies, industry associations, standards, public policy, and other authoritative sources. Every source used in the analysis is documented in the bibliography.
- Market Sizing and Forecasting: Market estimates combine historical performance, demand indicators, pricing and volume trends, segment shares, company participation, country-level growth, adoption patterns, investment activity, and barriers to market expansion.
- Data Validation and Update Cycle: Findings are validated by comparing primary interviews with public data, company activity, regulatory changes, trade patterns, and industry developments. Regular updates review new product launches, capacity changes, partnerships, approvals, procurement trends, and shifts in commercial adoption.
What is the report’s scope and coverage?
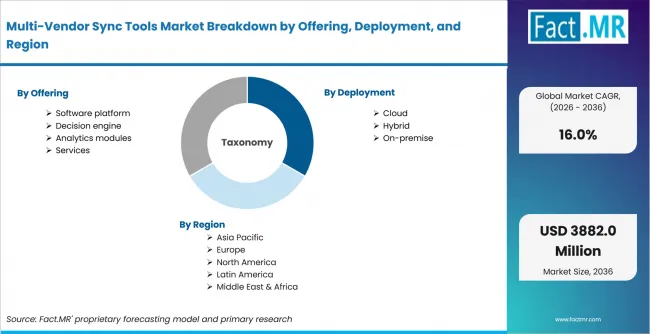
Multi Vendor Sync Tools Market Breakdown By Offering, Deployment, And Region | Source: Fact.MR
| Attribute | Details |
|---|---|
| Quantitative Units | USD million |
| Market Definition | Software platforms and services that synchronize data, events and workflow states across multiple vendor applications. |
| Offering | Software platform; Decision engine; Analytics modules; Services |
| Deployment | Cloud; Hybrid; On-premise |
| Capability | Forecasting; Optimization; Generative assistance; Orchestration |
| Customer | Large enterprise; Mid-market; Specialists |
| Regions Covered | North America; Latin America; Western Europe; Eastern Europe; East Asia; South Asia & Pacific; Middle East & Africa |
| Countries Covered | USA; South Korea; UK; Japan; Germany |
| Key Companies Profiled | MuleSoft; Boomi; Celigo; Workato; Jitterbit; SnapLogic |
| Forecast Period | 2026 to 2036 |
| Approach | Hybrid top-down and bottom-up approach using application estate size, connector workload, deployment mix, country adoption and provider portfolio review. |
How is the market segmented?
-
By Offering:
- Software platform
- Decision engine
- Analytics modules
- Services
-
By Deployment:
- Cloud
- Hybrid
- On-premise
-
By Capability:
- Forecasting
- Optimization
- Generative assistance
- Orchestration
-
By Customer:
- Large enterprise
- Mid-market
- Specialists
-
By Region:
- North America
- Latin America
- Western Europe
- Eastern Europe
- East Asia
- South Asia & Pacific
- Middle East & Africa