- Market Value (2025): USD 10.3 Bn
- Estimated Value (2026): USD 12.2 Bn
- Forecast Value (2036): USD 66.9 Bn
- CAGR (2026-2036): 18.5%
What is the Nanotechnology-enabled Battery Market forecast to be worth by 2036?
USD 12.2 billion in 2026 to USD 66.9 billion by 2036 at an 18.5% CAGR.
- Nanotechnology-enabled battery sales came to USD 10.3 billion in 2025, with graphene electrodes and silicon-rich anodes moving from pilot lines into qualified cell programs.
- Revenue will grow from USD 12.2 billion in 2026 to USD 66.9 billion by 2036 as electric vehicle platforms, premium smartphones and stationary storage sites specify higher energy density per cell.
- An 18.5% CAGR reflects a young material base scaling quickly, where each new plant for silicon or graphene anode material adds capacity that cell makers can qualify within two to three years.
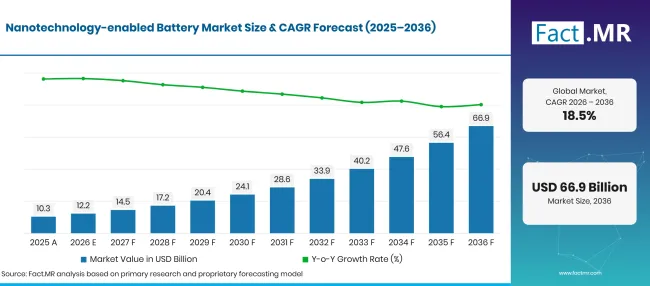
Nanotechnology Enabled Battery Market Forecast Global | Source: Fact.MR
| Year | Basis | Market Value (USD billion) |
|---|---|---|
| 2025 | Actual | 10.3 |
| 2026 | Estimate | 12.2 |
| 2036 | Forecast | 66.9 |
| CAGR 2026 to 2036 | Forecast period | 18.5% |
Source: Fact.MR analysis. Updated Nov 4, 2026
What are the defining numbers behind Nanotechnology-enabled Battery Market growth?
The 2026 to 2036 period will add USD 54.7 billion in new value, concentrated in automotive cells and industrial storage packs.
- Demand Drivers in the Market
- Electric car buyers keep raising the bar on range and charging time. Global electric car sales exceeded 17 million in 2024, a sales share above 20%, according to the International Energy Agency [1]. Each of those vehicles carries a pack where a higher-capacity anode or a more conductive electrode can cut weight or add range.
- Silicon offers a step change in anode capacity. Panasonic Energy notes that silicon can hold about 10 times more lithium than graphite, and the company is working to suppress the swelling that follows [2]. Nanostructured silicon particles and carbon scaffolds are the main engineering answer to that swelling.
- Phone and wearable brands want more energy in the same slim casing. Enovix reported in January 2026 that independent testing measured its AI-1 smartphone battery at 935 Wh/L using a 100% active silicon anode [3]. Results like this push consumer device makers to qualify nanomaterial anodes ahead of automotive programs.
- Public industrial policy is pulling cell and material plants closer to end markets. The European Commission adopted its Battery Booster Strategy on 28 January 2026 to strengthen European battery manufacturing and its place in global value chains [4]. Similar programs in the United States and Japan give material suppliers firmer volume signals.
- Plant openings are turning specialist materials into industrial inputs. Sila began operations at its automotive-scale silicon anode plant in Moses Lake, Washington, in September 2025, with initial support for 2 to 5 GWh of cell capacity [5].
- Key Segments Analyzed
- By Material Type: Graphene will hold 55.7% share in 2026 because its conductivity and thin-sheet structure suit both conductive additives and composite anodes.
- By Application: Automotive will account for 52.0% of 2026 demand, as electric vehicle packs set the strictest targets for range and fast charging.
- By Battery Type: Lithium-ion will capture 42.3% in 2026, since nanomaterials can drop into existing lithium-ion lines with few tooling changes.
- By End-User: Industrial will command 71.0% of 2026 value, given that factories, utilities and energy storage operators buy cells in bulk under long service contracts.
- Analyst Opinion at Fact.MR
- Shambhu Nath Jha, Principal Consultant at Fact.MR, states, “Nanotechnology in batteries has passed the proof stage, and the next ten years will be about yield, cost and supply security. Graphene and silicon will win share wherever cell makers can drop them into existing lithium-ion lines without rebuilding the factory. Suppliers that can ship the same particle size and purity at tonne scale, year after year, will set the pace for the whole market.”
- Strategic Implications
- Cell manufacturers should run graphene and silicon anode trials on current production lines first, since drop-in materials shorten qualification and protect existing capital.
- Nanomaterial producers should invest in dispersion control and batch consistency, because automotive buyers reject materials that vary from lot to lot.
- Vehicle makers and electronics brands should sign multi-year supply agreements with more than one anode material source to reduce exposure to single plants.
- Investors should weigh plant start-up records and customer qualification status over laboratory performance claims when comparing material developers.
The United States heads the five-country comparison at 23.8%, as federal research funding and new domestic anode plants shorten the path from lab to cell. The United Kingdom follows closely at 22.9%, with a fast-rising zero emission car fleet creating pull for higher-capacity cells. Germany, at 21.7%, trails the UK by just over a point, its strength in vehicle manufacturing offset by slower domestic cell output. A wider gap separates Japan at 19.4%, where a mature cell industry grows from a higher base. Brazil, at 13.7%, closes the range, since electric car adoption there is still early and most cells are imported.
How does the Nanotechnology-enabled Battery Market break down by segment?
Graphene will lead Material Type at 55.7%; Automotive will head Application at 52.0%; Lithium-ion will lead Battery Type at 42.3%; Industrial will hold End-User at 71.0% in 2026.
Which Material Type leads?
Graphene holds 32.1% of 2026 sales.
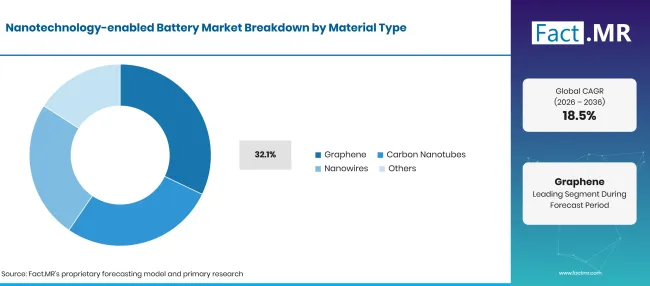
Nanotechnology Enabled Battery Market Breakdown Material Type | Source: Fact.MR
| Material Type | Share (2026) |
|---|---|
| Graphene (Leading segment) | 55.7% |
| Other segments combined | 44.3%* |
| Total | 100.0% |
Source: Fact.MR analysis. Updated Nov 4, 2026
Electrode formulators value graphene for its electrical conductivity and its single-layer carbon structure, which lets small loadings form a dense conductive network. It works as an additive in cathodes and as a scaffold in composite anodes, giving it reach across several chemistries. Demand for the graphene battery format adds a further pull from fast-charge consumer devices. Carbon nanotubes compete for the same conductive-additive role and are often sold as pre-mixed pastes, a niche tracked in conductive CNT dispersions. Nanowires remain closer to pilot scale, with uptake limited by growth cost and handling. The other materials group covers metal oxide nanoparticles and nanostructured coatings used on cathode particles.
What supports Automotive within Application?
Automotive takes 52.0% of 2026 revenue.
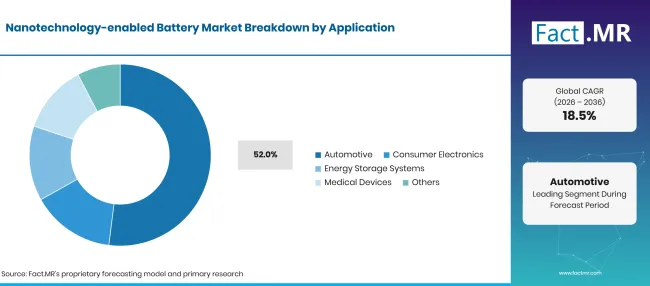
Nanotechnology Enabled Battery Market Breakdown Application | Source: Fact.MR
| Application | Share (2026) |
|---|---|
| Automotive (Leading segment) | 52.0% |
| Other segments combined | 48.0%* |
| Total | 100.0% |
Source: Fact.MR analysis. Updated Nov 4, 2026
Vehicle makers face a direct trade between pack weight, range and price, and nanostructured anodes can improve all three. Silicon-carbon composites raise lithium storage per gram, while graphene additives cut internal resistance and help fast charging. Rising electric car volumes keep automotive cell programs the main testing ground for new electrode materials, and supply contracts signed for one vehicle platform often run for most of a decade. Consumer electronics is the second channel, where thin devices reward any gain in volumetric energy density. Energy storage systems use nanomaterials mainly to extend cycle life. Medical devices form a small, specialist share that values reliability and certified supply.
How does Battery Type shape demand?
Lithium-ion represents 42.3% of 2026 sales.
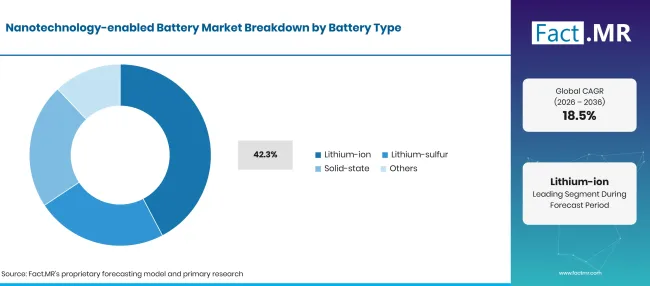
Nanotechnology Enabled Battery Market Breakdown Battery Type | Source: Fact.MR
| Battery Type | Share (2026) |
|---|---|
| Lithium-ion (Leading segment) | 42.3% |
| Other segments combined | 57.7%* |
| Total | 100.0% |
Source: Fact.MR analysis. Updated Nov 4, 2026
Cell plants built for graphite anodes and liquid electrolytes can take graphene additives or silicon anode battery materials with modest changes to mixing and coating steps. That compatibility lowers the cost of trying nanomaterials and keeps lithium-ion the first platform where they are sold, as seen across the wider lithium-ion battery supply chain. Lithium-sulfur cells use nanostructured carbon hosts to trap sulfur and slow capacity loss, but volumes remain small. Solid-state designs depend on thin electrolyte layers and clean interfaces, an area covered in solid-state battery materials. Both chemistries will widen demand later in the forecast period.
What supports Industrial within End-User?
Industrial accounts for 71.0% of 2026 value.
| End-User | Share (2026) |
|---|---|
| Industrial (Leading segment) | 71.0% |
| Other segments combined | 29.0%* |
| Total | 100.0% |
Source: Fact.MR analysis. Updated Nov 4, 2026
Utilities, data centers, factories and fleet depots buy batteries in large blocks and judge them on cycle life and total cost per stored kilowatt-hour. Nanostructured electrodes help cells last more cycles before capacity fades, which suits these buyers. The U.S. Energy Information Administration reported about 43.6 GW of operational utility-scale battery storage by the end of 2025 [6]. Automotive end-users buy through vehicle programs with long qualification cycles. Consumer electronics brands value thin form factors and fast charging. Healthcare users require small, certified cells for implants and portable equipment, where silicon-graphene composites are under evaluation.
What is accelerating Nanotechnology-enabled Battery Market adoption, and what is holding it back?
Electric vehicle growth, thinner consumer devices and grid storage build-out are pulling graphene, nanotube and silicon materials into commercial cells. Material cost, silicon swelling during charging and uneven dispersion in electrode slurries still slow adoption, and many emerging chemistries need several more years of field data before buyers commit at scale.
Drivers Impact Analysis
| DRIVER | (~) % IMPACT ON CAGR | GEOGRAPHIC RELEVANCE | IMPACT TIMELINE |
|---|---|---|---|
| DRIVER | (~) % IMPACT ON CAGR | GEOGRAPHIC RELEVANCE | IMPACT TIMELINE |
| Integration of nanostructured materials into lithium-ion electrodes | +2.4% | Global | Short term (<=2 years) |
| Electric vehicle production and demand for higher energy density cells | +2.1% | East Asia, Western Europe, North America | Medium term (2-4 years) |
| Advanced batteries in smartphones and wearables | +1.6% | East Asia, North America | Medium term (2-4 years) |
| Growth of stationary energy storage | +1.2% | Global | Long term (>=4 years) |
Source: Fact.MR analysis. Updated Nov 4, 2026
Opportunity Impact Analysis
| OPPORTUNITY | (~) % IMPACT ON CAGR | GEOGRAPHIC RELEVANCE | IMPACT TIMELINE |
|---|---|---|---|
| OPPORTUNITY | (~) % IMPACT ON CAGR | GEOGRAPHIC RELEVANCE | IMPACT TIMELINE |
| Commercial graphene electrode supply | +1.2% | Global | Short term (<=2 years) |
| Expansion of silicon-carbon anode plants | +1.0% | North America, East Asia, Western Europe | Medium term (2-4 years) |
| Nanomaterial-enhanced solid-state cells | +0.8% | Japan, Germany, United States | Medium term (2-4 years) |
| Long-life cells for grid storage | +0.6% | North America, Western Europe, East Asia | Long term (>=4 years) |
Source: Fact.MR analysis. Updated Nov 4, 2026
Restraints Impact Analysis
| RESTRAINT | (~) % IMPACT ON CAGR | GEOGRAPHIC RELEVANCE | IMPACT TIMELINE |
|---|---|---|---|
| RESTRAINT | (~) % IMPACT ON CAGR | GEOGRAPHIC RELEVANCE | IMPACT TIMELINE |
| High production cost of specialised nanomaterials | -0.9% | Global | Short term (<=2 years) |
| Silicon expansion and electrode degradation during cycling | -0.7% | Global | Short term (<=2 years) |
| Complex dispersion and electrode coating processes | -0.5% | East Asia, Western Europe, North America | Medium term (2-4 years) |
| Limited field validation of emerging chemistries | -0.3% | Global | Long term (>=4 years) |
Source: Fact.MR analysis. Updated Nov 4, 2026
Which countries are scaling the Nanotechnology-enabled Battery Market through 2036?
| Country | CAGR (2026 to 2036) |
|---|---|
| United States | 23.8% |
| United Kingdom | 22.9% |
| Germany | 21.7% |
| Japan | 19.4% |
| Brazil | 13.7% |
Source: Fact.MR analysis. Updated Nov 4, 2026
What supports United States adoption?
23.8% CAGR, driven by federal research funding and new domestic anode plants.
Grid storage is a large outlet for long-life cells, with about 43.6 GW of utility-scale battery storage operating at the end of 2025 [6]. On the materials side, the U.S. Department of Energy cleared a project in April 2026 for the University of North Dakota to build and test a plasma-assisted reactor for silicon anode materials, with graphene production and battery testing included in the scope [7]. Plants such as Sila’s Moses Lake site add domestic silicon anode supply [5].
How is the United Kingdom scaling demand?
22.9% CAGR, helped by a quickly expanding zero emission car fleet.
The Department for Transport reported 473,000 zero emission cars registered for the first time in 2025, up 24% and equal to 23% of new car registrations [8]. Licensed zero emission cars reached 1,737,000 by December 2025 [8]. That fleet creates steady demand for cells with higher energy density, and British research groups are active in silicon anodes and engineered conductive carbons that suit pilot production.
What supports Germany’s growth?
21.7% CAGR, backed by a deep vehicle manufacturing base.
The Kraftfahrt-Bundesamt recorded 545,142 new battery electric passenger cars in Germany in 2025, a 19.1% share of registrations and 43.2% more than in 2024 [9]. German vehicle makers are among the main buyers of high-energy cells in Europe. The European Battery Booster Strategy supports cell and material plants across the EU, which gives German carmakers more local sources for silicon-carbon and graphene-enhanced cells [4].
How does Japan perform?
19.4% CAGR, reflecting a mature cell industry growing from a higher base.
Japan’s Battery and Power Industry Strategy, released in June 2026, targets 150 GWh a year of domestic battery manufacturing from 2030 to the mid-2030s and full commercial use of all-solid-state batteries around 2030 [10]. Domestic cell makers are moving to silicon negative electrodes to raise EV battery capacity [2]. Solid-state work also relies on thin nanostructured electrolyte and electrode layers.
How is Brazil developing demand?
13.7% CAGR, as electric car adoption moves past its early stage.
Electric car sales in Brazil more than doubled to 125,000 in 2024, reaching a sales share above 6%, according to the IEA [1]. Most of those vehicles were imported, so local demand for nanomaterial cells arrives mainly through finished vehicles. Growth in solar and wind generation also opens room for stationary storage, where long-life cells will gain share as local assembly develops.
Who leads the Nanotechnology-enabled Battery Market?
Competition splits into three groups. Large cell makers, namely Samsung SDI, Panasonic Energy, LG Energy Solution and Wanxiang A123 Systems, control customer access and plant capacity, and they adopt nanomaterials when the materials fit existing lines. Samsung SDI unveiled a pouch-type all-solid-state battery sample at InterBattery 2026 in March [12], while LG Energy Solution is building dry electrode pilot lines at its Ochang plant in Korea, aiming for commercial production in 2028 [13].
Silicon cell specialists Amprius Technologies and Enovix sell finished cells to aviation, defense and phone customers; Amprius added Nanotech Energy as its first U.S. contract manufacturer in February 2026 [11]. Material suppliers Sila, Group14 Technologies and Resonac sell anode powders and conductive carbons to all of them. Success will come down to which suppliers can match laboratory results at plant scale, hold batch quality steady and secure long-term offtake from cell makers.
Which companies are the key providers?
Key companies include Samsung SDI, Panasonic Energy, LG Energy Solution, Wanxiang A123 Systems, Amprius Technologies, Enovix, Sila, Group14 Technologies and Resonac.
- Samsung SDI
- Panasonic Energy
- LG Energy Solution
- Wanxiang A123 Systems
- Amprius Technologies
- Enovix
- Sila
- Group14 Technologies
- Resonac
Bibliography
- [1] International Energy Agency. (2025, May 14). Global EV Outlook 2025: Executive summary.
- [2] Panasonic Energy Co., Ltd. (2026, February 5). Panasonic Energy’s Latest Technology: The Challenge of Increasing Capacity in Lithium-Ion Batteries for EVs.
- [3] Enovix Corporation. (2026, January 13). Independent Testing Confirms Enovix AI-1 Achieves 935 Wh/L: Setting a New Benchmark for Smartphone Batteries.
- [4] European Commission. (2026, January 28). Communication from the Commission: Battery booster strategy.
- [5] Sila Nanotechnologies, Inc. (2025, September 23). Sila Opens Nation’s First Automotive-Scale Silicon Anode Plant, Ushering in a New Era for U.S. Battery Manufacturing.
- [6] U.S. Energy Information Administration. (2026, August 7). Battery storage capacity averaged 70% growth over the last three years.
- [7] U.S. Department of Energy. (2026, April 29). Producing Silicon Anode Materials for Li-ion Batteries.
- [8] Department for Transport. (2026, April 29). Vehicle licensing statistics, United Kingdom: 2025.
- [9] Kraftfahrt-Bundesamt. (2026, January 6). Fahrzeugzulassungen im Dezember 2025: Jahresbilanz.
- [10] Ministry of Economy, Trade and Industry. (2026, June 2). Battery and Power Industry Strategy.
- [11] Amprius Technologies, Inc. (2026, February 3). Amprius Secures Strategic U.S.-Based Manufacturing Partner to Scale Domestic Silicon Anode Battery Production.
- [12] Samsung SDI Co., Ltd. (2026, March 9). SAMSUNG SDI Unveils All-Solid-State Battery for Physical AI.
- [13] LG Energy Solution Ltd. (2025, September 22). LG Energy Solution Unlocks New Value for Customers with Cutting-Edge Dry Electrode Process.
This Report Answers
- How is revenue divided across material type, application, battery type and end-user?
- Why does graphene hold the top material position, and where do carbon nanotubes and nanowires fit?
- Which electric vehicle and electronics trends create the strongest pull for nanostructured electrodes?
- What separates lithium-ion, lithium-sulfur and solid-state cells in their use of nanomaterials?
- How do growth rates differ across the United States, the United Kingdom, Germany, Japan and Brazil?
- Where do cell makers, silicon cell specialists and material suppliers each compete?
What does the Nanotechnology-enabled Battery Market cover?
This study values battery cells and electrode materials whose performance depends on nanoscale structures. Graphene sheets, carbon nanotubes, nanowires, silicon nanoparticles and nanostructured coatings all fall inside the definition when they are built into a commercial cell.
Value is counted at the cell and material level across lithium-ion, lithium-sulfur and solid-state chemistries. Battery packs, vehicles and devices are not valued in full, so the figures reflect only the nanotechnology-enabled battery content.
What is included in the scope?
Graphene, carbon nanotube and nanowire materials sold for use in battery electrodes.
Silicon-carbon and other nanostructured anode materials sold to cell makers.
Finished cells that use nanomaterial electrodes in vehicles, electronics, storage systems and medical devices.
Country coverage for the United States, the United Kingdom, Germany, Japan and Brazil, plus all seven regions.
What is excluded from the scope?
Conventional lithium-ion, lead-acid and nickel-based cells with no nanoscale electrode materials.
The full value of vehicles, phones, medical equipment and storage installations that use these cells.
Graphene and nanotube production sold for uses outside batteries, such as composites and coatings.
Mining, battery recycling services and unrelated electronic components.
How Was the Analysis Built?
The analysis draws on 120+ sources, 35+ company portfolios, 25+ countries, and more than 20 industry interviews.
- Primary Research: Primary research includes discussions with manufacturers, service providers, technology developers, distributors, end users, and subject-matter experts. These conversations examine purchasing priorities, product adoption, operational challenges, approval requirements, competitive positioning, and the factors that influence wider market acceptance.
- Desk Research: Desk research covers government statistics, regulatory publications, company filings, trade data, technical studies, industry associations, standards, public policy, and other authoritative sources. Every source used in the analysis is documented in the bibliography.
- Market Sizing and Forecasting: Market estimates combine historical performance, demand indicators, pricing and volume trends, segment shares, company participation, country-level growth, adoption patterns, investment activity, and barriers to market expansion.
- Data Validation and Update Cycle: Findings are validated by comparing primary interviews with public data, company activity, regulatory changes, trade patterns, and industry developments. Regular updates review new product launches, capacity changes, partnerships, approvals, and shifts in commercial adoption.
Segmentation
What is the report’s scope and coverage?
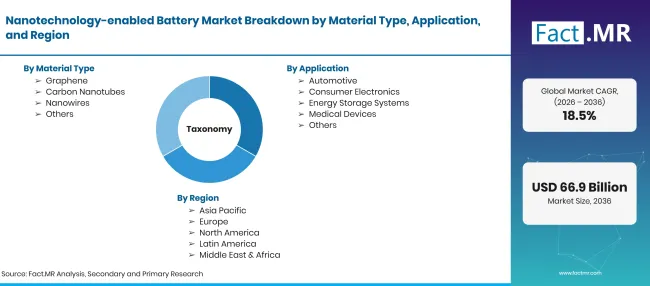
Factmr Nanotechnology Enabled Battery Market Taxonomy | Source: Fact.MR
| Attribute | Details |
|---|---|
| Quantitative Units | USD billion |
| Market Definition | Battery cells and electrode materials that use graphene, carbon nanotubes, nanowires or engineered nanostructures to raise energy density, conductivity, charging speed or cycle life. |
| Material Type | Graphene; Carbon Nanotubes; Nanowires; Others |
| Application | Automotive; Consumer Electronics; Energy Storage Systems; Medical Devices; Others |
| Battery Type | Lithium-ion; Lithium-sulfur; Solid-state; Others |
| End-User | Industrial; Automotive; Consumer Electronics; Healthcare; Others |
| Regions Covered | North America; Latin America; Western Europe; Eastern Europe; East Asia; South Asia & Pacific; Middle East & Africa |
| Countries Covered | United States; United Kingdom; Germany; Japan; Brazil |
| Companies Profiled | Samsung SDI; Panasonic Energy; LG Energy Solution; Wanxiang A123 Systems; Amprius Technologies; Enovix; Sila; Group14 Technologies; Resonac |
| Forecast Period | 2026 to 2036 |
| Approach | Cell and material capacity mapped against electric vehicle, electronics and storage demand, with nanomaterial content tracked by chemistry. |
Source: Fact.MR analysis. Updated Nov 4, 2026
How is the market segmented?
-
By Material Type
- Graphene
- Carbon Nanotubes
- Nanowires
- Others
-
By Application
- Automotive
- Consumer Electronics
- Energy Storage Systems
- Medical Devices
- Others
-
By Battery Type
- Lithium-ion
- Lithium-sulfur
- Solid-state
- Others
-
By End-User
- Industrial
- Automotive
- Consumer Electronics
- Healthcare
- Others
-
By Region
- North America
- Latin America
- Western Europe
- Eastern Europe
- East Asia
- South Asia & Pacific
- Middle East & Africa
Frequently Asked Questions
How large is the nanotechnology-enabled battery market in 2026?
What growth rate will the nanotechnology-enabled battery market record?
Which material type leads?
Which application leads?
Which battery type leads?
Which end-user leads?
Which country will grow quickest?
Who are the main companies?
What holds the market back?
Who worked on this report


Preview the report firsthand - request a free sample
Free SampleGet the brochure for pricing and purchase details
Download PDF