- Market Value (2025): USD 26.0 Bn
- Estimated Value (2026): USD 26.6 Bn
- Forecast Value (2036): USD 34.1 Bn
- CAGR (2026-2036): 2.5%
What is the Sensory Additives Market forecast to be worth by 2036?
USD 26.6 billion in 2026 to USD 34.1 billion by 2036, at 2.5% CAGR.
- The sensory additives market reached USD 26.0 billion in 2025.
- Demand is projected to increase from USD 26.6 billion in 2026 to USD 34.1 billion by 2036.
- The market is forecast to record 2.5% CAGR from 2026 to 2036 as food brands, beverage formulators and feed producers specify additive systems with repeatable performance.
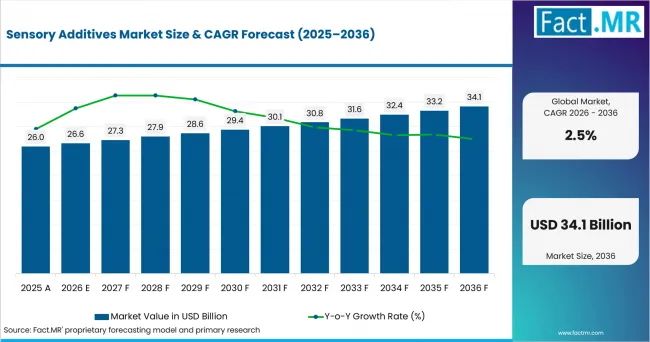
Sensory Additives Market Value Analysis | Source: Fact.MR
What are the defining numbers behind Sensory Additives Market growth?
USD 7.5 billion absolute opportunity by 2036, led by Flavors, Natural and Food Industry applications.
- Demand Drivers in the Market
- Food manufacturers need repeatable flavor profiles during sugar, salt and color reformulation. FDA issued an order on January 15, 2025, to revoke the authorization for FD&C Red No. 3 in food and ingested drugs, with the revocation effective in 2027 for food and 2028 for ingested drugs.
- Beverage formulators need soluble systems for clear drinks and concentrates. Water soluble ingredients reduce haze risk and help developers control taste release in shelf-stable products.
- Bakery and confectionery brands need color and texture stability after heat and storage. Natural color systems are expected to gain trials where heat, pH and light stability can be documented.
- Feed and pet food producers need palatability support when base formulas change. Flavor and texturant choices are anticipated to help producers maintain intake consistency when proteins or minerals alter taste.
- Regulatory teams need additive files before ingredients enter launch pipelines. Documentation depth is expected to affect supplier selection where brands serve several destination markets.
- Key Segments Analyzed
- By Product: Flavors are expected to hold 29.8% share in 2026 because food flavors directly shape taste acceptance in food, beverages and feed.
- By Nature: Natural is projected to account for 55.3% share in 2026, supported by clean-label reformulation and plant-derived ingredient selection.
- By Form: Liquid is anticipated to capture 41.3% share in 2026 owing to dosing ease and faster dispersion in beverage and sauce lines.
- By Solubility: Water Soluble is estimated to represent 49.8% share in 2026 since drink systems require clarity and consistent release.
- By End Use Industry: Food Industry is forecast to hold 38.7% share in 2026 due to bakery, confectionery, dairy and processed food applications.
- Analyst Opinion at Fact.MR
- Shambhu Nath Jha, Principal Consultant at Fact.MR, states, "Sensory additives are no longer chosen only for taste impact. Buyers are asking whether a flavor, color or texture system stays stable after processing and whether the supplier can defend the ingredient file. Natural systems are projected to gain where performance data, application support and regulatory documentation move together."
- Strategic Implications
- Flavor houses should connect taste profiles with application data so product teams can compare prototypes against regional consumer expectations.
- Color suppliers should document pH, light and heat stability before brands begin full production trials.
- Hydrocolloid and texturant providers should document texture recovery hydrocolloids performance after processing, cooling and storage.
- Feed additive specialists should align specialty feed additives trials with protein, mineral and botanical inputs that can shift intake.
USA is expected to record 5.4% CAGR through 2036, supported by food-spending scale and color reformulation. South Korea is projected to post 5.0% as exports and food manufacturing scale support localized flavor work. The U.K. is forecast to reach 4.8%, reflecting packaged-food spending and authenticity controls. Germany is anticipated to record 4.7% because retail food and export channels require stable formulations. Japan is estimated to reach 4.6%, supported by quality expectations and food export programs. France is expected to record 4.5% through food manufacturing scale. Italy is forecast to reach 4.3% as regional food identity and export branding keep taste consistency central.
How does the Sensory Additives Market break down by segment?
Which Product dominates?
Flavors hold 29.8% share in 2026.
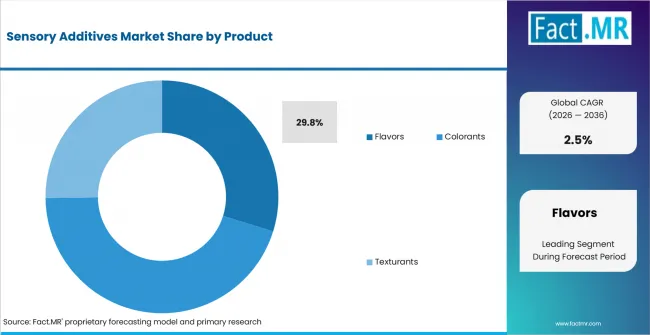
Sensory Additives Market Analysis By Product | Source: Fact.MR
Flavors are expected to lead Product because taste remains the first acceptance point across beverages, bakery, dairy, confectionery and processed foods. Standardized flavor systems help manufacturers reduce batch variation across facilities, improve formulation consistency and support faster product scaling while maintaining recognizable sensory profiles across multiple production runs.
What leads the Nature segment?
Natural accounts for 55.3% share in 2026.
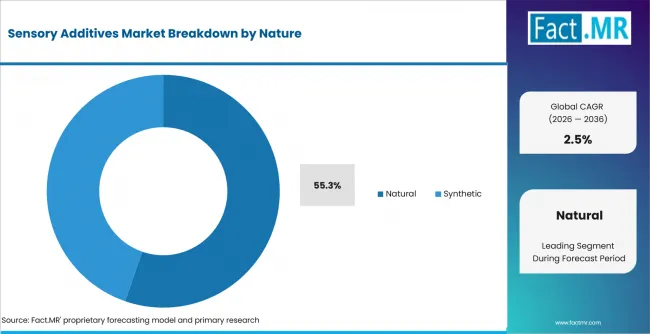
Sensory Additives Market Analysis By Nature | Source: Fact.MR
Natural is projected to lead Nature as brands increasingly seek plant-derived and microbial-derived ingredients for cleaner positioning. Natural food color additives require stronger formulation validation because pH, light, heat and storage conditions can alter shade, stability and appearance, increasing the importance of application testing before commercial production begins.
How does Form shape demand?
Liquid captures 41.3% share in 2026.
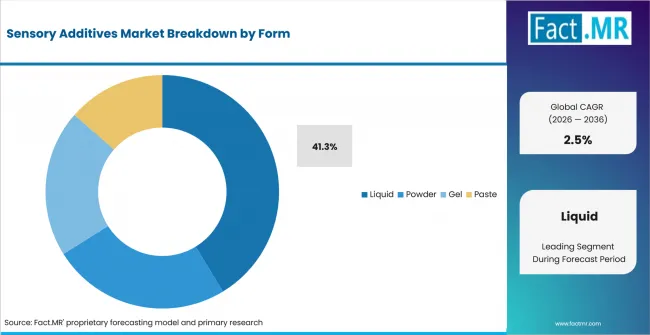
Sensory Additives Market Analysis By Form | Source: Fact.MR
Liquid is anticipated to lead Form because beverage plants, sauces and other fluid-processing lines benefit from easier dosing, blending and dispersion. Encapsulated flavors and fragrances support applications that require controlled release or greater stability under heat and storage stress, giving formulators more flexibility when balancing processing performance with sensory quality.
What supports Water Soluble within Solubility?
Water Soluble represents 49.8% share in 2026.
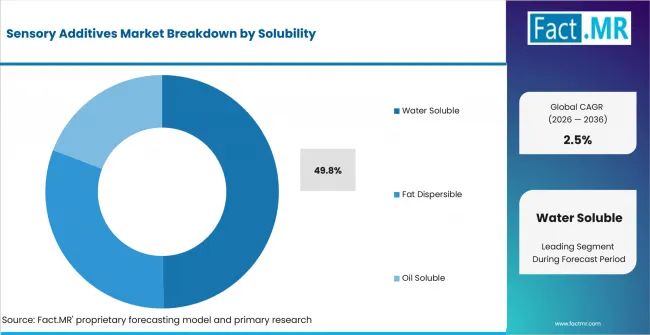
Sensory Additives Market Analysis By Solubility | Source: Fact.MR
Water Soluble is estimated to lead Solubility because clear beverages, syrups and water-based formulations require clean dispersion and consistent appearance. These systems simplify processing where rapid incorporation is important, while fat-dispersible alternatives remain relevant in high-fat foods, emulsions and other applications where compatibility with lipid-rich matrices determines performance.
What supports Food Industry within End Use Industry?
Food Industry holds 38.7% share in 2026.
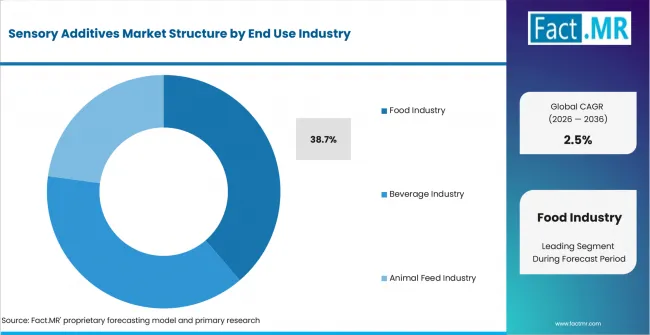
Sensory Additives Market Analysis By End Use Industry | Source: Fact.MR
Food Industry is forecast to lead End Use Industry because bakery, confectionery, dairy and processed food manufacturers use flavor, color and functional systems across product portfolios. Food stabilizers support texture and consistency when formulations reduce sugar or fat, helping brands maintain sensory performance while adapting recipes to changing consumer preferences.
What is accelerating Sensory Additives Market adoption, and what is holding it back?
Reformulation drives it; validation cost restrains it.
Drivers Impact Analysis
| Driver | (~) % Impact on CAGR | Geographic Relevance | Impact Timeline |
|---|---|---|---|
| Clean-label flavor and color reformulation | +0.55% | North America, Europe, East Asia | Short term (<= 2 years) |
| Water soluble beverage systems | +0.40% | Global | Short term (<= 2 years) |
| Texture recovery in bakery and dairy | +0.30% | Europe, North America | Medium term (2-4 years) |
| Feed palatability support | +0.20% | North America, East Asia | Medium term (2-4 years) |
| Documentation-led supplier qualification | +0.15% | Global | Long term (>= 4 years) |
Source: Fact.MR analysis. Updated Aug 20, 2026
- Clean-label flavor and color reformulation: FDA’s January 2025 action on FD&C Red No. 3 established reformulation deadlines of January 15, 2027, for food products and January 18, 2028, for ingested drugs.
- Water soluble beverage systems: Beverage makers are anticipated to favor additives that disperse quickly and stay clear in concentrates.
- Texture recovery in bakery and dairy: Gum hydrocolloids are projected to help restore viscosity where sugar or fat reduction weakens mouthfeel.
- Feed palatability support: Feed producers are expected to use flavors and texturants when nutrition changes affect intake.
- Documentation-led supplier qualification: Food companies are forecast to approve suppliers that provide regulatory files and batch records quickly.
Opportunity Impact Analysis
| Opportunity | (~) % Impact on CAGR | Geographic Relevance | Impact Timeline |
|---|---|---|---|
| Natural color replacement systems | +0.35% | USA, Europe | Short term (<= 2 years) |
| Localized flavor profiles for exports | +0.25% | East Asia, Europe | Medium term (2-4 years) |
| Liquid and water based formats | +0.20% | Global | Short term (<= 2 years) |
| Feed and pet food palatability | +0.15% | North America, East Asia | Long term (>= 4 years) |
Source: Fact.MR analysis. Updated Aug 20, 2026
- Natural color replacement systems: Suppliers with stronger stability data are expected to move faster from sample stage to supply agreements.
- Localized flavor profiles for exports: Export brands are anticipated to request flavors that protect home-country identity and destination-market compliance.
- Liquid and water based formats: Liquid systems are projected to win more beverage briefs because they simplify dosing and reduce dust handling.
- Feed and pet food palatability: Trials that link taste acceptance with intake consistency are expected to carry more weight in procurement.
Restraints Impact Analysis
| Restraint | (~) % Impact on CAGR | Geographic Relevance | Impact Timeline |
|---|---|---|---|
| Natural ingredient cost and variation | -0.30% | Global | Short term (<= 2 years) |
| Stability testing requirements | -0.25% | Europe, North America | Medium term (2-4 years) |
| Regulatory file complexity | -0.20% | Global | Medium term (2-4 years) |
| Limited substitution in legacy recipes | -0.10% | Mature markets | Long term (>= 4 years) |
Source: Fact.MR analysis. Updated Aug 20, 2026
- Natural ingredient cost and variation: Botanical and microbial inputs can vary by crop, process and origin.
- Stability testing requirements: Natural colors and flavors often need heat, pH and light testing before scale-up.
- Regulatory file complexity: Additives sold across the USA, Europe and Asia need ingredient files aligned with each destination.
- Limited substitution in legacy recipes: Older recipes often have sensory targets that consumers recognize immediately.
Which countries are scaling the Sensory Additives Market through 2036?
- The country comparison spans 1.1 percentage points across the forecast period.
- The USA remains 0.4 percentage point above South Korea, supported by food spending scale and color reformulation.
- South Korea remains 0.2 percentage point above the U.K. as food exports and domestic production support localized flavor work.
- The U.K. remains 0.1 percentage point above Germany through packaged-food spending and authenticity controls.
- Germany remains 0.1 percentage point above Japan, while Japan stays 0.1 percentage point above France through quality and import controls.
- France remains 0.2 percentage point above Italy because food manufacturing scale offsets tighter export and margin pressure.
Sensory Additives Market is segmented into North America, Latin America, Western Europe, Eastern Europe, East Asia, South Asia & Pacific, Middle East & Africa.
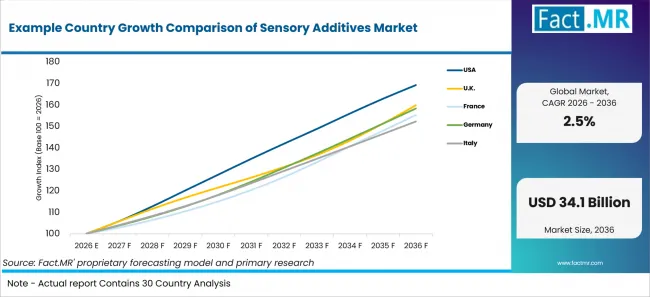
Example Country Growth Comparison Of Sensory Additives Market | Source: Fact.MR
| Country | CAGR (2026-2036) |
|---|---|
| USA | 5.4% |
| South Korea | 5.0% |
| U.K. | 4.8% |
| Germany | 4.7% |
| Japan | 4.6% |
| France | 4.5% |
| Italy | 4.3% |
Source: Fact.MR analysis. Updated Aug 20, 2026
What supports USA adoption?
5.4% CAGR through 2036, supported by food-spending scale and color reformulation.
The USA’s growth reflects substantial food spending and active reformulation across color, flavor and palatability systems. Total U.S. food spending reached USD 2.51 trillion in 2025, while the FDA’s January 2025 revocation of FD&C Red No. 3 requires affected food manufacturers to reformulate products by January 15, 2027. Beverage and feed applications broaden demand, although natural-system testing, botanical variability and pricing pressure may slow reformulation.
How is South Korea scaling demand?
5.0% CAGR through 2036, led by food exports and standards work.
South Korea’s growth is supported by expanding food exports, rising domestic production and demand for localized sensory systems. K-Food Plus exports reached a provisional USD 13.62 billion in 2025, while South Korea’s food-industry production increased 4.3% year over year to KRW 119.7372 trillion. Ramyeon, snacks, beverages and feed applications support tailored flavors and palatability additives, although export approvals and premium natural-ingredient costs may limit faster adoption.
What supports the U.K. outlook?
4.8% CAGR through 2036, driven by food spending and authenticity controls.
The U.K.’s growth reflects substantial consumer food spending and a sizable food-manufacturing base. Consumer expenditure on food and alcoholic drinks reached GBP 303.3 billion in 2025, while food manufacturing represented 22.9% of manufacturers’ product sales. Bakery, confectionery, dairy and beverage applications support sensory additives, although authenticity controls, botanical traceability and specialist labor constraints may extend reformulation cycles.
What underpins Germany's growth?
4.7% CAGR through 2036, backed by food retail scale and reformulation discipline.
Germany’s growth is supported by a large agricultural and retail base together with disciplined product reformulation. Agricultural sales revenue reached EUR 62.6 billion in 2025, while real retail sales increased 2.7%. Dairy, bakery and beverage producers support demand for texture, color and soluble flavor systems, although stability testing, residue documentation and EU additive requirements can lengthen qualification.
How does Japan perform?
4.6% CAGR through 2036, supported by quality expectations and export programs.
Japan’s growth reflects strict product-quality expectations, food export support and demand for consistent sensory performance. Japan’s food CPI increased 6.8% in 2025, while the government launched the Japan Food Export 10,000 Business Support Program in April 2026 to strengthen support for businesses seeking to expand food exports. Confectionery, dairy, beverage and feed manufacturers require familiar taste and stable formulations, although imported-food monitoring, additive approvals and botanical supply variability may constrain adoption.
What supports France adoption?
4.5% CAGR through 2036, driven by food industry scale and export discipline.
France’s growth is supported by a large food and beverage industry and established demand across dairy, bakery and regional flavor applications. France’s commercialized food and beverage production reached EUR 162 billion in 2024, while salaried employment in the agri-food industry stood at 649.4 thousand at the end of Q4 2025. Natural color testing, imported-input pressure and EU technical requirements may restrain faster reformulation.
How is Italy scaling demand?
4.3% CAGR through 2036, led by food production and export branding.
Italy’s growth reflects strong agri-food exports and demand for sensory systems that preserve regional product identity. Manufacturers are expected to favor consistent taste and color performance, although processed-food inflation, export-market approvals and botanical traceability requirements may limit supplier flexibility.
Who leads the Sensory Additives Market?
Competition is led by companies that combine flavor creation, color systems, texture expertise and regulatory documentation. Kerry Group plc remains active through taste mapping and application work, while ADM is expanding color and flavor capabilities in Kentucky. Sensient and Döhler GmbH compete through color and flavor portfolios that serve beverages, confectionery and prepared foods.
Novonesis represents the current identity for Chr. Hansen Holding A/S after the Novozymes and Chr. Hansen combination. IFF carries relevant DuPont nutrition and biosciences heritage, while Givaudan owns DDW and Naturex heritage in natural colors and extracts. Kalsec, McCormick & Company, Inc., Synergy Taste, Phodé and Bordas strengthen the specialist base across food flavors, extracts and animal palatability.
Suppliers are expected to compete on application proof, clean-label options and file quality rather than price alone. The most credible providers are those that can show shade stability, taste repeatability and regulatory readiness before a brand moves into commercial production.
Which companies are the key providers?
Key companies include Kerry Group plc; Novonesis; Sensient Technologies Corporation; Archer Daniels Midland Company; Döhler GmbH; IFF; Givaudan, including DDW and Naturex heritage; Kalsec Inc.; McCormick & Company, Inc.; Keva Flavours Pvt. Ltd.; H.E. Stringer Flavour Ltd.; Blends Ltd.; Flavour Makers; Cranbrook Flavours; Flavour Sensations; Kalex Flavours & Fragrances (Pty) Ltd.; U.K. Flavour; Synergy Taste; Phodé; Bordas.
- Kerry Group plc
- Novonesis
- Sensient Technologies Corporation
- Archer Daniels Midland Company
- Döhler GmbH
- IFF
- Givaudan, including DDW and Naturex heritage
- Kalsec Inc.
- McCormick & Company, Inc.
- Keva Flavours Pvt. Ltd.
- H.E. Stringer Flavour Ltd.
- Blends Ltd.
- Flavour Makers
- Cranbrook Flavours
- Flavour Sensations
- Kalex Flavours & Fragrances (Pty) Ltd.
- U.K. Flavour
- Synergy Taste
- Phodé
- Bordas
Bibliography
- Archer Daniels Midland Company. (2026, January 15). ADM’s $26M investment in Erlanger facility strengthens capabilities for growing reformulation demand.
- Archer Daniels Midland Company. (2026, July 31). ADM invests more than $16M to expand naturally derived color production capacity at Northern Kentucky facility.
- Agreste. (2025, December 17). Productions commercialisées des industries agroalimentaires 2024 : léger recul des ventes mais un niveau toujours élevé.
- U.S. Bureau of Labor Statistics. (2026, July 15). Producer Price Indexes—June 2026.
- Department for Environment, Food & Rural Affairs. (2026, July 29). Food statistics pocketbook.
- U.S. Food and Drug Administration. (2025, January 15). FDA to revoke authorization for the use of Red No. 3 in food and ingested drugs.
- Food Standards Agency. (2026, June 25). National Food Crime Unit—Annual Update.
- FranceAgriMer. (2026, June 3). Les performances à l'export des filières agricoles et agroalimentaires françaises - 2025.
- Agenzia ICE. (2025, September 5). Mercati in tempo reale: Il commercio estero dell’Italia e dei principali esportatori nel primo semestre 2025 (No. 71).
- Istituto di Servizi per il Mercato Agricolo Alimentare. (2026, January 22). AgriMercati ISMEA, III trimestre 2025: crescono il valore dell'agroalimentare italiano e l'export, con un nuovo record verso i 73 miliardi.
- Institut national de la statistique et des études économiques. (2026, February 27). In Q4 2025, payroll employment was virtually stable (Informations Rapides No. 53).
- Istituto Nazionale di Statistica. (2026, January 7). Consumer prices (provisional data) - December 2025.
This Report Answers
- The report explains where sensory additives are used across product type, nature, form, solubility and end-use industry.
- Segment analysis identifies the leading subsegments and the operational reasons formulators prioritize them.
- Country analysis examines the listed markets and the food, beverage or feed mechanisms supporting sensory additive use.
- Competitive analysis reviews active providers across flavors, colors, texturants and animal palatability.
- Application analysis assesses how taste, shade, mouthfeel and dispersion influence supplier selection.
What does the Sensory Additives Market cover?
The Sensory Additives Market covers ingredients that change or protect taste, color, texture, solubility and sensory acceptance. It includes flavors, colorants and texturants used in food, beverage and animal feed applications.
The assessment covers natural and synthetic additives across liquid, powder, gel and paste forms. Demand is assessed across food, beverage and feed uses, including soluble systems for drinks and texture systems for bakery or dairy formulations.
What is included in the scope?
The scope includes commercial sensory ingredients sold to food brands, beverage formulators, premix suppliers and feed producers. It includes gum hydrocolloids when used for mouthfeel or suspension.
It also includes flavors, colors, emulsifiers, starches and texture recovery hydrocolloids when they are bought for sensory outcomes.
The scope excludes commodity sweeteners, bulk salt, base proteins, whole spices sold as culinary ingredients and processing aids that do not change sensory properties in finished products.
Packaging effects, marketing claims, restaurant recipes and finished food or beverage product sales are excluded. The market is limited to additive ingredients and systems sold for sensory performance.
How Was the Analysis Built?
The analysis draws on 120+ sources, 35+ company portfolios, 25+ countries, and more than 20 industry interviews.
- Primary Research: Primary research includes discussions with ingredient suppliers, flavor houses, color producers, formulators, distributors, food manufacturers, beverage developers, feed producers and procurement teams.
- Desk Research: Desk research covers government statistics, regulatory publications, company filings, technical studies, trade data and authoritative public sources.
- Market Sizing and Forecasting: Market estimates combine historical performance, product-use patterns, segment shares, country growth, pricing signals and supplier participation.
- Data Validation and Update Cycle: Findings are validated against interviews, public data, company activity, regulatory changes and product developments.
Segmentation
What is the report’s scope and coverage?
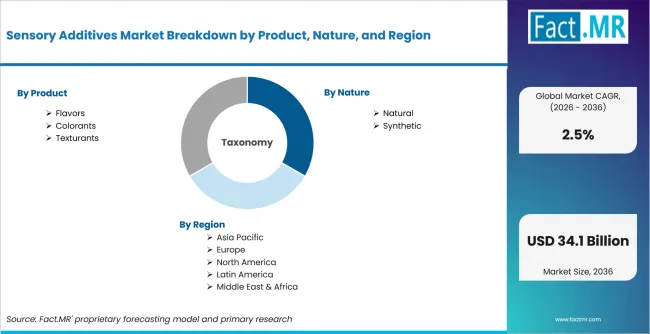
Sensory Additives Market Breakdown By Product, Nature, And Region | Source: Fact.MR
| Attribute | Details |
|---|---|
| Quantitative Units | USD billion in 2026 to USD billion by 2036 at a CAGR |
| Market Definition | Sensory additives include flavor, color and texture ingredients used to influence taste, appearance, mouthfeel, solubility and product acceptance in food, beverages and animal feed. |
| Product | Flavors; Colorants; Texturants |
| Nature | Natural; Synthetic |
| Form | Liquid; Powder; Gel; Paste |
| Solubility | Water Soluble; Fat Dispersible; Oil Soluble |
| End Use Industry | Food Industry; Beverage Industry; Animal Feed Industry |
| Regions Covered | North America; Latin America; Western Europe; Eastern Europe; East Asia; South Asia & Pacific; Middle East & Africa |
| Countries Covered | USA; South Korea; U.K.; Germany; Japan; France; Italy |
| Key Companies Profiled | Kerry Group plc; Novonesis; Sensient Technologies Corporation; Archer Daniels Midland Company; Döhler GmbH; IFF; Givaudan, including DDW and Naturex heritage; Kalsec Inc.; McCormick & Company, Inc.; Keva Flavours Pvt. Ltd.; H.E. Stringer Flavour Ltd.; Blends Ltd.; Flavour Makers; Cranbrook Flavours; Flavour Sensations; Kalex Flavours & Fragrances (Pty) Ltd.; U.K. Flavour; Synergy Taste; Phodé; Bordas |
| Forecast Period | 2026 to 2036 |
| Approach | Hybrid top-down and bottom-up approach using food and beverage production indicators, additive-use patterns, segment shares, country adoption, supplier portfolios and regulatory signals. |
Source: Fact.MR analysis. Updated Aug 20, 2026
How is the market segmented?
-
By Product
- Flavors
- Fruit Flavors
- Beverage Flavors
- Savory Flavors
- Colorants
- Natural Colorants
- Synthetic Colorants
- Texturants
- Hydrocolloids
- Starches
- Emulsifiers
- Flavors
-
By Nature
- Natural
- Plant Derived
- Microbial Derived
- Synthetic
- Artificial Flavors
- Synthetic Colorants
- Natural
-
By Form
- Liquid
- Water Based Liquid
- Oil Based Liquid
- Powder
- Spray Dried Powder
- Granulated Powder
- Gel
- Flavor Gel
- Color Gel
- Paste
- Flavor Paste
- Color Paste
- Liquid
-
By Solubility
- Water Soluble
- Flavor Ingredients
- Color Ingredients
- Fat Dispersible
- Color Systems
- Texture Ingredients
- Oil Soluble
- Flavors
- Colorants
- Water Soluble
-
By End Use Industry
- Food Industry
- Bakery And Confectionery
- Dairy Products
- Processed Foods
- Beverage Industry
- Alcoholic Beverages
- Non Alcoholic Beverages
- Animal Feed Industry
- Livestock Feed
- Pet Food
- Aquaculture Feed
- Food Industry
-
By Region
- North America
- Latin America
- Western Europe
- Eastern Europe
- East Asia
- South Asia & Pacific
- Middle East & Africa
Frequently Asked Questions
How big is the sensory additives market in 2026?
What is the CAGR of the sensory additives market from 2026 to 2036?
Which product leads the sensory additives market?
Which nature segment leads the sensory additives market?
Who are the leading companies in the sensory additives market?
Who worked on this report


Preview the report firsthand - request a free sample
Free SampleGet the brochure for pricing and purchase details
Download PDF