- Market Value (2025): USD 646.9 Mn
- Estimated Value (2026): USD 720 Mn
- Forecast Value (2036): USD 2100 Mn
- CAGR (2026-2036): 11.3%
What is the Sugar-Reduction Taste Optimization Systems Market forecast to be worth by 2036?
USD 720 million in 2026 to USD 2100 million by 2036, at an 11.3% CAGR.
- The market reached USD 646.9 million in 2025.
- Demand is projected to increase from USD 720 million in 2026 to USD 2100 million by 2036.
- The market is forecast to record an 11.3% CAGR from 2026 to 2036 and create an absolute opportunity of USD 1,380 million.
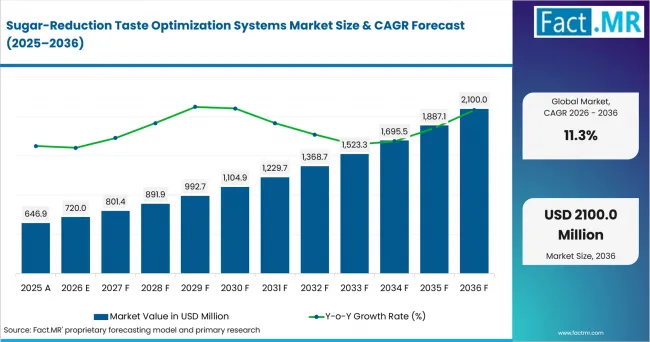
Sugar Reduction Taste Optimization Systems Market Value Analysis | Source: Fact.MR
What are the defining numbers behind Sugar-Reduction Taste Optimization Systems Market growth?
An absolute opportunity of USD 1,380 million is expected between 2026 and 2036. High-intensity sweeteners lead Solution Type with a 33.0% share in 2026, stevia/steviol glycosides lead Sweetener with 36.0%, and carbonated & still beverages lead Application with 34.0%.
- Demand Drivers in the Market
- Sugar reduction changes more than sweetness. Removing sucrose can reduce body, alter flavor release and expose bitter or lingering notes from high-intensity sweeteners. This creates demand for systems that combine sweeteners with flavor modulation and functional build-back rather than relying on a one-for-one ingredient substitution.
- Beverages are a major formulation target because sugar levels are visible to consumers and, in several markets, directly linked to fiscal or labeling rules. The United Kingdom has confirmed a lower Soft Drinks Industry Levy threshold of 4.5 g of sugar per 100 ml from 1 January 2028, giving beverage manufacturers a defined reformulation target.
- Commercial supplier portfolios are expanding around integrated approaches. DSM-Firmenich positions TasteGEM and TastePRINT for moderate and deep sugar reduction, Kerry uses Tastesense to rebuild sweetness and mouthfeel, and ADM combines sweetening systems with flavors and enabling ingredients under its Replace, Rebalance, Rebuild approach.
- The sweetener mix is also widening. Stevia remains central to high-intensity sweetening, while monk fruit and allulose give formulators additional routes to manage taste or bulk. The buying decision increasingly depends on how a system performs in the actual beverage, dairy, bakery, confectionery or sauce matrix.
- Key Segments Analyzed
- By Solution Type: High-intensity sweeteners are projected to hold 33.0% share in 2026 because they provide the primary sweetness replacement when formulators remove a meaningful portion of sucrose.
- By Sweetener: Stevia/steviol glycosides are projected to hold 36.0% share in 2026 because they offer high-potency sweetness and are supported by broad commercial formulation platforms.
- By Application: Carbonated & still beverages are projected to hold 34.0% share in 2026 because sweetness is a central sensory attribute and beverage reformulation can be driven by label targets, calorie goals and sugar levies.
- Analyst Opinion at Fact.MR
- Fact.MR opines that the category will be decided at formulation level. A sweetener that reaches the target sugar number can still fail if the product becomes thin, bitter, metallic or slow to finish. Suppliers that can solve sweetness timing, mouthfeel and off-note control within one application workflow are better positioned for repeat commercial use.
- Strategic Implications
- Flavor and sweetener suppliers should qualify solutions by application matrix because a beverage system will not transfer directly into bakery or dairy without changes in sweetness curve and functional build-back.
- Suppliers serving deep sugar-reduction programs should combine high-intensity sweeteners with taste modulation and, where required, bulking or fiber systems so the finished product retains body as well as sweetness.
- Beverage teams should model reformulation against local tax and labeling thresholds before selecting ingredients, because the economic value of each gram of sugar removed can differ by market.
- Commercial teams should sell a validated finished-product outcome rather than a sweetener specification alone. Sensory acceptance after shelf-life and processing should be part of qualification.
How does the Sugar-Reduction Taste Optimization Systems Market break down by segment?
Why do High-intensity Sweeteners lead Solution Type?
High-intensity sweeteners are projected to account for a 33.0% share in 2026.
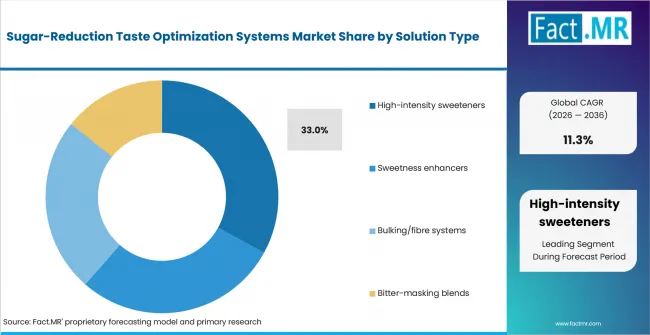
Sugar Reduction Taste Optimization Systems Market Analysis By Solution Type | Source: Fact.MR
High-intensity sweeteners lead because they replace a large amount of sucrose with a small dose, allowing formulators to reach calorie or added-sugar targets without increasing ingredient volume. The technical challenge is that potency alone does not reproduce the onset, body and finish of sugar.
That limitation creates the wider taste-optimization system around the sweetener. DSM-Firmenich markets stevia and monk fruit alongside TastePRINT solutions designed to mimic sugar sweetness while addressing off-notes. Kerry similarly positions its sweetness technologies around rebuilding sweetness perception and mouthfeel. High-intensity sweeteners therefore sit at the center of many programs even when additional modulators or bulking ingredients are required.
Why do Stevia/Steviol Glycosides lead Sweetener?
Stevia/steviol glycosides are projected to account for a 36.0% share in 2026.
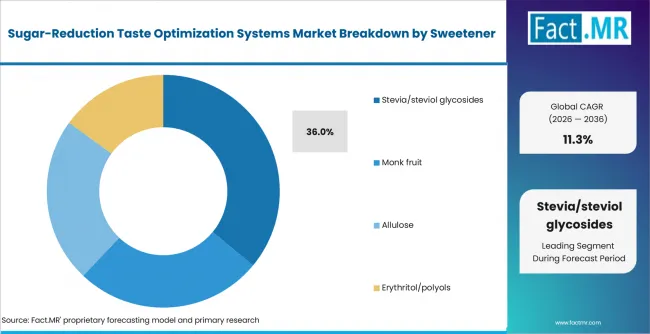
Sugar Reduction Taste Optimization Systems Market Analysis By Sweetener | Source: Fact.MR
Stevia leads because it combines high sweetness potency with a large commercial ecosystem of purified glycosides, blends and taste-modulation tools. FDA recognizes certain high-purity steviol glycosides through the GRAS framework, and major ingredient suppliers offer stevia across beverage and food applications.
The formulation constraint is aftertaste and sweetness timing at higher replacement levels. Suppliers address this with glycoside selection, blends and flavor modulators. Monk fruit provides another high-potency route, while allulose contributes lower-intensity sweetness together with bulk and browning functionality. Polyols remain relevant where texture and solids are important.
Why do Carbonated & Still Beverages lead Application?
Carbonated & still beverages are projected to account for a 34.0% share in 2026.
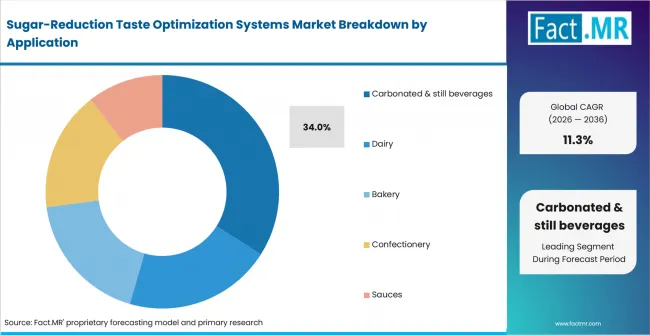
Sugar Reduction Taste Optimization Systems Market Analysis By Application | Source: Fact.MR
Beverages lead because sweetness is immediately perceptible and sugar concentration can be directly connected to label claims or levy thresholds. Liquid systems also make rapid bench adjustment possible, allowing formulators to tune sweetener dose, acidity, flavor and mouthfeel through repeated sensory trials.
The United Kingdom is tightening the Soft Drinks Industry Levy threshold from 5.0 g to 4.5 g of sugar per 100 ml from January 2028. Supplier portfolios also show strong beverage emphasis: Kerry applies sweetness modulation across soft drinks and teas, Sweegen positions sweetener systems and taste modulation for reduced-sugar beverages, and ADM markets turnkey sugar-reduction systems for beverage formulation.
What is accelerating Sugar-Reduction Taste Optimization Systems Market adoption, and what is holding it back?
Drivers Impact Analysis
| Driver | (~) % Impact on CAGR | Geographic Relevance | Impact Timeline |
|---|---|---|---|
| Reformulation to meet added-sugar and calorie targets | +1.7% | Global | Near to medium term |
| Sugar-levy thresholds in beverages | +1.4% | United Kingdom, Mexico and other levy markets | Near to medium term |
| Improved stevia, monk fruit and sweetener blending systems | +1.3% | Global | Near to medium term |
| Demand for sugar-like taste at deeper reduction levels | +1.2% | Global | Medium term |
Source: Fact.MR analysis. Updated Aug 14, 2026
Opportunity Impact Analysis
| Opportunity | (~) % Impact on CAGR | Geographic Relevance | Impact Timeline |
|---|---|---|---|
| Application-specific sweetness optimization systems | +1.0% | Global | Near to medium term |
| Allulose and other functional build-back solutions | +0.8% | United States and permitted markets | Medium term |
| Taste modulation for zero- and low-sugar beverages | +0.9% | North America and Europe | Medium term |
| Integrated sweetener, flavor and fiber systems | +0.7% | Global | Medium to long term |
Source: Fact.MR analysis. Updated Aug 14, 2026
Restraints Impact Analysis
Restraint
| (~) % Impact on CAGR | Geographic Relevance | Impact Timeline | |
|---|---|---|---|
| Aftertaste and sweetness-curve mismatch at high replacement levels | -1.0% | Global | Near term |
| Loss of bulk, texture or browning when sucrose is removed | -0.9% | Bakery, dairy and confectionery markets | Near to medium term |
| Sweetener approvals and labeling differences by country | -0.7% | Global | Near to medium term |
| Higher formulation and sensory-validation burden | -0.6% | Global | Medium term |
Source: Fact.MR analysis. Updated Aug 14, 2026
Which countries are scaling the Sugar-Reduction Taste Optimization Systems Market fastest?
- Mexico: 13.54% CAGR. Beverage taxation and front-of-pack nutrition rules keep sugar and sweetener choices commercially visible, supporting reformulation work across drinks and packaged foods.
- United States: 12.31% CAGR. A broad sweetener portfolio, FDA treatment of allulose in Nutrition Facts labeling and strong supplier formulation capability support multiple sugar-reduction routes.
- Spain: 12.02% CAGR. AESAN continues to frame product reformulation and added-sugar reduction as part of the NAOS strategy, supporting demand for technically workable lower-sugar formulations.
- United Kingdom: 11.99% CAGR. Confirmed SDIL changes lower the taxable sugar threshold to 4.5 g per 100 ml from January 2028 and remove exemptions for certain milk-based and milk-substitute drinks.
- Italy: 11.79% CAGR. Food and beverage manufacturers are applying sugar reduction across beverage, bakery and confectionery categories where sweetness must be rebuilt without losing texture or familiar flavor.
- Germany: 11.44% CAGR. The national reduction and innovation strategy has targeted lower sugar in processed foods and soft drinks, keeping formulation work tied to measurable product-composition goals.
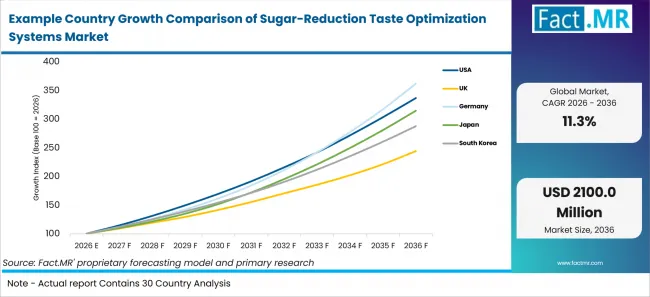
Example Country Growth Comparison Of Sugar Reduction Taste Optimization Systems Market | Source: Fact.MR
| Country | CAGR, 2026 to 2036 |
|---|---|
| Mexico | 13.54% |
| United States | 12.31% |
| Spain | 12.02% |
| United Kingdom | 11.99% |
| Italy | 11.79% |
| Germany | 11.44% |
Source: Fact.MR analysis. Updated Aug 14, 2026
What is driving Mexico’s growth through 2036?
Mexico is forecast to expand at a 13.54% CAGR from 2026 to 2036.
Mexico has used an excise framework for flavored beverages with added sweeteners, creating a continuing economic signal around beverage formulation. For manufacturers, the practical response is to reduce the taxable or declared sugar load while keeping the sweetness profile familiar enough for repeat purchase.
The market opportunity is therefore strongest where suppliers can combine high-intensity sweeteners with masking and flavor rebalance. Carbonated and still beverages are the leading application in the supplied market structure, which aligns directly with the country’s reformulation pressure.
What is driving United States’s growth through 2036?
The United States is forecast to expand at a 12.31% CAGR from 2026 to 2036.
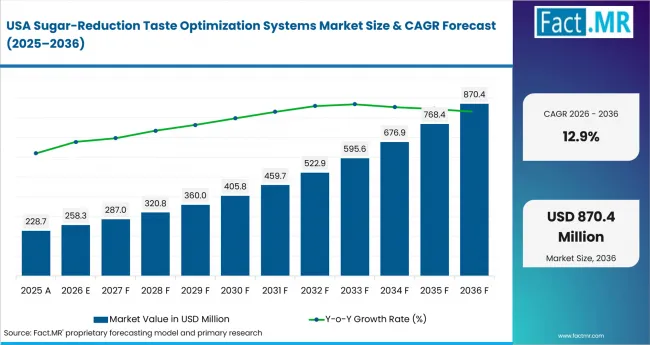
Sugar Reduction Taste Optimization Systems Market Country Value Analysis | Source: Fact.MR
The United States supports several technical routes to sugar reduction. FDA guidance permits enforcement discretion for excluding allulose from Total Sugars and Added Sugars declarations and uses 0.4 kcal/g for calorie calculation, giving allulose a distinct formulation role in products that need both sweetness and bulk.
The wider supplier base also supports stevia, monk fruit, polyols and flavor-modulation systems. This gives formulators more ways to tailor sweetness for beverages, dairy, bakery and confectionery rather than forcing every product into a single sweetener architecture.
What is driving Spain’s growth through 2036?
Spain is forecast to expand at a 12.02% CAGR from 2026 to 2036.
Spain’s AESAN reformulation program treats reduction of added sugars as part of improving the composition of foods and drinks. The policy logic favors gradual reformulation that preserves consumer acceptance, which is the same technical problem addressed by taste-optimization systems.
Suppliers serving Spain therefore need application-specific support. Beverage reformulation may depend on sweetness timing and acidity, while bakery and confectionery need a solution for solids, browning and texture after sucrose is reduced.
What is driving United Kingdom’s growth through 2036?
The United Kingdom is forecast to expand at an 11.99% CAGR from 2026 to 2036.
HM Revenue & Customs confirmed in July 2026 that the Soft Drinks Industry Levy threshold will fall from 5.0 g to 4.5 g of sugar per 100 ml from 1 January 2028. The same change will remove current exemptions for milk-based and milk-substitute drinks with added sugar under the stated rules.
This creates a defined formulation deadline. Beverage manufacturers can reformulate below the threshold, pay the levy, or adjust portfolio mix. Taste-optimization suppliers gain value when they help brands reduce sugar without pushing the finished drink outside its established sensory profile.
What is driving Italy’s growth through 2036?
Italy is forecast to expand at an 11.79% CAGR from 2026 to 2036.
Italy’s growth is tied to formulation work in categories where sugar has a structural role as well as a taste role. Bakery and confectionery are important examples because removing sucrose changes bulk, browning, moisture management and the balance of cocoa, dairy or fruit flavors.
Allulose, polyols, fibers and high-intensity sweeteners can therefore play different roles in one recipe. Suppliers with pilot application support are better placed than those selling a single sweetener without texture or flavor correction.
What is driving Germany’s growth through 2036?
Germany is forecast to expand at an 11.44% CAGR from 2026 to 2036.
Germany’s National Reduction and Innovation Strategy has addressed sugar reduction in processed foods, including soft drinks and sweetened products. The Federal Ministry has also noted that sugar affects texture, volume and sensory quality, reinforcing the need for technical reformulation rather than simple ingredient removal.
The opportunity for taste-optimization systems is therefore linked to functional replacement. Manufacturers need sweetness reduction that survives processing and preserves product identity, especially in beverages and dairy products where the sensory change is easy for consumers to detect.
Who leads the Sugar-Reduction Taste Optimization Systems Market?
DSM-Firmenich AG is positioned as a leading supplier through a sugar-reduction portfolio that combines TasteGEM flavor solutions, TastePRINT systems and high-potency sweeteners such as stevia and monk fruit. The company explicitly addresses moderate and deep sugar reduction as separate formulation challenges.
Kerry Group plc competes through Tastesense Sweetness, including flavor-modulation approaches designed to rebuild sweetness perception and mouthfeel. Archer Daniels Midland Company combines sweetening systems with flavors and enabling ingredients through its Replace, Rebalance, Rebuild formulation approach.
Ingredion Incorporated competes with stevia, low-sugar syrups and allulose, including systems intended to restore bulk and mouthfeel. Sweegen, Inc. combines sweetener systems with taste modulation for deeper sugar reduction. Tate & Lyle PLC offers stevia, monk fruit, allulose and other sweetening solutions across food and beverage applications.
Competition is shaped by application science more than sweetener potency alone. Buyers compare the sweetness curve, aftertaste, mouthfeel, processing stability and label fit of the complete system. Supplier advantage increases when one team can solve sweetness, flavor balance and functional build-back within the same development cycle.
Tate & Lyle PLC remains separately profiled in this assessment. As of August 2026, the recommended cash acquisition by Ingredion Incorporated had received shareholder approval, but the companies continued to be presented separately pending completion of the transaction.
Which companies are the key providers?
Key companies include DSM-Firmenich AG; Kerry Group plc; Archer Daniels Midland Company; Ingredion Incorporated; Sweegen, Inc.; and Tate & Lyle PLC.
- DSM-Firmenich AG
- Kerry Group plc
- Archer Daniels Midland Company
- Ingredion Incorporated
- Sweegen, Inc.
- Tate & Lyle PLC
How is the market segmented?
-
By Solution Type
- High-intensity sweeteners
- Sweetness enhancers
- Bulking/fiber systems
- Bitter-masking blends
-
By Sweetener
- Stevia/steviol glycosides
- Monk fruit
- Allulose
- Erythritol/polyols
-
By Application
- Carbonated & still beverages
- Dairy
- Bakery
- Confectionery
- Sauces
-
By Region
- North America
- Latin America
- Western Europe
- Eastern Europe
- East Asia
- South Asia and Pacific
- Middle East & Africa
Bibliography
- DSM-Firmenich AG. (2026). Sugar reduction: TasteGEM, TastePRINT, stevia and monk fruit solutions.
- Kerry Group plc. (2026). Tastesense Sweetness for sugar reduction.
- Kerry Group plc. (2026). Sweetness Optimisation: Science That Makes Sweet Taste Possible.
- Archer Daniels Midland Company. (2026). Sugar Reduction Ingredients and Formulation.
- Archer Daniels Midland Company. (2026). Sweet Insights and Replace, Rebalance, Rebuild sugar-reduction approach.
- Ingredion Incorporated. (2026). Sugar Reduction Solutions.
- Ingredion Incorporated. (2026). Allulose formulations and functional build-back.
- Sweegen, Inc. (2026). Taste Modulation and sugar-reduction solutions.
- Tate & Lyle PLC. (2026). Sweetening Solutions and allulose resources.
- U.S. Food and Drug Administration. (2025-2026). Aspartame and Other Sweeteners in Food; Nutrition Facts labeling guidance resources for allulose.
- HM Revenue & Customs. (2026). Soft Drink Industry Levy changes.
- Federal Ministry of Food and Agriculture, Germany. (2025). National Reduction and Innovation Strategy for Sugar, Fats and Salt in Processed Foods.
- Spanish Agency for Food Safety and Nutrition (AESAN). (2026 access). Reformulation and reduction of added sugars under the NAOS strategy.
- Diario Oficial de la Federación, Mexico. Excise provisions for flavored beverages containing added sweeteners.
- Tate & Lyle PLC. (2026). Recommended cash acquisition by Ingredion Incorporated: shareholder meeting results, 28 July 2026.
This Report Answers
- The report explains how sugar-reduction systems differ by solution type and sweetener architecture.
- It assesses how formulation needs change across beverages, dairy, bakery, confectionery and sauces.
- It evaluates the role of high-intensity sweeteners, sweetness enhancers, bulking or fiber systems and bitter-masking blends.
- Country analysis explains the regulatory and formulation factors shaping demand in the listed markets.
- Competitive analysis compares ingredient suppliers on sweetener breadth, taste modulation and application support.
What does the Sugar-Reduction Taste Optimization Systems Market cover?
The market covers ingredient systems used to reduce sugar while maintaining a consumer-acceptable sweetness profile and the functional characteristics that sugar contributes to foods and beverages. In-scope solutions include high-intensity sweeteners, sweetness enhancers, bulking or fiber systems and bitter-masking blends when they are sold as part of a sugar-reduction formulation approach.
The assessment follows the supplied segmentation by Solution Type, Sweetener and Application. Sweetener coverage includes stevia or steviol glycosides, monk fruit, allulose and erythritol or other polyols. Applications include carbonated and still beverages, dairy, bakery, confectionery and sauces.
What is included in the scope?
The scope includes commercial ingredients and integrated systems supplied to food and beverage manufacturers for partial or deep sugar reduction. Revenue can include sweetener systems, flavor-modulation products and functional build-back ingredients when their commercial purpose is to help a finished product reduce sugar while retaining sweetness, mouthfeel or texture.
Application support is relevant where it is embedded in the ingredient sale or formulation platform. The market covers solutions used during new-product development and reformulation of existing products across the listed applications.
What is excluded from the scope?
Commodity sugar, glucose syrup and other conventional caloric sweeteners sold without a sugar-reduction function are excluded. Finished low-sugar foods and beverages are also outside the market because the assessment measures the ingredient and formulation systems used to create them.
Standalone processing equipment, packaging, consumer diet products and regulatory consulting are excluded. General flavors are counted only when they are specifically positioned and sold to rebuild sweetness, mask sweetener off-notes or support a sugar-reduction formulation.
How Was the Analysis Built?
The analysis combines the supplied market forecast and segmentation with current public evidence on sugar-reduction formulation, sweetener portfolios and country-level reformulation pressure.
- Primary Research: Relevant respondent groups include sweetener suppliers, flavor houses, food and beverage formulators, product developers and procurement teams that qualify sugar-reduction systems for commercial recipes.
- Desk Research: The review uses official company product documentation, government sugar-reduction or labeling sources and regulatory information relevant to sweeteners and beverage reformulation.
- Market Sizing and Forecasting: The sizing framework combines the number and intensity of sugar-reduction use cases with solution penetration, application mix, sweetener architecture and country-level growth.
- Data Validation and Update Cycle: Company names and current portfolios are checked against official company sources. Market values, country CAGRs and segment shares are cross-checked against the supplied source before publication.
Segmentation
What is the report's scope and coverage?
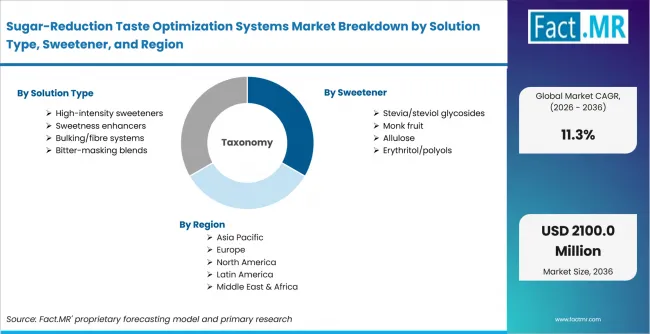
Sugar Reduction Taste Optimization Systems Market Breakdown By Solution Type, Sweetener, And Region | Source: Fact.MR
| Attribute | Details |
|---|---|
| Quantitative Units | USD Million |
| Market Definition | Sweetening, taste-modulation and functional build-back systems formulated to reduce sugar while preserving sweetness, flavor balance and product texture in food and beverage applications |
| Segments Covered | Solution Type; Sweetener; Application |
| Geographic Coverage | Global market with country analysis for the listed countries |
| Countries Covered | United States; United Kingdom; Italy; Mexico; Germany; Spain |
| Key Companies Profiled | DSM-Firmenich AG; Kerry Group plc; Archer Daniels Midland Company; Ingredion Incorporated; Sweegen, Inc.; Tate & Lyle PLC |
| Forecast Period | 2026 to 2036 |
| Approach | Bottom-up and top-down assessment using sugar-reduction formulation demand, segment shares, country growth, supplier portfolios and application-level sensory requirements |
Source: Fact.MR analysis. Updated Aug 14, 2026
Frequently Asked Questions
What is the market value in 2026?
At what CAGR is the market projected to grow?
What is the projected market value by 2036?
Which Solution Type leads the market?
Which Sweetener leads the market?
Which Application leads the market?
Which country records the highest listed CAGR?
What is the primary driver in this market?
What is the main restraint?
Which companies are included in the market assessment?
Who worked on this report


Preview the report firsthand - request a free sample
Free SampleGet the brochure for pricing and purchase details
Download PDF