- Market Value (2025): USD 8.2 Bn
- Estimated Value (2026): USD 8.6 Bn
- Forecast Value (2036): USD 13.5 Bn
- CAGR (2026-2036): 4.6%
What is the Plastic Tray Market forecast to be worth by 2036?
USD 8.6 billion in 2026 to USD 13.5 billion by 2036 at a 4.6% CAGR.
- The Plastic Tray Market was valued at USD 8.2 billion in 2025.
- Demand is projected to increase from USD 8.6 billion in 2026 to USD 13.5 billion by 2036.
- The market is forecast to record a 4.6% CAGR from 2026 to 2036 as food packers, retailers and industrial handlers specify trays for stable display and movement.
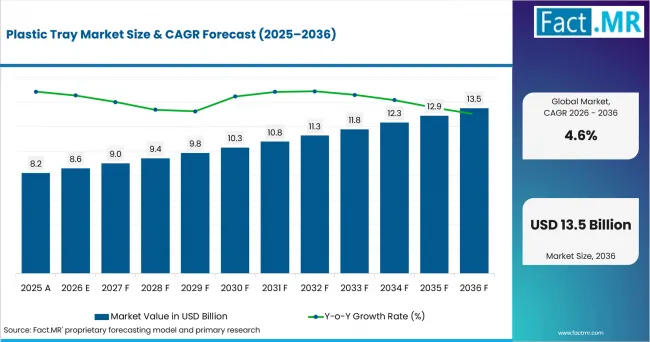
Plastic Tray Market Value Analysis | Source: Fact.MR
What are the defining numbers behind Plastic Tray Market growth?
USD 4.9 billion absolute opportunity by 2036, led by PVC, flexible trays and food and beverages packaging.
- Demand Drivers in the Market
- Fresh-food processors need trays with consistent sealing surfaces so meat, produce and bakery packs move through chilled distribution with fewer handling losses.
- The U.S. Census Bureau initially estimated June 2026 retail and food services sales at USD 768.6 billion.
- Brand teams need clear display trays that allow shoppers to inspect freshness while keeping the product surface protected inside the pack.
- Industrial handlers need formed trays with secure pockets so components remain separated during storage, transfer and customer shipment.
- Key Segments Analyzed
- By Material Type: PVC is expected to hold 65.90% share in 2026 due to clarity, sealability and long-standing use in rigid tray formats.
- By Form: Flexible trays are projected to account for 78.30% share in 2026 as thin gauge formats support food and retail packs.
- By End Use: Food and Beverages Industry is anticipated to represent 42.90% share in 2026 owing to fresh food and processed food packaging needs.
- Analyst Opinion at Fact.MR
- Shambhu Nath Jha, Principal Consultant at Fact.MR, states, "Tray packaging is being judged by line fit and proof of recovery after use. The market is expected to move steadily as converters match material choice with retailer rules. Suppliers should combine forming precision, resin know-how and recycling evidence."
- Strategic Implications
- Converters should document resin grade, gauge control and seal performance so food accounts can qualify tray changes with fewer line interruptions.
- HM Revenue & Customs updated Plastic Packaging Tax guidance in February 2026 with a rate of GBP 228.82 per tonne from 1 April 2026.
- Resin suppliers should support PVC, polypropylene and PET tray grades with migration data and recycled-content evidence for customer reviews.
- Industrial users should separate reusable handling trays from consumer-facing packs when measuring cost, return logistics and compliance duties.
Germany is projected to record 5.0% CAGR through 2036 supported by packaging recovery rules. Brazil is expected to post 4.6% CAGR as retail channels expand under reverse-logistics rules. The USA is anticipated to advance at 4.2% CAGR through domestic plastics capacity. The U.K. is estimated to hold 3.7% CAGR as plastic packaging tax rules push recycled-content review. Japan is forecast to reach 3.3% CAGR as convenience retail and collection systems shape material choice.
How does the Plastic Tray Market break down by segment?
PVC leads Material Type at 65.90% share; Flexible leads Form at 78.30% share.
Which Material Type dominates?
PVC is expected to hold 65.9% share in 2026.
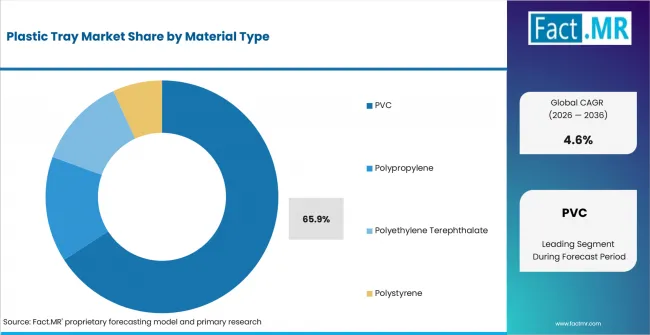
Plastic Tray Market Analysis By Material Type | Source: Fact.MR
PVC leads because it gives tray converters a familiar balance of clarity, stiffness and forming control. Rigid PVC and modified PVC help packers protect fresh food and retail products after sealing.
Polypropylene, PET and polystyrene remain relevant where heat tolerance, recycled content or shelf presentation changes the package brief. PET receives more attention in food-contact packs where recycled-content targets guide material review.
What leads the Form segment?
Flexible trays are projected to account for 78.3% share in 2026.
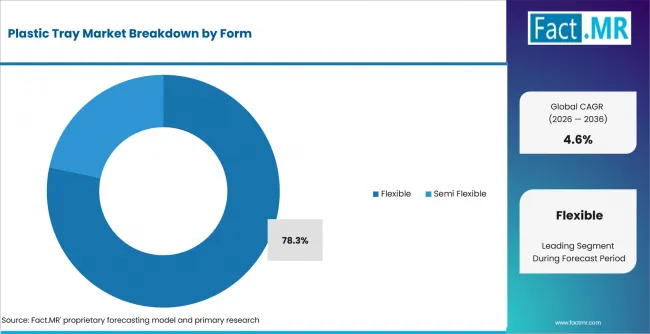
Plastic Tray Market Analysis By Form | Source: Fact.MR
Flexible trays lead because many food and retail packs need thin gauge construction with basic product protection. Thin gauge trays and bendable trays reduce material use and fit chilled display cases where pack weight affects cost.
Semi-flexible trays serve medium gauge and protective applications where the package absorbs more handling stress. Component handling trays and logistics trays gain value when parts move through bins or automated storage.
How does End Use shape demand?
Food And Beverages Industry is anticipated to represent 42.9% share in 2026.
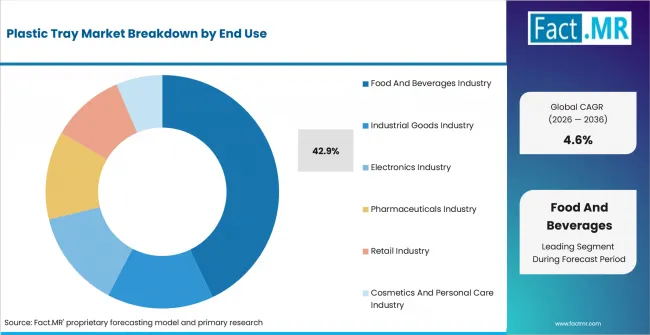
Plastic Tray Market Analysis By End Use | Source: Fact.MR
Food And Beverages Industry leads because trays are used across fresh food packaging and processed food packaging. Meat, produce, bakery and ready-meal formats require consistent sealing surfaces and visible product presentation.
Industrial goods, electronics, pharmaceuticals, retail, cosmetics and personal care add demand through product separation and point-of-sale display. Qualification cycles depend on part geometry, food-contact status and packaging-line fit.
What is accelerating Plastic Tray Market adoption, and what is holding it back?
Demand is expected to rise through food packaging, retail display needs and industrial handling. Growth is constrained by resin cost, plastic packaging rules and recyclability requirements.
Drivers Impact Analysis
| DRIVER | (~) % IMPACT ON CAGR | GEOGRAPHIC RELEVANCE | IMPACT TIMELINE |
|---|---|---|---|
| Fresh and processed food tray use | +0.9% | Global | Short term (<= 2 years) |
| Retail display and portion packaging | +0.7% | North America, Europe, East Asia | Medium term (2-4 years) |
| Industrial component handling | +0.5% | Europe, North America, Japan | Medium term (2-4 years) |
| Recycled-content tray redesign | +0.4% | U.K., EU, Japan | Long term (>= 4 years) |
Source: Fact.MR analysis. Updated Aug 31, 2026
- Fresh and processed food tray use: Tray demand is tied to products that need portion control, stackability and sealing during chilled distribution.
- Retail display and portion packaging: Clear trays help retailers present food, cosmetics and consumer goods while limiting direct product handling.
- Industrial component handling: Formed trays keep parts separated during movement, which reduces scuffing and lowers sorting work at assembly points.
Opportunity Impact Analysis
| OPPORTUNITY | (~) % IMPACT ON CAGR | GEOGRAPHIC RELEVANCE | IMPACT TIMELINE |
|---|---|---|---|
| Mono-material and recyclable tray redesign | +0.6% | Europe, Japan, North America | Medium term (2-4 years) |
| Ready-meal and fresh-food formats | +0.5% | Global | Short term (<= 2 years) |
| Reusable industrial handling trays | +0.3% | Germany, USA, Japan | Long term (>= 4 years) |
Source: Fact.MR analysis. Updated Aug 31, 2026
- Mono-material and recyclable tray redesign: Converters can win reformulation work when tray structures meet retailer recyclability checks and local recovery rules.
- Ready-meal and fresh-food formats: Food packers can use tray shape and lid compatibility to improve shelf display with the same product recipe.
- Reusable industrial handling trays: Component manufacturers can reduce packaging waste when formed trays cycle between production sites and suppliers.
Restraints Impact Analysis
| RESTRAINT | (~) % IMPACT ON CAGR | GEOGRAPHIC RELEVANCE | IMPACT TIMELINE |
|---|---|---|---|
| Plastic packaging tax and recycled-content rules | -0.5% | U.K., EU, Japan | Short term (<= 2 years) |
| Resin and packaging price pressure | -0.4% | North America, Europe | Medium term (2-4 years) |
| Qualification delays for food-contact materials | -0.3% | Global | Medium term (2-4 years) |
Source: Fact.MR analysis. Updated Aug 31, 2026
- Plastic packaging tax and recycled-content rules: Regulations add recordkeeping, material-selection and redesign work when trays need to meet recycled-content or recyclability requirements.
- Resin and packaging price pressure: Resin and packaging cost changes can increase pressure on tray manufacturers and packers, strengthening the need for gauge optimization, material efficiency and cost control.
- Qualification delays for food-contact materials: Food-contact trays require internal, customer and regulatory checks before packers change resin, structure or gauge, extending conversion and approval timelines.
Which countries are scaling the Plastic Tray Market through 2036?
- The country comparison spans 1.7 percentage points between Germany and Japan across the forecast period.
- Germany remains 0.4 percentage point above Brazil due to packaging recovery rules and fresh-food tray requirements.
- Brazil remains 0.4 percentage point above the USA as retail channels and plastic converting demand support tray use.
- The USA remains 0.5 percentage point above the U.K. with a broad plastics manufacturing base and large retail channel.
- The U.K. remains 0.4 percentage point above Japan as plastic packaging tax rules press tray redesign toward recycled content.
- Japan closes the displayed range as convenience retail and container collection systems shape material choice.
Comparable CAGRs create different entry conditions due to recycling systems, retailer packaging rules, food-contact standards and converter capacity. Full report coverage includes North America, Latin America, Western Europe, Eastern Europe, East Asia, South Asia & Pacific, Middle East & Africa.
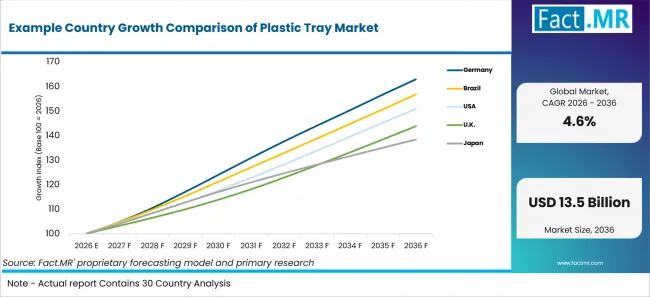
Example Country Growth Comparison Of Plastic Tray Market | Source: Fact.MR
| Country | CAGR (2026-2036) |
|---|---|
| Germany | 5.0% |
| Brazil | 4.6% |
| USA | 4.2% |
| U.K. | 3.7% |
| Japan | 3.3% |
Source: Fact.MR analysis. Updated Aug 31, 2026
What supports Germany adoption?
5.0% CAGR, supported by packaging recovery systems and fresh-food tray requirements.
German packaging policy makes tray recyclability an early design test for food and retail packs. Germany is forecast to record 5.0% CAGR through 2036. UBA and ZSVR reported in January 2026 that roughly 5.5 million tonnes of packaging waste collected by Germany’s dual systems were recovered in 2024. For tray converters, the figures reinforce the importance of demonstrating recyclability under Germany’s packaging-design and recovery requirements.
How is Brazil scaling demand?
4.6% CAGR, shaped by retail food channels and reverse-logistics requirements.
Brazilian supermarkets and processors are expected to use trays where product visibility and moisture control affect shopper acceptance. Brazil is anticipated to post 4.6% CAGR through 2036. IBGE reported in February 2026 that Brazil’s retail sales volume increased 1.6% in 2025. At the same time, Brazil’s plastic-packaging reverse-logistics framework requires relevant manufacturers and other obligated parties to maintain information and demonstrate compliance with recovery obligations.
What supports USA adoption?
4.2% CAGR, supported by retail scale and domestic plastics manufacturing.
The USA has a broad plastics workforce that supports local tray forming and customer trials. The USA is projected to advance at 4.2% CAGR through 2036. BLS reported in August 2026 that U.S. plastics and rubber products manufacturing employed 686.9 thousand people in July 2026, indicating the scale of the domestic manufacturing workforce supporting plastics-processing activities.
What supports the U.K. market?
3.7% CAGR, backed by food manufacturing depth and plastic packaging tax redesign.
U.K. tray demand is expected to track food manufacturing and retailer packaging rules. The U.K. is estimated to hold 3.7% CAGR through 2036. ONS reported in July 2026 that UK manufacturers’ product sales totaled GBP 452.0 billion in 2025, with food manufacturing accounting for 22.9% of the total, indicating the scale of manufacturing activity relevant to food-packaging applications.
How does Japan perform?
3.3% CAGR, led by convenience retail, collection systems and food-contact controls.
Japan's convenience retail base keeps tray presentation and hygiene controls central to pack selection. Japan is forecast to reach 3.3% CAGR through 2036. Japan’s Ministry of the Environment reported in March 2026 that municipalities separately collected 767,595 tonnes of plastic containers and packaging in FY2024. For food-contact tray suppliers, Japan’s positive-list framework also reinforces the importance of documented material compliance for synthetic-resin packaging.
Who leads the Plastic Tray Market?
Huhtamaki, Winpak Ltd., EasyPak, VisiPak, Lacerta Group, Landmark Plastic Corporation, D&V Plastics, Placon compete across formed plastic trays and adjacent rigid packaging. Competition centers on food-contact reliability, gauge control, material choice and customer-specific tray geometry.
Lacerta Group reported in August 2025 that its ReCERTA™ P10, P25 and P30 products received third-party verification against ISO 14021 requirements for PCR-content claims. Placon launched its Fresh ‘n Clear® Dip Cup line in March 2025 using EcoStar® material containing a minimum of 10% recycled PET.
Which companies are the key providers?
Key companies include Huhtamaki, Winpak Ltd., EasyPak, VisiPak, Lacerta Group, Landmark Plastic Corporation, D&V Plastics, and Placon.
- Huhtamaki
- Winpak Ltd.
- EasyPak
- VisiPak
- Lacerta Group, Inc.
- Landmark Plastic Corporation
- D&V Plastics
- Placon
Bibliography
- U.S. Census Bureau. (2026, July 16). Advance monthly sales for retail and food services (CB26-113).
- U.S. Bureau of Labor Statistics. (2026, August 7). Table B-1. Employees on nonfarm payrolls by industry sector and selected industry detail.
- U.S. Bureau of Labor Statistics. (2026, July 15). Producer price indexes-June 2026.
- HM Revenue & Customs. (2026, February 12). Plastic Packaging Tax: Steps to take.
- Umweltbundesamt & Zentrale Stelle Verpackungsregister. (2026, January 27). Facts against myths: Packaging waste recycling in Germany is working.
- Instituto Brasileiro de Geografia e Estatística. (2026, February 13). Retail sales close 2025 with rise of 1.6%.
- Office for National Statistics. (2026, July 24). UK manufacturers' sales by product: 2025.
- Lacerta Group, LLC. (2025, May 29). Lacerta launches new Seal N’ Flip™ packaging.
- Lacerta Group, LLC. (2025, August 26). Lacerta’s ReCERTA™ products achieve globally recognized PCR certification.
- Placon. (2025, March 31). Placon launches new dip cup container line.
This Report Answers
- The report explains where plastic trays are used across material type, form and end use. It covers regional and country growth patterns. The coverage separates consumer-facing trays from industrial handling formats so pack requirements remain clear across applications.
- Segment analysis identifies the leading subsegments and the operational reasons converters and packers prioritize them. It explains how PVC, flexible formats and food trays carry different value drivers for forming lines and shelf display.
- Country analysis examines the listed markets and the recycling, retail and manufacturing mechanisms shaping tray adoption. It links each country to one practical route for tray qualification so the country comparison stays close to real pack decisions.
- Competitive analysis reviews current providers across food trays, protective trays, retail display formats and rigid packaging portfolios.
- Application analysis assesses how sealing, stiffness, clarity, handling protection and food-contact compliance influence purchase decisions. It separates display needs from transport protection so end-use comparisons stay specific to tray performance.
What does the Plastic Tray Market cover?
The Plastic Tray Market covers thermoformed and molded trays used to hold, protect and display packaged goods. Its scope aligns coverage of plastic trays and thermoform packaging where sheet forming, gauge control and product presentation define use cases.
The assessment includes tray structures for fresh products, processed meals, components and small packaged items. It connects with fresh food packaging and ready meal trays where pack shape affects shelf presentation and handling.
What is included in the scope?
The scope includes PVC, polypropylene, PET and polystyrene trays supplied in flexible and semi-flexible formats. Manufacturing overlap is visible in thermoformed plastic products and thin gauge thermoforming where forming methods support trays, lids and protective packs.
The scope also includes tray use in display packaging and component protection. Adjacent categories include rigid plastic packaging, foodservice packaging and design-for-recycling packaging where recyclability and channel requirements influence tray selection.
What is excluded from the scope?
The scope excludes bulk resin sales before conversion into trays.
It also excludes paperboard cartons, molded fiber-only trays, corrugated shippers and generic films. Related categories include blister visibility packaging when the product format differs from a standalone plastic tray.
How Was the Analysis Built?
The analysis draws on 120+ sources, 35+ company portfolios, 25+ countries, and more than 20 industry interviews.
- Primary Research: Primary research includes discussions with manufacturers, service providers, technology developers, distributors, end users, and subject-matter experts. These conversations examine purchasing priorities, product adoption, operational challenges, approval requirements, competitive positioning, and the factors that influence wider market acceptance.
- Desk Research: Desk research covers government statistics, regulatory publications, company filings, trade data, technical studies, industry associations, standards, public policy, and other authoritative sources. Every source used in the analysis is documented in the bibliography.
- Market Sizing and Forecasting: Market estimates combine historical performance, demand indicators, pricing and volume trends, segment shares, company participation, country-level growth, adoption patterns, investment activity, and barriers to market expansion.
- Data Validation and Update Cycle: Findings are validated by comparing primary interviews with public data, company activity, regulatory changes, trade patterns, and industry developments. Regular updates review new product launches, capacity changes, partnerships, approvals, and shifts in commercial adoption.
Segmentation
What is the report's scope and coverage?
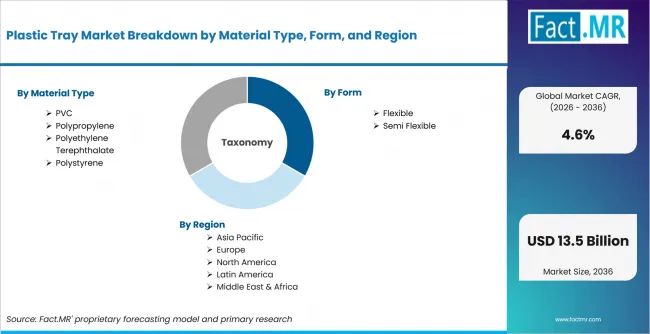
Plastic Tray Market Breakdown By Material Type, Form, And Region | Source: Fact.MR
| Attribute | Details |
|---|---|
| Quantitative Units | USD billion |
| Market Definition | Plastic trays used for food, beverages, industrial goods, electronics, pharmaceuticals, retail, cosmetics and personal care packaging, including PVC, polypropylene, PET and polystyrene formats. |
| Material Type | PVC; Polypropylene; Polyethylene Terephthalate; Polystyrene |
| Form | Flexible; Semi Flexible |
| End Use | Food And Beverages Industry; Industrial Goods Industry; Electronics Industry; Pharmaceuticals Industry; Retail Industry; Cosmetics And Personal Care Industry |
| Regions Covered | North America; Latin America; Western Europe; Eastern Europe; East Asia; South Asia & Pacific; Middle East & Africa |
| Countries Covered | Germany; Brazil; United States; United Kingdom; Japan |
| Key Companies Profiled | Huhtamaki; Winpak Ltd.; EasyPak; VisiPak; Lacerta Group, Inc.; Landmark Plastic Corporation; D&V Plastics; Placon |
| Forecast Period | 2026 to 2036 |
| Approach | Hybrid top-down and bottom-up approach using tray material mix, form usage, end-use demand, country growth and provider portfolio review. |
Source: Fact.MR analysis. Updated Aug 31, 2026
How is the market segmented?
-
By Material Type
- PVC
- Rigid PVC
- Modified PVC
- Polypropylene
- Homopolymer Polypropylene
- Copolymer Polypropylene
- Polyethylene Terephthalate
- Virgin Polyethylene Terephthalate
- Recycled Polyethylene Terephthalate
- Polystyrene
- General Purpose Polystyrene
- High Impact Polystyrene
- PVC
-
By Form
- Flexible
- Thin Gauge Trays
- Bendable Trays
- Semi Flexible
- Medium Gauge Trays
- Protective Trays
- Flexible
-
By End Use
- Food And Beverages Industry
- Fresh Food Packaging
- Processed Food Packaging
- Industrial Goods Industry
- Component Handling
- Logistics And Storage
- Electronics Industry
- Consumer Electronics
- Semiconductor Packaging
- Pharmaceuticals Industry
- Medical Device Packaging
- Drug Packaging
- Retail Industry
- Point Of Sale Packaging
- Consumer Goods Packaging
- Cosmetics And Personal Care Industry
- Cosmetic Product Packaging
- Personal Care Packaging
- Food And Beverages Industry
-
By Region
- North America
- Latin America
- Western Europe
- Eastern Europe
- East Asia
- South Asia & Pacific
- Middle East & Africa
Frequently Asked Questions
How big is the plastic tray market in 2026?
What is the CAGR of the plastic tray market from 2026 to 2036?
Which material type leads the plastic tray market?
Which form leads the plastic tray market?
Who are the leading companies in the plastic tray market?
Who worked on this report


Preview the report firsthand - request a free sample
Free SampleGet the brochure for pricing and purchase details
Download PDF