
Aluminum Trays Market Outlook from 2025 to 2035
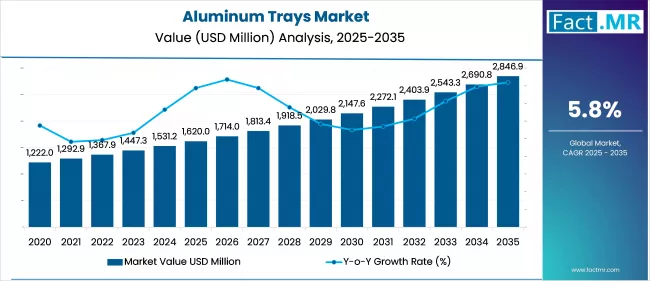
The global aluminum trays market is expected to reach USD 2,847 million by 2035, up from USD 1,542 million in 2024. During the forecast period from 2025 to 2035, the industry is projected to register a CAGR of 5.8%, driven by the transition toward sustainable, heat-resistant packaging and the implementation of bans on single-use plastics.
The market growth is supported by innovations in recyclable tray designs, expanding applications in airline catering and convenience foods, as well as increasing investments in circular economy solutions.
What are the drivers of Aluminum Trays Market?
The main drivers of the aluminum trays market include demand for convenient, sustainable, and heat-resistant food packaging. This demand reflects the preference among consumers and businesses for aluminum trays that offer effective heat conductivity and recyclability, aligning with current global practices focused on environmentally responsible products. This is evident in prepared foods such as ready-to-eat meals, frozen supplements, and catering services, where aluminum trays are extensively used.
The presence of aluminum trays in the market provides a competitive advantage, as they are tamper-proof, microwavable, and oven-friendly, unlike plastic containers. The trays are also helping manufacturers to meet high demands from airline catering, retail food chains, and food processors, since they are long-lasting and offer strong presentation.
Regulations against single-use plastics in various areas are driving the business sector toward aluminum. The growing relevance of the circular economy is expected to support the growth of the aluminum trays industry, with significant investments being made in closed-loop recycling and the development of lightweight trays.
What are the regional trends of Aluminum Trays Market?
North America leads the aluminum tray market, supported by the growing consumption of convenience foods and the excellent infrastructure for aluminum recycling. The USA, in particular, is witnessing growth, with a substantial base in the foodservice industry and increasing demand from frozen food producers.
Europe follows, with its growth influenced by stringent environmental laws that promote the use of green packaging. Countries such as Germany and the UK are actively replacing plastic trays with aluminum ones, especially in the retailing and institutional catering industries.
East Asia, led by China and Japan, is expanding steadily, with a growing urban population and the influence of Western food culture. Increasingly flexible lifestyles are creating demand for takeaway packaging and ready meals.
The increasing demand among homes, as well as in the HoReCa (hotel, restaurant, and cafe) segment, is observed in South Asia & Oceania, primarily in India and Australia. Market growth is developing in Latin America, the Middle East and Africa, where the infrastructure challenges are being resolved over time with increased demand in export-based food packaging.
What are the challenges and restraining factors of Aluminum Trays Market?
The aluminum trays market faces several challenges despite its positive growth outlook. A volatile price and availability of aluminum are one of the main constraints, as they are affected by global mining activity, energy prices, and geopolitical conditions. Such volatilities have an impact on manufacturing expenses and profit margins.
Adoption is also hindered by environmental issues associated with the extraction and refinement of aluminum, which require significant energy input —a concern particularly relevant in low-carbon manufacturing regions. They are recyclable, although not every aluminum tray undergoes the proper recycling processes to have a positive impact on the environment.
Competition from the existence of biodegradable packaging materials, such as molded fiber and compostable materials, poses a challenge, especially in regions with active green packaging policies. These substitutes are appealing to environmentally conscious consumers and retailers.
Certain variants of aluminum trays with specific coatings are incompatible with microwave use, which may limit their application in certain areas. Stringent food safety policies concerning materials that come into contact with food products require ongoing investments by manufacturers to stay compliant, which affects their profitability.
Country-Wise Outlook
Eco-Legislation and takeout culture drive aluminum trays demand in the United States
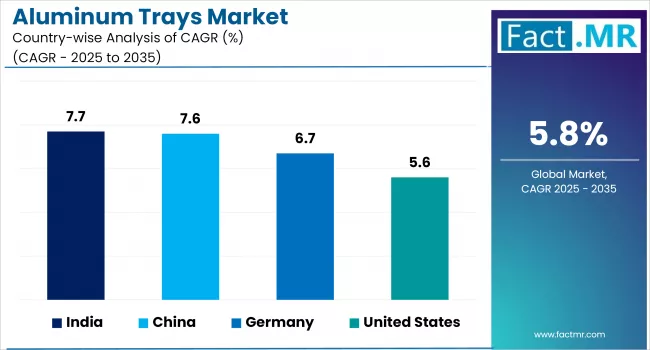
The USA market of aluminum trays holds a firm position, with demand shaped by the foodservice industry, takeout culture and environment-friendly packaging requirements over states such as California and New York. As polystyrene and increasing single-use plastics are getting banned, aluminum trays are being favored due to their recycling potential as well as heat conductivity.
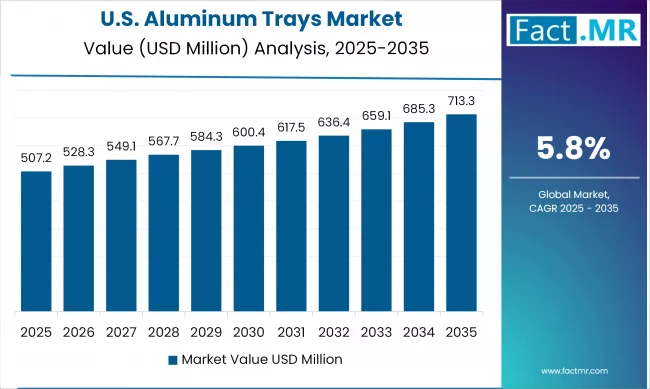
Manufacturers are also incorporating closed-loop resourcing and lightweighting technology to meet their performance and ESG targets. Laser-etched branding and smart labeling are being adopted as methods to appeal to premium foodservice providers. The development of the oven-safe, two-compartment tray is driven by the growing demand for meal kits and prepared food.
Germany advances aluminum trays innovation through green compliance and food export strength
The European leader in the aluminum trays market is Germany, where food packaging laws are highly regulated, infrastructure is well developed, and exports in the food and bakery sectors are notable. The Verpackungsgesetz (Packaging Act) in the country encourages manufacturers to shift towards mono-material packaging, such as aluminum trays, which are easy to sort and recycle.
German converters are focusing on formable trays that can resist freezing and baking temperatures, supporting the frozen meals and ready-to-eat segments. The automotive stamp quality and close cutting edges seal service allow the country to drive to nearby and pan-European retail chains.
India’s catering boom and plastic ban accelerate shift to aluminum trays
India is emerging as a trendsetter in the aluminum trays sector, driven by the expanding food catering industry, growing middle-class disposable income, and a shift away from plastic and styrofoam in urban areas. Efforts by the government, such as the plastic ban, have acted as a catalyst to the transition to the use of aluminum trays that are cheap and easy to use in weddings, events, and street food services.
Cost-effective extrusion and roll-fed forming lines are being adopted in the domestic manufacturing ecosystem, led by clusters in Maharashtra and Gujarat. The local manufacturers are starting to provide compartmentalized trays intended to be used in institutions (airlines, railways) accompanied by heat-sealable trays gaining traction in the QSR and cloud kitchen segments.
Category-Wise Analysis
Rigid compartmental trays power portioned convenience in airline and rail catering
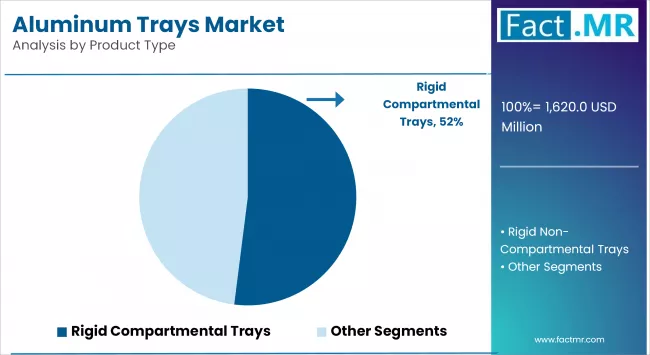
Stringent compartmental trays have become central to portion-controlled packages in the aluminum trays market, especially in transportation catering services. Their design ensures the safe separation of food items and is fundamental in airline and railway catering, where consistency, hygiene, and presentation are essential, even in mobile settings. These trays are durable and insulated, making them suitable for serving pre-packed hot meals on board.
250-500 Gram Trays Hit the Sweet Spot for In-Transit Meal Packaging
The aluminum trays, which range in weight from 250 to 500 grams, have become popular due to their convenient portioning of single-serving meals. This size enables the practical implementation of efficiency, reducing food waste to a minimum while meeting nutritional and cost objectives.
Their popularity in mass use in transportation, especially in the aviation industry, rail, and long-distance bus lines aligns with the changing demand for lightweight, washable, and recyclable packaging materials that maintain thermal performance or food quality during reheating and storage.
Transportation catering drives specialized demand for heat-stable, eco-conscious packaging
The aluminum tray segment is also influenced by transportation catering services, which have a requirement for heavy-duty, reheatable, and space-efficient packaging. High safety standards of the airline industry and trains require both regulatory and functional trays.
As sustainability requirements are getting stringent worldwide in any mode of transportation, the need for aluminum trays that are recyclable and have low weight is also increasing tremendously, particularly in high-volume geographies such as Europe and Asia-Pacific.
Competitive Analysis
Aluminum trays industry is moderately fragmented, with numerous companies competing at both regional and global levels. Market players distinguish themselves in terms of production capacity, innovativeness in the design of trays, sustainability credentials and efficiency in distribution.
The demand for a circular economy has prompted multiple companies to incorporate recycled materials and invest in closed-loop recycling schemes, thereby appealing to environmentally conscious consumers. These companies are developing their product portfolio with differentiated products to serve the food packaging, catering, airline services, and home consumption markets.
Heat-resistant paint, compartmentalized trays, and a better seal on ready meals have contributed to the appeal and versatility of the products. Cost competitiveness is also a crucial aspect, as the lower production costs in emerging economies allow manufacturers in those regions to access price-sensitive segments of the market.
Market positioning is further enhanced through strategic alliances with the food processors, supermarkets and airline caterers. Compliance with food safety regulations and certification standards serves as a key entry barrier, intensifying competition among players aiming to meet quality requirements while maintaining cost efficiency and sustainable practices.
Key players in the aluminum trays industry are ENVASES DEL PLATA S.A., Formacia, Durable Packaging International, Nicholl Food Packaging Ltd, Artekno, Roihu Inc., Wyda Packaging (Pty) LTD., Alufoil Products Pvt. Ltd, Confoil, Contital Srl, Penny Plate, LLC, i2r Packaging Solutions Limited, Foshan Mesteak Packaging Co., Ltd, QuickPack, Alupet B.V., Cogeapack, and other players.
Recent Development
- In February 2025, i2r Packaging Solutions launched six new recyclable aluminum trays designed for ready-to-cook meals. These trays aim to replace single-use plastics, enhancing visual appeal and functionality for food manufacturers and retailers.
- In April 2025, the USA Department of Commerce announced final determinations that imports of disposable aluminum containers, pans, trays, and lids from China are being sold at less than fair value and are subsidized by the Chinese government. Consequently, countervailing and antidumping duties have been imposed on these imports.
Fact.MR has provided detailed information about the price points of key manufacturers in the Aluminum trays market, positioned across regions, as well as sales growth, production capacity, and speculative technological expansion, in its recently published report.
Methodology and Industry Tracking Approach
In 2025, Fact.MR conducted the first in-depth study of the changes in the aluminum tray market, involving 3,800 new and emerging stakeholders in 18 countries worldwide. This survey was completed by October 2020, and the latest respondents included a minimum of 90 industry specialists from various countries, comprising food packaging specialists, sustainability advisors, and product design experts. The most important areas of focus were high-barrier aluminum pans with long shelf lives, recyclable multilayer packaging, and automated foodservice tray designs.
The new trends from June 2024 to May 2025 centered on the emergence of oven- and air fryer-ready aluminum trays, as well as the use of smart labels and renewable energy to power production. It is worth noting that North America and Western Europe are leading the way in the use of post-consumer, reused aluminum, whereas East Asia is pioneering digital printing and tracking food packaging.
Fact.MR has been monitoring trends in heat-seal coating technology, formable aluminum foils, and anti-leak edge designs since 2018. Recently, some innovations have cut in, such as antimicrobial inner linings, smart compartment trays, and foldable aluminum forms. This gradual transition to circularity, and more specifically, the use of sustainable materials governed by regulations, continues to transform the expectations for aluminum trays in future institutional and retail environments.
Segmentation of Aluminum Trays Market
-
By Product :
- Rigid Compartmental Trays
- Rigid Non-Compartmental Trays
-
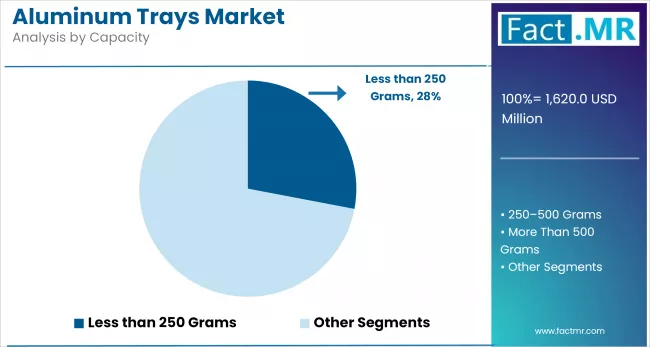
By Capacity :
- Less than 250 Grams
- 250-500 Grams
- More Than 500 Grams
-
By End Use :
- QSR & FSR
- Transportation Catering Services
- Institutional; Catering Services
- Retail Sales
- Bakery & Confectionery Packaging
- Other End Use
-
By Region :
- North America
- Latin America
- Western Europe
- Eastern Europe
- East Asia
- South Asia & Pacific
- Middle East & Africa
- Frequently Asked Questions -
What was the global Aluminum trays market size reported by Fact.MR for 2025?
The global aluminum trays market was valued at USD 1,620 Million in 2025.
Who are the major players operating in the aluminum trays market?
Prominent players in the market are ENVASES DEL PLATA S.A., Formacia, Durable Packaging International, Nicholl Food Packaging Ltd, Artekno, among others.
What is the Estimated Valuation of the aluminum trays market in 2035?
The market is expected to reach a valuation of USD 2,847 Million in 2035.
What value CAGR did the Aluminum trays market exhibit over the last five years?
The historic growth rate of the aluminum trays market was 4.8% from 2020 to 2024.

Author:
Ayush Raj

Editor:
Anushree Karale