Railcar Spill Containment Market
Railcar Spill Containment Market Analysis, By Product, By Material, By End-Use Industry, and Region - Market Insights 2025 to 2035
Analysis of Railcar Spill Containment Market Covering 30+ Countries Including Analysis of US, Canada, UK, Germany, France, Nordics, GCC countries, Japan, Korea and many more
Railcar Spill Containment Market Outlook (2025 to 2035)
The global railcar spill containment market is projected to increase from USD 26.3 billion in 2025 to USD 42.8 billion by 2035, with a CAGR of 5.0%, driven by stringent environmental regulations to ensure compliance and prevent costly penalties. The increasing transport of hazardous materials via rail is driving the need for effective spill containment solutions to mitigate environmental and safety risks.
What are the Drivers of Railcar Spill Containment Market?
The railcar spill containment market is experiencing robust growth, primarily due to the increasing stringency of environmental and safety regulations worldwide. Regulatory bodies such as the U.S. Environmental Protection Agency (EPA), Transport Canada, and European environmental authorities have enforced strict rules for the handling and transport of hazardous materials by rail.
These regulations require the use of spill containment systems at railcar loading and unloading stations to prevent soil and water contamination. As environmental compliance becomes a top priority for industries, investments in spill containment infrastructure are surging to avoid legal penalties and environmental liabilities.
Another key driver is the growing volume of hazardous materials transported via rail, including crude oil, chemicals, fertilizers, and industrial solvents. Rail transport is widely used for its cost efficiency and ability to handle bulk loads over long distances, particularly in the energy, chemical, and manufacturing sectors.
However, this increased reliance on rail logistics also amplifies the risk of spills and leaks. As a result, there is a rising demand for effective and durable spill containment systems to mitigate these risks and ensure operational safety during transit, loading, and unloading processes.
Technological advancements are also accelerating railcar spill containment market growth. Modern containment systems are being designed with advanced materials, such as corrosion-resistant polymers and high-strength composites, which offer improved durability and environmental performance.
The market is being bolstered by corporate sustainability initiatives and ESG commitments, especially among large logistics and chemical companies. As organizations strive to reduce their environmental footprint and align with global sustainability goals, spill containment solutions are viewed as essential infrastructure.
Furthermore, developing nations are rapidly expanding their rail infrastructure to support industrialization, and new terminals require containment systems that are compliant with regulations. Together, these factors are shaping a favorable environment for the continued expansion of the railcar spill containment market in both developed and emerging economies.
What are the Regional Trends of Railcar Spill Containment Market?
The U.S. and Canada hold the dominant share in the global market due to their well-established rail transport network, high volumes of hazardous materials shipment, and strict environmental compliance standards. Regulatory frameworks, such as the U.S. EPA’s Spill Prevention, Control, and Countermeasure (SPCC) rule and Transport Canada's safety standards, drive the mandatory adoption of containment systems.
Moreover, frequent investments in upgrading oil and chemical rail terminals further support the demand for advanced containment technologies in the region.
In Europe, the market is driven by the European Union’s strong environmental regulations and commitment to sustainability. Countries like Germany, the Netherlands, and France are leading adopters of eco-friendly spill containment systems.
The emphasis on reducing soil and groundwater pollution, coupled with growing concerns about the safety of transporting hazardous chemicals and fuels by rail, is encouraging the use of compliant spill control infrastructure. Moreover, Europe's focus on digitization is promoting the adoption of smart containment systems with remote monitoring capabilities.
The Asia Pacific is emerging as the fastest-growing regional market, driven by rapid industrialization, increased cross-border trade, and the expansion of rail infrastructure in countries such as China, India, Indonesia, and Vietnam. Governments in this region are investing heavily in rail freight networks and logistics hubs, particularly to support the chemical, petrochemical, and energy sectors.
As regulatory frameworks become more aligned with global environmental standards, industries are increasingly adopting spill containment systems to meet compliance requirements and attract foreign investment.
In the Middle East & Africa (MEA), market growth is moderate but gaining momentum due to increasing awareness about environmental protection and the modernization of transportation infrastructure.
In the Middle East, countries such as Saudi Arabia and the UAE are enhancing their industrial and logistics capacities, creating new opportunities for spill containment solutions, particularly in oil and gas transportation by rail. However, the market here is still in its early stages of development compared to other regions.
What are the Challenges and Restraining Factors of Railcar Spill Containment Market?
One of the primary restraints is the high initial cost of installing and maintaining advanced spill containment systems. These systems often require durable materials, site-specific engineering, and specialized installation, all of which can be costly, especially for small and mid-sized operators.
Moreover, smart containment technologies that incorporate sensors and monitoring systems involve added costs for integration, staff training, and ongoing maintenance, which may deter adoption in price-sensitive markets.
Another major challenge is the lack of regulatory uniformity across regions. While countries like the U.S., Canada, and members of the European Union have well-defined and enforced environmental protection laws, several developing nations still lack strict or clearly defined standards for railcar spill containment. This inconsistency in enforcement hinders adoption in emerging economies, even as hazardous materials are being transported in increasing volumes.
Operational limitations and site constraints also pose challenges to the market. Rail terminals located in densely populated or geographically constrained areas may face difficulties in retrofitting existing infrastructure with spill containment systems. Issues such as drainage design, space availability, and disruption of daily operations during installation often discourage implementation.
In some cases, older infrastructure may require costly upgrades before containment systems can be installed, further complicating the process.
Low awareness and limited technical expertise, especially in developing regions, hinder the market growth. Many logistics companies and terminal operators may not be fully informed about the environmental risks, compliance requirements, or long-term cost benefits of railcar spill containment. This knowledge gap results in underinvestment and missed opportunities for enhancing safety and sustainability.
Country-Wise Outlook
U.S. Railcar Spill Containment Market sees Growth Driven by Stringent Regulatory Standards
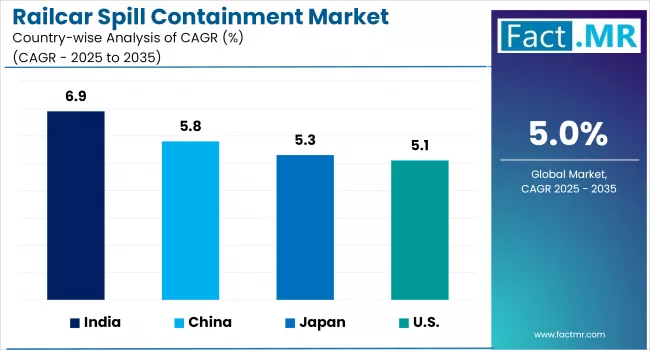
The U.S. railcar spill containment market is experiencing steady and sustained growth, primarily driven by stringent environmental regulations and an increase in hazardous materials transported by rail. Regulatory agencies such as the U.S. Environmental Protection Agency (EPA) and the Occupational Safety and Health Administration (OSHA) have implemented comprehensive guidelines, including the Spill Prevention, Control, and Countermeasure (SPCC) rule.
These regulations require rail operators and freight terminals to adopt robust spill containment systems to prevent soil and water contamination. As regulatory scrutiny intensifies, more companies are investing in durable and compliant containment infrastructure to avoid penalties and ensure environmental protection.
Another major driver of growth is the high volume of hazardous freight moved by rail across the country. With over 140,000 miles of rail network, the U.S. has one of the most extensive and heavily used rail systems globally, transporting large volumes of crude oil, chemicals, fertilizers, and industrial solvents.
The increasing reliance on rail for these materials inherently raises the risk of spills, leaks, and accidents. To mitigate these risks, companies are deploying spill containment systems at rail yards, loading and unloading stations, and storage terminals, further expanding the market.
Technological advancements are also playing a critical role in shaping the U.S. market. Companies are increasingly adopting smart spill containment systems that feature real-time monitoring, automated leak detection, and IoT-enabled sensors. These innovations enhance safety, reduce manual labor, and help companies meet compliance requirements more efficiently.
China witnesses Rapid Market Growth Backed by Rapid Industrialization
The railcar spill containment market in China is experiencing rapid expansion, driven by industrialization, infrastructure investment, and increasing environmental standards. China's industrial boom, especially in petrochemicals, chemicals, and energy, has led to increased use of rail to carry bulk hazardous materials. This growth has intensified the need for spill containment systems at terminals and on rail networks to reduce environmental risks.
Furthermore, the nation’s evolving regulatory framework and environmental policies are playing a significant role. New laws around spill prevention and water contamination are enforcing stricter standards. Along with rising public and corporate environmental responsibility, there is a strong demand for advanced solutions, including high-performance containment materials and IoT-based leak detection systems.
China is among the fastest-growing regional markets, with double-digit or high single-digit growth rates, driven by infrastructure investment, regulatory modernization, and the expansion of industrial logistics across freight transport.
Japan sees Strict Environmental Standards Fuels Demand for Railcar Spill Containment
The adoption of advanced containment systems in Japan is being driven by a combination of moderate regulatory tightness, growing environmental consciousness, and steady industrial activity. Although Japan’s environmental standards have long been rigorous, particularly concerning water and soil protection, the demand for additional spill-containment infrastructure is primarily concentrated in the petrochemical and heavy-chemicals sectors, where safety and compliance are paramount.
A shift is also occurring in containment technology. Japanese operators are increasingly upgrading to custom-engineered track pans and containment berms, which are tailored to meet the requirements of specific rail terminals and types of hazardous cargo. This innovation is supported by notable R&D investments, in line with global trends toward more resilient, corrosion-resistant materials and intelligent monitoring systems.
Japan’s market expansion will be characterized by steady, low- to mid-single-digit growth, as awareness of environmental risks increases and older rail infrastructure is incrementally retrofitted. However, compared to the more aggressive expansion seen in China and other Asian Pacific nations, Japan remains a mature market, oriented toward modernization and optimization rather than rapid capacity buildup.
Category-wise Analysis
Railcar to Exhibit Leading by Product
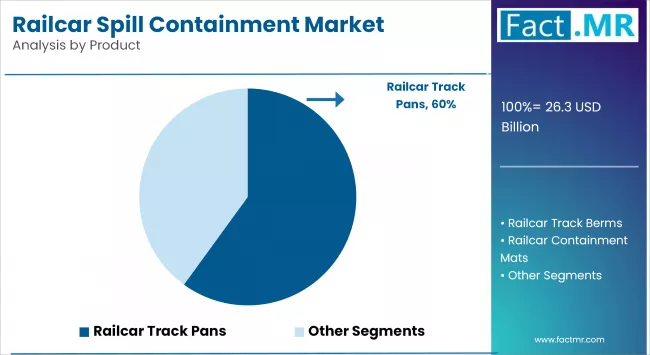
The railcar track pans segment holds the largest market share, driven by their use in rail terminals, chemical loading stations, and freight yards, where they are utilized for their high containment capacity, durability, and ease of installation.
These systems are typically constructed from heavy-duty materials, including polyethylene, steel, or fiberglass. They are designed to collect and contain spills from valves, hoses, and tank car fittings during loading and unloading operations. Moreover, regulatory compliance with SPCC and EPA spill control standards continues to drive investments in robust track pan systems.
The railcar containment mats segment is projected to be the fastest-growing over the forecast period. These mats offer a more portable and cost-effective solution for temporary or mobile containment applications. They are especially suited for short-term spill control, emergency response, or smaller operations that do not require permanent infrastructure.
Advancements in material science, such as the use of chemical-resistant and UV-stabilized fabrics, are enhancing the performance and reusability of containment mats. Their quick deployment, lightweight design, and ability to be used across multiple locations make them attractive for industries with dynamic operational needs. Growth is further accelerated by increasing awareness among small and mid-sized logistics firms seeking affordable, regulation-compliant containment solutions without the cost or complexity of permanent systems.
Stainless Steel to Exhibit Leading by Material
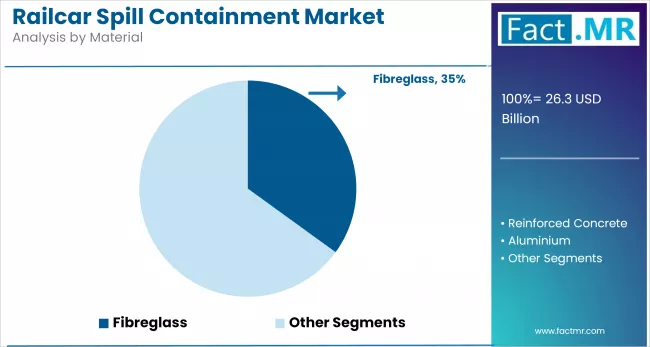
Polyethylene is the dominant material segment, accounting for the largest market share. This dominance is largely attributed to polyethylene’s excellent chemical resistance, lightweight nature, and cost-effectiveness. It is widely used in manufacturing track pans, berms, and spill pallets due to its high durability, corrosion resistance, and ability to withstand a wide range of hazardous substances, including acids, solvents, and petroleum-based liquids.
Polyethylene systems are also easier to install and maintain compared to heavier alternatives, such as reinforced concrete or metal. Its compatibility with modular designs and regulatory compliance requirements, especially in the oil & gas and chemical sectors, further strengthens its position as the leading material in spill containment applications.
Stainless steel is the fastest-growing material segment, driven by rising demand for high-strength, long-life, and high-performance containment systems in heavy industrial applications.
Stainless steel offers superior durability, load-bearing capacity, and resistance to extreme temperatures and corrosive chemicals, making it ideal for permanent installations at major rail terminals, refineries, and chemical processing facilities.
Oil & Gas to Exhibit Leading by End-Use Industry
The oil & gas industry represents the dominant end-use segment due to the high volume of crude oil, refined petroleum products, and other hazardous liquids transported via rail across long distances. The industry’s stringent safety and environmental standards necessitate the use of robust containment systems to prevent accidental leaks and spills during loading and unloading operations.
Regulatory mandates, such as the U.S. EPA's SPCC rule and equivalent standards in Canada and Europe, have further accelerated the adoption of railcar containment solutions in oil terminals and refineries.
The petrochemical industry is expected to be the fastest-growing end-use segment, fueled by global expansion in chemical manufacturing and rising cross-border rail transport of liquid chemicals and hazardous compounds. As the demand for plastics, solvents, and industrial chemicals increases, particularly in the Asia-Pacific and Middle East regions, so does the risk of railcar-related spills.
Petrochemical plants are increasingly installing containment systems to comply with environmental regulations, reduce liability, and ensure safe handling of aggressive chemicals. Moreover, advancements in material-resistant containment technologies and the growing number of specialized rail terminals serving petrochemical clusters are driving rapid growth in this segment.
Competitive Analysis
The railcar spill containment market is becoming increasingly competitive, with a mix of well-established players and emerging companies competing on innovation, regulatory compliance, and cost-efficiency. Companies offer a range of solutions, including track pans, berms, mats, and modular containment systems tailored for the oil & gas, chemical, and transportation industries. Their continued investment in product development and customization keeps them at the forefront of the market.
Product innovation and material advancements are key areas of competition. Leading players are focusing on developing high-performance containment systems using advanced materials such as UV-resistant polyethylene, stainless steel, and composite polymers. Moreover, the integration of smart technologies, such as IoT-based sensors, real-time leak detection, and remote monitoring systems, is helping manufacturers differentiate themselves in the market. These smart containment systems are particularly appealing in high-risk environments where quick response and data tracking are essential for regulatory compliance and operational safety.
Strategic collaborations and mergers & acquisitions are shaping the competitive dynamics of the market. For example, Eagle Manufacturing’s acquisition by Justrite Safety Group expanded its reach in industrial safety solutions, while partnerships between containment product suppliers and chemical or logistics firms are improving on-site implementation and service offerings. Such moves allow companies to enhance their technological capabilities, streamline supply chains, and enter new markets more effectively.
Key players in the railcar spill containment industry include Eagle Manufacturing, Enpac, Complete Environmental Products, The Century Group, Ultra Tech International, Safe Rack, Basic Concepts Inc., Pactec, Safe Harbor Access Systems, Polystar Containment, Aldon Company Inc., GEI Works, Clean It Up, and other notable companies.
Recent Development
- In March 2025, SafeRack, a leading provider of loading racks and safety solutions, completed a comprehensive installation at a railcar loading terminal. The project involved integrating spill containment track pans with gangways and safety cages, significantly enhancing both operational efficiency and worker safety while ensuring compliance with stringent environmental and occupational safety standards such as those set by the EPA and OSHA.
(Source: https://saferack.com/installations/spill-containment-gangway-platformom)
Segmentation of Railcar Spill Containment Market
By Product :
- Railcar Track Pans
- Railcar Track Berms
- Railcar Containment Mats
By Material :
- Fibreglass
- Reinforced Concrete
- Aluminium
- Stainless Steel
- Galvanised Steel
- Polyethylene
- Poly Vinyl Chloride
By End-Use Industry :
- Power Plants
- Oil & Gas Industries
- Petrochemical Industries
By Region :
- North America
- Latin America
- Western Europe
- Eastern Europe
- East Asia
- South Asia & Pacific
- Middle East & Africa
Table of Content
- Executive Summary
- Global Market Outlook
- Demand-side Trends
- Supply-side Trends
- Technology Roadmap Analysis
- Analysis and Recommendations
- Market Overview
- Market Coverage / Taxonomy
- Market Definition / Scope / Limitations
- Market Background
- Market Dynamics
- Drivers
- Restraints
- Opportunity
- Trends
- Scenario Forecast
- Demand in Optimistic Scenario
- Demand in Likely Scenario
- Demand in Conservative Scenario
- Opportunity Map Analysis
- Product Life Cycle Analysis
- Supply Chain Analysis
- Supply Side Participants and their Roles
- Producers
- Mid-Level Participants (Traders/ Agents/ Brokers)
- Wholesalers and Distributors
- Value Added and Value Created at Node in the Supply Chain
- List of Component Suppliers
- List of Existing and Potential Buyers
- Supply Side Participants and their Roles
- Investment Feasibility Matrix
- Value Chain Analysis
- Profit Margin Analysis
- Wholesalers and Distributors
- Retailers
- PESTLE and Porter’s Analysis
- Regulatory Landscape
- By Key Regions
- By Key Countries
- Production and Consumption Statistics
- Import and Export Statistics
- Market Dynamics
- Global Market Analysis 2020-2024 and Forecast, 2025-2035
- Historical Market Size Value (USD Bn) & Volume (Units) Analysis, 2020-2024
- Current and Future Market Size Value (USD Bn) & Volume (Units) Projections, 2025-2035
- Y-o-Y Growth Trend Analysis
- Absolute $ Opportunity Analysis
- Global Market Pricing Analysis 2020-2024 and Forecast 2025-2035
- Global Market Analysis 2020-2024 and Forecast 2025-2035, By Product
- Introduction / Key Findings
- Historical Market Size Value (USD Bn) & Volume (Units) Analysis By Product, 2020-2024
- Current and Future Market Size Value (USD Bn) & Volume (Units) Analysis and Forecast By Product, 2025-2035
- Railcar Track Pans
- Railcar Track Berms
- Railcar Containment Mats
- Y-o-Y Growth Trend Analysis By Product, 2020-2024
- Absolute $ Opportunity Analysis By Product, 2025-2035
- Global Market Analysis 2020-2024 and Forecast 2025-2035, By Material
- Introduction / Key Findings
- Historical Market Size Value (USD Bn) & Volume (Units) Analysis By Material, 2020-2024
- Current and Future Market Size Value (USD Bn) & Volume (Units) Analysis and Forecast By Material, 2025-2035
- Fibreglass
- Reinforced Concrete
- Aluminium
- Stainless Steel
- Galvanised Steel
- Y-o-Y Growth Trend Analysis By Material, 2020-2024
- Absolute $ Opportunity Analysis By Material, 2025-2035
- Global Market Analysis 2020-2024 and Forecast 2025-2035, By End-Use Industry
- Introduction / Key Findings
- Historical Market Size Value (USD Bn) & Volume (Units) Analysis By End-Use Industry, 2020-2024
- Current and Future Market Size Value (USD Bn) & Volume (Units) Analysis and Forecast By End-Use Industry, 2025-2035
- Power Plants
- Oil & Gas Industries
- Petrochemical Industries
- Y-o-Y Growth Trend Analysis By End-Use Industry, 2020-2024
- Absolute $ Opportunity Analysis By End-Use Industry, 2025-2035
- Global Market Analysis 2020-2024 and Forecast 2025-2035, By Region
- Introduction
- Historical Market Size Value (USD Bn) & Volume (Units) Analysis By Region, 2020-2024
- Current Market Size Value (USD Bn) & Volume (Units) Analysis and Forecast By Region, 2025-2035
- North America
- Latin America
- Western Europe
- East Asia
- South Asia Pacific
- Eastern Europe
- Middle East & Africa
- Market Attractiveness Analysis By Region
- North America Market Analysis 2020-2024 and Forecast 2025-2035, By Country
- Historical Market Size Value (USD Bn) & Volume (Units) Trend Analysis By Market Taxonomy, 2020-2024
- Market Size Value (USD Bn) & Volume (Units) Forecast By Market Taxonomy, 2025-2035
- By Country
- U.S.
- Canada
- Mexico
- By Product
- By Material
- By End-Use Industry
- By Country
- Market Attractiveness Analysis
- By Country
- By Product
- By Material
- By End-Use Industry
- Key Takeaways
- Latin America Market Analysis 2020-2024 and Forecast 2025-2035, By Country
- Historical Market Size Value (USD Bn) & Volume (Units) Trend Analysis By Market Taxonomy, 2020-2024
- Market Size Value (USD Bn) & Volume (Units) Forecast By Market Taxonomy, 2025-2035
- By Country
- Brazil
- Chile
- Rest of Latin America
- By Product
- By Material
- By End-Use Industry
- By Country
- Market Attractiveness Analysis
- By Country
- By Product
- By Material
- By End-Use Industry
- Key Takeaways
- Western Europe Market Analysis 2020-2024 and Forecast 2025-2035, By Country
- Historical Market Size Value (USD Bn) & Volume (Units) Trend Analysis By Market Taxonomy, 2020-2024
- Market Size Value (USD Bn) & Volume (Units) Forecast By Market Taxonomy, 2025-2035
- By Country
- Germany
- Italy
- France
- U.K.
- Spain
- Russia
- BENELUX
- Rest of Europe
- By Product
- By Material
- By End-Use Industry
- By Country
- Market Attractiveness Analysis
- By Country
- By Product
- By Material
- By End-Use Industry
- Key Takeaways
- East Asia Market Analysis 2020-2024 and Forecast 2025-2035, By Country
- Historical Market Size Value (USD Bn) & Volume (Units) Trend Analysis By Market Taxonomy, 2020-2024
- Market Size Value (USD Bn) & Volume (Units) Forecast By Market Taxonomy, 2025-2035
- By Country
- China
- Japan
- South Korea
- By Product
- By Material
- By End-Use Industry
- By Country
- Market Attractiveness Analysis
- By Country
- By Product
- By Material
- By End-Use Industry
- Key Takeaways
- South Asia Pacific Market Analysis 2020-2024 and Forecast 2025-2035, By Country
- Historical Market Size Value (USD Bn) & Volume (Units) Trend Analysis By Market Taxonomy, 2020-2024
- Market Size Value (USD Bn) & Volume (Units) Forecast By Market Taxonomy, 2025-2035
- By Country
- India
- ASEAN Countries
- Australia & New Zealand
- Rest of South Asia Pacific
- By Product
- By Material
- By End-Use Industry
- By Country
- Market Attractiveness Analysis
- By Country
- By Product
- By Material
- By End-Use Industry
- Key Takeaways
- Eastern Europe Market Analysis 2020-2024 and Forecast 2025-2035, By Country
- Historical Market Size Value (USD Bn) & Volume (Units) Trend Analysis By Market Taxonomy, 2020-2024
- Market Size Value (USD Bn) & Volume (Units) Forecast By Market Taxonomy, 2025-2035
- By Country
- Russia
- Poland
- Hungary
- Balkan & Baltics
- Rest of Eastern Europe
- By Product
- By Material
- By End-Use Industry
- By Country
- Market Attractiveness Analysis
- By Country
- By Product
- By Material
- By End-Use Industry
- Key Takeaways
- Middle East & Africa Market Analysis 2020-2024 and Forecast 2025-2035, By Country
- Historical Market Size Value (USD Bn) & Volume (Units) Trend Analysis By Market Taxonomy, 2020-2024
- Market Size Value (USD Bn) & Volume (Units) Forecast By Market Taxonomy, 2025-2035
- By Country
- KSA
- Other GCC Countries
- Turkiye
- South Africa
- Rest of MEA
- By Product
- By Material
- By End-Use Industry
- By Country
- Market Attractiveness Analysis
- By Country
- By Product
- By Material
- By End-Use Industry
- Key Takeaways
- Key Countries Market Analysis
- U.S.
- Pricing Analysis
- Market Share Analysis, 2024
- By Product
- By Material
- By End-Use Industry
- Canada
- Pricing Analysis
- Market Share Analysis, 2024
- By Product
- By Material
- By End-Use Industry
- Germany
- Pricing Analysis
- Market Share Analysis, 2024
- By Product
- By Material
- By End-Use Industry
- U.K.
- Pricing Analysis
- Market Share Analysis, 2024
- By Product
- By Material
- By End-Use Industry
- Australia
- Pricing Analysis
- Market Share Analysis, 2024
- By Product
- By Material
- By End-Use Industry
- U.S.
- Market Structure Analysis
- Competition Dashboard
- Competition Benchmarking
- Market Share Analysis of Top Players
- By Regional
- By Product
- By Material
- By End-Use Industry
- Competition Analysis
- Competition Deep Dive
- Eagle Manufacturing
- Overview
- Product Portfolio
- Profitability by Market Segments (Product/Age /Sales Channel/Region)
- Sales Footprint
- Strategy Overview
- Marketing Strategy
- Product Strategy
- Channel Strategy
- Enpac
- Overview
- Product Portfolio
- Profitability by Market Segments (Product/Age /Sales Channel/Region)
- Sales Footprint
- Strategy Overview
- Marketing Strategy
- Product Strategy
- Channel Strategy
- Complete Environmental Product
- Overview
- Product Portfolio
- Profitability by Market Segments (Product/Age /Sales Channel/Region)
- Sales Footprint
- Strategy Overview
- Marketing Strategy
- Product Strategy
- Channel Strategy
- The Century Group
- Overview
- Product Portfolio
- Profitability by Market Segments (Product/Age /Sales Channel/Region)
- Sales Footprint
- Strategy Overview
- Marketing Strategy
- Product Strategy
- Channel Strategy
- Ultra Tech International
- Overview
- Product Portfolio
- Profitability by Market Segments (Product/Age /Sales Channel/Region)
- Sales Footprint
- Strategy Overview
- Marketing Strategy
- Product Strategy
- Channel Strategy
- Safe Rack
- Overview
- Product Portfolio
- Profitability by Market Segments (Product/Age /Sales Channel/Region)
- Sales Footprint
- Strategy Overview
- Marketing Strategy
- Product Strategy
- Channel Strategy
- Basic Concepts Inc.
- Overview
- Product Portfolio
- Profitability by Market Segments (Product/Age /Sales Channel/Region)
- Sales Footprint
- Strategy Overview
- Marketing Strategy
- Product Strategy
- Channel Strategy
- Pactec
- Overview
- Product Portfolio
- Profitability by Market Segments (Product/Age /Sales Channel/Region)
- Sales Footprint
- Strategy Overview
- Marketing Strategy
- Product Strategy
- Channel Strategy
- Safe Harbor Access Systems
- Overview
- Product Portfolio
- Profitability by Market Segments (Product/Age /Sales Channel/Region)
- Sales Footprint
- Strategy Overview
- Marketing Strategy
- Product Strategy
- Channel Strategy
- Polystar Containment
- Overview
- Product Portfolio
- Profitability by Market Segments (Product/Age /Sales Channel/Region)
- Sales Footprint
- Strategy Overview
- Marketing Strategy
- Product Strategy
- Channel Strategy
- Aldon Company Inc.
- Overview
- Product Portfolio
- Profitability by Market Segments (Product/Age /Sales Channel/Region)
- Sales Footprint
- Strategy Overview
- Marketing Strategy
- Product Strategy
- Channel Strategy
- GEI Works
- Overview
- Product Portfolio
- Profitability by Market Segments (Product/Age /Sales Channel/Region)
- Sales Footprint
- Strategy Overview
- Marketing Strategy
- Product Strategy
- Channel Strategy
- Clean It Up
- Overview
- Product Portfolio
- Profitability by Market Segments (Product/Age /Sales Channel/Region)
- Sales Footprint
- Strategy Overview
- Marketing Strategy
- Product Strategy
- Channel Strategy
- Eagle Manufacturing
- Competition Deep Dive
- Assumptions & Acronyms Used
- Research Methodology
List Of Table
- Table 1: Global Market Value (USD Bn) Forecast by Region, 2020 to 2035
- Table 2: Global Market Volume (Units) Forecast by Region, 2020 to 2035
- Table 3: Global Market Value (USD Bn) Forecast by Product, 2020 to 2035
- Table 4: Global Market Volume (Units) Forecast by Product, 2020 to 2035
- Table 5: Global Market Value (USD Bn) Forecast by Material, 2020 to 2035
- Table 6: Global Market Volume (Units) Forecast by Material, 2020 to 2035
- Table 7: Global Market Value (USD Bn) Forecast by End-Use Industry, 2020 to 2035
- Table 8: Global Market Volume (Units) Forecast by End-Use Industry, 2020 to 2035
- Table 9: North America Market Value (USD Bn) Forecast by Country, 2020 to 2035
- Table 10: North America Market Volume (Units) Forecast by Country, 2020 to 2035
- Table 11: North America Market Value (USD Bn) Forecast by Product, 2020 to 2035
- Table 12: North America Market Volume (Units) Forecast by Product, 2020 to 2035
- Table 13: North America Market Value (USD Bn) Forecast by Material, 2020 to 2035
- Table 14: North America Market Volume (Units) Forecast by Material, 2020 to 2035
- Table 15: North America Market Value (USD Bn) Forecast by End-Use Industry, 2020 to 2035
- Table 16: North America Market Volume (Units) Forecast by End-Use Industry, 2020 to 2035
- Table 17: Latin America Market Value (USD Bn) Forecast by Country, 2020 to 2035
- Table 18: Latin America Market Volume (Units) Forecast by Country, 2020 to 2035
- Table 19: Latin America Market Value (USD Bn) Forecast by Product, 2020 to 2035
- Table 20: Latin America Market Volume (Units) Forecast by Product, 2020 to 2035
- Table 21: Latin America Market Value (USD Bn) Forecast by Material, 2020 to 2035
- Table 22: Latin America Market Volume (Units) Forecast by Material, 2020 to 2035
- Table 23: Latin America Market Value (USD Bn) Forecast by End-Use Industry, 2020 to 2035
- Table 24: Latin America Market Volume (Units) Forecast by End-Use Industry, 2020 to 2035
- Table 25: Western Europe Market Value (USD Bn) Forecast by Country, 2020 to 2035
- Table 26: Western Europe Market Volume (Units) Forecast by Country, 2020 to 2035
- Table 27: Western Europe Market Value (USD Bn) Forecast by Product, 2020 to 2035
- Table 28: Western Europe Market Volume (Units) Forecast by Product, 2020 to 2035
- Table 29: Western Europe Market Value (USD Bn) Forecast by Material, 2020 to 2035
- Table 30: Western Europe Market Volume (Units) Forecast by Material, 2020 to 2035
- Table 31: Western Europe Market Value (USD Bn) Forecast by End-Use Industry, 2020 to 2035
- Table 32: Western Europe Market Volume (Units) Forecast by End-Use Industry, 2020 to 2035
- Table 33: East Asia Market Value (USD Bn) Forecast by Country, 2020 to 2035
- Table 34: East Asia Market Volume (Units) Forecast by Country, 2020 to 2035
- Table 35: East Asia Market Value (USD Bn) Forecast by Product, 2020 to 2035
- Table 36: East Asia Market Volume (Units) Forecast by Product, 2020 to 2035
- Table 37: East Asia Market Value (USD Bn) Forecast by Material, 2020 to 2035
- Table 38: East Asia Market Volume (Units) Forecast by Material, 2020 to 2035
- Table 39: East Asia Market Value (USD Bn) Forecast by End-Use Industry, 2020 to 2035
- Table 40: East Asia Market Volume (Units) Forecast by End-Use Industry, 2020 to 2035
- Table 41: South Asia Pacific Market Value (USD Bn) Forecast by Country, 2020 to 2035
- Table 42: South Asia Pacific Market Volume (Units) Forecast by Country, 2020 to 2035
- Table 43: South Asia Pacific Market Value (USD Bn) Forecast by Product, 2020 to 2035
- Table 44: South Asia Pacific Market Volume (Units) Forecast by Product, 2020 to 2035
- Table 45: South Asia Pacific Market Value (USD Bn) Forecast by Material, 2020 to 2035
- Table 46: South Asia Pacific Market Volume (Units) Forecast by Material, 2020 to 2035
- Table 47: South Asia Pacific Market Value (USD Bn) Forecast by End-Use Industry, 2020 to 2035
- Table 48: South Asia Pacific Market Volume (Units) Forecast by End-Use Industry, 2020 to 2035
- Table 49: Eastern Europe Market Value (USD Bn) Forecast by Country, 2020 to 2035
- Table 50: Eastern Europe Market Volume (Units) Forecast by Country, 2020 to 2035
- Table 51: Eastern Europe Market Value (USD Bn) Forecast by Product, 2020 to 2035
- Table 52: Eastern Europe Market Volume (Units) Forecast by Product, 2020 to 2035
- Table 53: Eastern Europe Market Value (USD Bn) Forecast by Material, 2020 to 2035
- Table 54: Eastern Europe Market Volume (Units) Forecast by Material, 2020 to 2035
- Table 55: Eastern Europe Market Value (USD Bn) Forecast by End-Use Industry, 2020 to 2035
- Table 56: Eastern Europe Market Volume (Units) Forecast by End-Use Industry, 2020 to 2035
- Table 57: Middle East & Africa Market Value (USD Bn) Forecast by Country, 2020 to 2035
- Table 58: Middle East & Africa Market Volume (Units) Forecast by Country, 2020 to 2035
- Table 59: Middle East & Africa Market Value (USD Bn) Forecast by Product, 2020 to 2035
- Table 60: Middle East & Africa Market Volume (Units) Forecast by Product, 2020 to 2035
- Table 61: Middle East & Africa Market Value (USD Bn) Forecast by Material, 2020 to 2035
- Table 62: Middle East & Africa Market Volume (Units) Forecast by Material, 2020 to 2035
- Table 63: Middle East & Africa Market Value (USD Bn) Forecast by End-Use Industry, 2020 to 2035
- Table 64: Middle East & Africa Market Volume (Units) Forecast by End-Use Industry, 2020 to 2035
List Of Figures
- Figure 1: Global Market Volume (Units) Forecast 2020 to 2035
- Figure 2: Global Market Pricing Analysis
- Figure 3: Global Market Value (USD Bn) Forecast 2020 to 2035
- Figure 4: Global Market Value Share and BPS Analysis by Product, 2025 and 2035
- Figure 5: Global Market Y-o-Y Growth Comparison by Product, 2025 to 2035
- Figure 6: Global Market Attractiveness Analysis by Product
- Figure 7: Global Market Value Share and BPS Analysis by Material, 2025 and 2035
- Figure 8: Global Market Y-o-Y Growth Comparison by Material, 2025 to 2035
- Figure 9: Global Market Attractiveness Analysis by Material
- Figure 10: Global Market Value Share and BPS Analysis by End-Use Industry, 2025 and 2035
- Figure 11: Global Market Y-o-Y Growth Comparison by End-Use Industry, 2025 to 2035
- Figure 12: Global Market Attractiveness Analysis by End-Use Industry
- Figure 13: Global Market Value (USD Bn) Share and BPS Analysis by Region, 2025 and 2035
- Figure 14: Global Market Y-o-Y Growth Comparison by Region, 2025 to 2035
- Figure 15: Global Market Attractiveness Analysis by Region
- Figure 16: North America Market Incremental $ Opportunity, 2025 to 2035
- Figure 17: Latin America Market Incremental $ Opportunity, 2025 to 2035
- Figure 18: Western Europe Market Incremental $ Opportunity, 2025 to 2035
- Figure 19: East Asia Market Incremental $ Opportunity, 2025 to 2035
- Figure 20: South Asia Pacific Market Incremental $ Opportunity, 2025 to 2035
- Figure 21: Eastern Europe Market Incremental $ Opportunity, 2025 to 2035
- Figure 22: Middle East & Africa Market Incremental $ Opportunity, 2025 to 2035
- Figure 23: North America Market Value Share and BPS Analysis by Country, 2025 and 2035
- Figure 24: North America Market Value Share and BPS Analysis by Product, 2025 and 2035
- Figure 25: North America Market Y-o-Y Growth Comparison by Product, 2025 to 2035
- Figure 26: North America Market Attractiveness Analysis by Product
- Figure 27: North America Market Value Share and BPS Analysis by Material, 2025 and 2035
- Figure 28: North America Market Y-o-Y Growth Comparison by Material, 2025 to 2035
- Figure 29: North America Market Attractiveness Analysis by Material
- Figure 30: North America Market Value Share and BPS Analysis by End-Use Industry, 2025 and 2035
- Figure 31: North America Market Y-o-Y Growth Comparison by End-Use Industry, 2025 to 2035
- Figure 32: North America Market Attractiveness Analysis by End-Use Industry
- Figure 33: Latin America Market Value Share and BPS Analysis by Country, 2025 and 2035
- Figure 34: Latin America Market Value Share and BPS Analysis by Product, 2025 and 2035
- Figure 35: Latin America Market Y-o-Y Growth Comparison by Product, 2025 to 2035
- Figure 36: Latin America Market Attractiveness Analysis by Product
- Figure 37: Latin America Market Value Share and BPS Analysis by Material, 2025 and 2035
- Figure 38: Latin America Market Y-o-Y Growth Comparison by Material, 2025 to 2035
- Figure 39: Latin America Market Attractiveness Analysis by Material
- Figure 40: Latin America Market Value Share and BPS Analysis by End-Use Industry, 2025 and 2035
- Figure 41: Latin America Market Y-o-Y Growth Comparison by End-Use Industry, 2025 to 2035
- Figure 42: Latin America Market Attractiveness Analysis by End-Use Industry
- Figure 43: Western Europe Market Value Share and BPS Analysis by Country, 2025 and 2035
- Figure 44: Western Europe Market Value Share and BPS Analysis by Product, 2025 and 2035
- Figure 45: Western Europe Market Y-o-Y Growth Comparison by Product, 2025 to 2035
- Figure 46: Western Europe Market Attractiveness Analysis by Product
- Figure 47: Western Europe Market Value Share and BPS Analysis by Material, 2025 and 2035
- Figure 48: Western Europe Market Y-o-Y Growth Comparison by Material, 2025 to 2035
- Figure 49: Western Europe Market Attractiveness Analysis by Material
- Figure 50: Western Europe Market Value Share and BPS Analysis by End-Use Industry, 2025 and 2035
- Figure 51: Western Europe Market Y-o-Y Growth Comparison by End-Use Industry, 2025 to 2035
- Figure 52: Western Europe Market Attractiveness Analysis by End-Use Industry
- Figure 53: East Asia Market Value Share and BPS Analysis by Country, 2025 and 2035
- Figure 54: East Asia Market Value Share and BPS Analysis by Product, 2025 and 2035
- Figure 55: East Asia Market Y-o-Y Growth Comparison by Product, 2025 to 2035
- Figure 56: East Asia Market Attractiveness Analysis by Product
- Figure 57: East Asia Market Value Share and BPS Analysis by Material, 2025 and 2035
- Figure 58: East Asia Market Y-o-Y Growth Comparison by Material, 2025 to 2035
- Figure 59: East Asia Market Attractiveness Analysis by Material
- Figure 60: East Asia Market Value Share and BPS Analysis by End-Use Industry, 2025 and 2035
- Figure 61: East Asia Market Y-o-Y Growth Comparison by End-Use Industry, 2025 to 2035
- Figure 62: East Asia Market Attractiveness Analysis by End-Use Industry
- Figure 63: South Asia Pacific Market Value Share and BPS Analysis by Country, 2025 and 2035
- Figure 64: South Asia Pacific Market Value Share and BPS Analysis by Product, 2025 and 2035
- Figure 65: South Asia Pacific Market Y-o-Y Growth Comparison by Product, 2025 to 2035
- Figure 66: South Asia Pacific Market Attractiveness Analysis by Product
- Figure 67: South Asia Pacific Market Value Share and BPS Analysis by Material, 2025 and 2035
- Figure 68: South Asia Pacific Market Y-o-Y Growth Comparison by Material, 2025 to 2035
- Figure 69: South Asia Pacific Market Attractiveness Analysis by Material
- Figure 70: South Asia Pacific Market Value Share and BPS Analysis by End-Use Industry, 2025 and 2035
- Figure 71: South Asia Pacific Market Y-o-Y Growth Comparison by End-Use Industry, 2025 to 2035
- Figure 72: South Asia Pacific Market Attractiveness Analysis by End-Use Industry
- Figure 73: Eastern Europe Market Value Share and BPS Analysis by Country, 2025 and 2035
- Figure 74: Eastern Europe Market Value Share and BPS Analysis by Product, 2025 and 2035
- Figure 75: Eastern Europe Market Y-o-Y Growth Comparison by Product, 2025 to 2035
- Figure 76: Eastern Europe Market Attractiveness Analysis by Product
- Figure 77: Eastern Europe Market Value Share and BPS Analysis by Material, 2025 and 2035
- Figure 78: Eastern Europe Market Y-o-Y Growth Comparison by Material, 2025 to 2035
- Figure 79: Eastern Europe Market Attractiveness Analysis by Material
- Figure 80: Eastern Europe Market Value Share and BPS Analysis by End-Use Industry, 2025 and 2035
- Figure 81: Eastern Europe Market Y-o-Y Growth Comparison by End-Use Industry, 2025 to 2035
- Figure 82: Eastern Europe Market Attractiveness Analysis by End-Use Industry
- Figure 83: Middle East & Africa Market Value Share and BPS Analysis by Country, 2025 and 2035
- Figure 84: Middle East & Africa Market Value Share and BPS Analysis by Product, 2025 and 2035
- Figure 85: Middle East & Africa Market Y-o-Y Growth Comparison by Product, 2025 to 2035
- Figure 86: Middle East & Africa Market Attractiveness Analysis by Product
- Figure 87: Middle East & Africa Market Value Share and BPS Analysis by Material, 2025 and 2035
- Figure 88: Middle East & Africa Market Y-o-Y Growth Comparison by Material, 2025 to 2035
- Figure 89: Middle East & Africa Market Attractiveness Analysis by Material
- Figure 90: Middle East & Africa Market Value Share and BPS Analysis by End-Use Industry, 2025 and 2035
- Figure 91: Middle East & Africa Market Y-o-Y Growth Comparison by End-Use Industry, 2025 to 2035
- Figure 92: Middle East & Africa Market Attractiveness Analysis by End-Use Industry
- Figure 93: Global Market - Tier Structure Analysis
- Figure 94: Global Market - Company Share Analysis
- FAQs -
What is the Global Railcar Spill Containment Market size in 2025?
The railcar spill containment market is valued at USD 26.3 billion in 2025.
Who are the Major Players Operating in the Railcar Spill Containment Market?
Prominent players in the market include Eagle Manufacturing, Enpac, Complete Environmental Product, The Century Group, and Ultra Tech International.
What is the Estimated Valuation of the Railcar Spill Containment Market by 2035?
The market is expected to reach a valuation of USD 42.8 billion by 2035.
What Value CAGR Did the Railcar Spill Containment Market Exhibit Over the Last Five Years?
The growth rate of the railcar spill containment market is 4.2% from 2020-2024.