Mannequin Market
Mannequin Market Analysis, By Product Type (Head, Full Body, Upper Body, and Lower Body Mannequins), By Material Type, By Target Group, and Region - Market Insights 2025 to 2035
The Fiberglass segment projected to grow at a CAGR of 5.7%, whereas another segment Polyethylene is likely to grow at 7.0%. In terms of countries U.S. is projected to grow at 6.3%, followed by Japan at 7.8% and Germany to grow at 7.4%.
Mannequin Market Outlook (2025 to 2035)
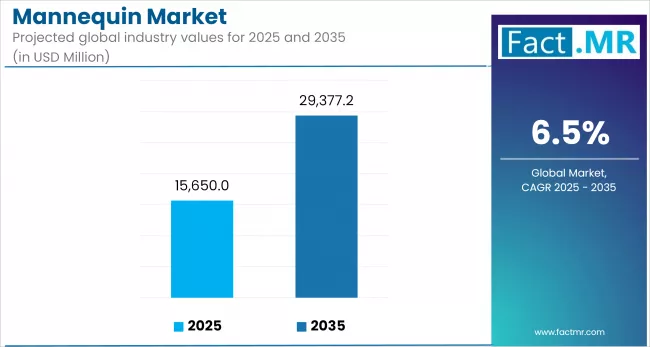
The global mannequin market is expected to reach USD 29,377 million by 2035, up from USD 14,930 million in 2024. During the forecast period (2025 to 2035), the industry is projected to grow at a CAGR of 6.5%.
The demand for visual merchandising, lifelike displays, and thematic flexibility, combined with interactive technology, sustainability trends, and omnichannel strategies, is boosting the mannequin market. These drivers enhance in-store aesthetics, consumer engagement, and environmental compliance.
What are the drivers of mannequin market?
The growth of the fashion and apparel market, particularly the expansion of retail chains and flagship stores across the global market, is the primary factor driving the mannequin market. The visual appeal has become a key marketing tool in the brand's positioning strategy, and mannequins are essential in promoting the in-store ambiance and customer experience. The fashion season is progressing faster, and therefore, theme-based and adjustable mannequins are gaining popularity.
The consumer's desire for a more engaging shopping experience is a driving factor spurring the demand for the use of interactive and realistic mannequins. Mannequins are now being invested in by brands with realistic feel textures, motion sensors, and even AI-enhanced screens to display attire more persuasively. The physical store differentiation reinforces the adoption of mannequins, as well as the emergence of omnichannel retailing.
Increasing sustainability issues raise the question of whether manufacturers are creating eco-friendly mannequins out of recyclable or biodegradable materials. This transformation is not only attractive to retailers who highly regard the environment, but it also meets regulatory standards, which further long-term market development.
What are the regional trends of mannequin market?
In North America, more so in the U.S, large expenditure on clothes by consumers coupled with market penetration of international fashion labels supports the mannequin industry. Retailers are emphasizing luxurious, lifelike mannequins to enhance the customer experience. Customization is also an increasing trend.
The use of eco-friendly mannequins in countries such as Germany, France and the UK is on the rise in Europe. Retail Strategies: With sustainability at the center of the retail world, the demand for recyclable materials and minimalist designs is noticeable.
High-speed urbanization, as well as the rising retail fashion market in the Asian-Pacific regions and mall construction in China, India and Southeast Asia, drive the demand. There are also developments of domestic mannequin manufacturers who sell cheaper alternatives to retailers in the region.
Latin America is experiencing moderate expansion with increasing fashion retailing in Brazil and Mexico. Mannequins are also being creatively employed to attract younger markets and shoppers who are familiar with social media.
What are the challenges and restraining factors of mannequin market?
A significant threat to the mannequin market is the growing trend toward online shopping as it curtails traffic in stores and decreases the need to use physical merchandise presentation tools such as mannequins. As e-commerce corporations increasingly focus on digital product visualization over actual merchandising, it becomes challenging to develop the market.
Another fear among small and medium scale retailers is the high expenses of high-quality mannequins, particularly designer ones with fiber glass or smart embedded characteristics. The immediate cost might discourage uptake, especially in price-sensitive economies, such as those in the developing world.
There are plans to replace the use of traditional plastic mannequins with biodegradable mannequins due to the requirements of sustainability regulation; however, there are fewer quantities of eco-friendly materials, and their high costs are a drawback to operational maneuverability among manufacturers.
Furthermore, storage and maintenance problems, particularly with full-body mannequins, can make logistics cumbersome, especially for retailers with limited space. Finally, there is the issue of breakability and fragility of certain materials, such as fiberglass, which leads to regular replacement of the materials and operational inefficiencies.
In order to remain relevant, mannequin manufacturers should innovate towards durability, modularity and sustainability, accompanied by competitive pricing in the changing world of retailing.
Country-Wise Outlook
Innovation in training drives growth in medical simulation
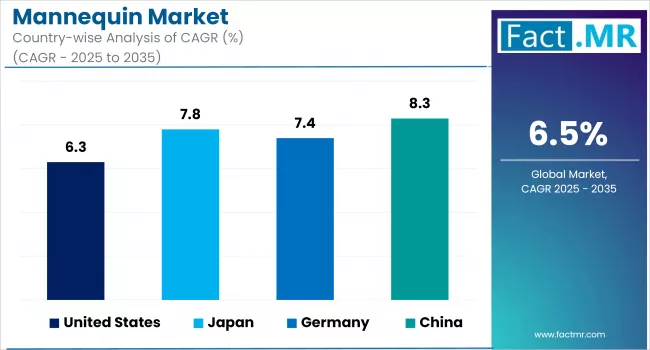
The United States has already grown into a market leader in mannequins, particularly in medical simulation and in healthcare education. Determinants include an upward trend in nursing and clinical training program investment, the spread of high fidelity simulation technology and the enactment of competency-based assessment requirements. Demand stems from the existence of simulation centers within the major institutes and the military training facilities.
The high speed at which technology is defining this industry has introduced new mannequins that quickly incorporate functions like wireless modeling, real-time response of physiological data, as well as AR/VR platform compatibility. Simulation software and analytics hosted in the cloud help institutions monitor their performance. This trend is supported by the programs such as the NCSBN National Simulation Study or NIH and DoD investing in trauma simulation.
They include ALS manikins, birthing simulators, trauma care dummies, and full-body adult patient simulators that feature ECG and airway compliance, as well as vascular access.
Japan advances aging care & disaster preparedness through simulation tools
The market of mannequins in Japan is highlighted due to an ageing population, high robotics technology, and an emphasis on disaster response education and training. Under policies such as Community-based Integrated Care Systems, the government encourages the development of simulation-based learning in eldercare, emergency medical services (EMS) and chronic disease management.
Tech Firms and universities in Japan work to develop the most realistic geriatric mannequins and caregiving robots. These mimic real phenomena of the patient's manner, such as facial expressions, pulse, and respiratory movements. Mannequins are also integrated into national earthquake and pandemic disaster drills.
The trends in technology involve IoT-enabled manikins, AI-assisted patient simulation, and caregiver training dummies that incorporate telemedicine feedback.
Germany scales medical simulation with EU-supported digital health infrastructure
Germany has been a leader in the mannequin market due to its affinity for digital healthcare education, regulatory-aligned medical training, and well-established hospital facilities. An EU grant and national funding programs, such as the Digital Pact for Schools, enhance the nursing and paramedical institutes’ simulation capabilities.
Mannequins are prominent throughout anesthesiology, surgical training, and emergency medicine. Particular attention is paid to connecting mannequins with such diagnostic devices as portable ultrasound, ECG monitors, and CPR feedback devices. Academic centers submit studies and training opportunities with companies to develop life-like adult and pediatric manikin-based scenario-based learning modules.
Recent innovations in Germany include the overlay of AR/VR in digital simulation labs, remote instructor feedback solutions and AI-enabled competency assessment to increase realism and improve learning.
Category-Wise Analysis
Fiberglass remains the preferred material for durable and aesthetic mannequin displays
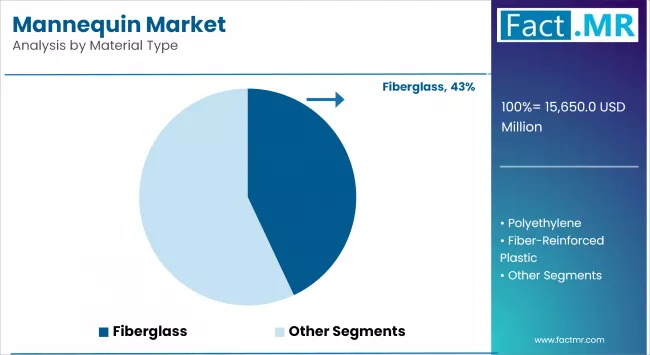
Fiberglass still reigns supreme as the material of choice for mannequins because it is durable, lightweight, and can support fine detailing. Its wedding cake consistency is ideal for sculpting lifelike features, which is necessary in high-end fashion displays in retail stores.
The use of fiberglass mannequins is durable and not subject to environmental wear and tear; hence, they can be used both indoors and outdoors. It is also possible to customize the material paints, making it very important in brand-specific aesthetics.
Full body mannequins serve as the gold standard for comprehensive visual merchandising
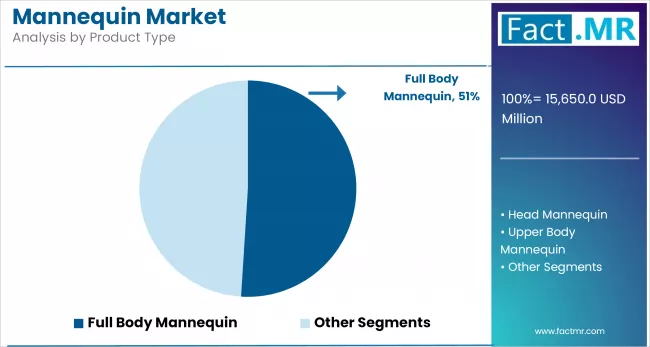
Full-body mannequins form part of contemporary visual merchandising, which gives the retailer the advantage of displaying outfits in life-size applications. Such mannequins help improve the shopping experience by providing consumer with a visible impression of how the clothing fits and looks to build more confidence about their purchase intent.
They are especially frequent in big stores, chains and fashion shops. As experiential retail grew in popularity, full-body mannequins assisted brands in realizing a shoulder-to-shoulder prospect and portraying an immersive narrative with total fashion scenes.
Adult mannequins anchor retail strategies for core consumer demographics
Adult mannequins constitute the majority of the demand in the mannequin market, as they depict the primary target segment of most fashion and lifestyle brands. These mannequins are used to demonstrate clothing and accessories for adults and are typically physically proportioned to resemble real bodies, making them lifelike.
They play an indispensable role in both luxury and mass-market retailing, so they can introduce seasonal collections, workwear, or casual outfits in forms that would appeal to the end consumers.
Competitive Analysis
The mannequin market globally is a moderately concentrated market with a mixture of major players and a set of industry specialists playing in both regional and global plane. The major competitive properties revolve around material innovation, the ability to have customization and adoption of digital technologies. Firms supplying mannequins that have modular components, realistic looks as well as environmental friendly materials are gaining competitive benefit.
Trends in retail displays keep progressing always demanding the mannequins capable of expressing diversity in body shapes, gender neutrality, and diverse features that attract all cultures. Such shift is also beneficial to manufacturers that are able to adjust easily to the sensitivity of consumers and brands. Also, the development of 3D printing, integration with virtual fitting and augmented reality when mannequins are being prototyped and designed is reworking the way things are done and cutting lead times.
Effective collaboration with boutique stores, merchandising design agencies and online sales websites is the key to consistent performance in the market and promotion of brand distinction.
Key players in the market are Hans Boodt Mannequins, Genesis Display GmbH, Proportion London Ltd., Xiamen Crystal Mannequin, CORTEC GmbH, Cofrad Mannequins, Xiamen Nanyang Mannequins and Hangers Co. Ltd., Wuxi Elegant Mannequin Co. Ltd., Bonavery Mannequins, Window France, Noa Brands Europe S.L., and other players.
Recent Development
- In November 2024, HOL Mannequins, a leading industry player, unveiled the top mannequin design trends for 2024. These include cutting-edge materials, technological integration, and the latest aesthetic styles. The focus is on enhancing personalization and integrating augmented reality and interactive features to revolutionize the customer experience.
- In March 2023, Outform, a global innovation agency, introduced an interactive Digital Mannequin at the EuroShop retail trade fair. This advancement enables fashion retailers to enhance the in-store shopping experience by allowing customers to manage the products they see and their in-store representations using their smartphones.
Fact.MR has provided detailed information about the price points of key manufacturers of the mannequin market positioned across regions, sales growth, production capacity, and speculative technological expansion, in the recently published report.
Methodology and Industry Tracking Approach
Fact.MR consulted approximately 2,940 certified stakeholders from the international mannequin market in a questionnaire conducted across 19 countries in 2025. The survey was conducted on or before October 2020, covering at least 100 specialists in each country, including those in retail merchandising psychology, sustainable display technologies, and textile-integrated mannequin users.
Some of the key verticals included were responsive posture mechanisms, augmented reality (AR) dressing mirrors, and modular disassembling structures that enable simple global logistics.
Between June 2024 and May 2025, key trends in the industry will be identified by Fact.MR reports were to include recyclable mannequins crafted using biodegradable polymers, gender-neutral forms in tandem with inclusive retail branding, and dynamic facial expressions littered with in-store AI.
Another observation was the sharp increase in venture capital investments over 3D-printable mannequin kits, lightweight collapsible torso systems of pop-up shops and rental-based mannequin distribution services - particularly experienced in SE Asia and Eastern Europe, where both are emerging as key destinations in the experimentation of retail formats.
The creation of mannequin material science, omnichannel display integration, and support in experiential retailing are innovations followed by Fact.MR since 2018. The emergence of new intersections highlights AI-guided pose calibration, low-carbon production processes, and responsive style structures that integrate aesthetic requirements, modularity, and local design considerations.
Segmentation of Mannequin market
-
By Product Type :
- Head Mannequin
- Full Body Mannequin
- Upper Body Mannequin
- Lower Body Mannequin
-
By Material Type :
- Fiberglass
- Polyethylene
- Fiber-Reinforced Plastic
- Chrome
- Polypropylene (PP)
- Foam
- Metal
- Wood
- Other Materials
-
By Target Group :
- Adults Mannequin
- Children Mannequin
- Infants & Toddlers Mannequin
-
By Region :
- North America
- Latin America
- Western Europe
- Eastern Europe
- East Asia
- South Asia & Pacific
- Middle East & Africa
Table of Content
- Executive Summary
- Global Market Outlook
- Demand-side Trends
- Supply-side Trends
- Technology Roadmap Analysis
- Analysis and Recommendations
- Market Overview
- Market Coverage / Taxonomy
- Market Definition / Scope / Limitations
- Market Background
- Market Dynamics
- Drivers
- Restraints
- Opportunity
- Trends
- Scenario Forecast
- Demand in Optimistic Scenario
- Demand in Likely Scenario
- Demand in Conservative Scenario
- Opportunity Map Analysis
- Product Life Cycle Analysis
- Supply Chain Analysis
- Supply Side Participants and their Roles
- Producers
- Mid-Level Participants (Traders/ Agents/ Brokers)
- Wholesalers and Distributors
- Value Added and Value Created at Node in the Supply Chain
- List of Component Suppliers
- List of Existing and Potential Buyers
- Supply Side Participants and their Roles
- Investment Feasibility Matrix
- Value Chain Analysis
- Profit Margin Analysis
- Wholesalers and Distributors
- Retailers
- PESTLE and Porter’s Analysis
- Regulatory Landscape
- By Key Regions
- By Key Countries
- Production and Consumption Statistics
- Import and Export Statistics
- Market Dynamics
- Global Analysis 2020 to 2024 and Forecast, 2025 to 2035
- Historical Market Size Value (USD Mn) & Volume (Units) Analysis, 2020 to 2024
- Current and Future Market Size Value (USD Mn) & Volume (Units) Projections, 2025 to 2035
- Y-o-Y Growth Trend Analysis
- Absolute $ Opportunity Analysis
- Global Pricing Analysis 2020 to 2024 and Forecast 2025 to 2035
- Global Analysis 2020 to 2024 and Forecast 2025 to 2035, By Product Type
- Introduction / Key Findings
- Historical Market Size Value (USD Mn) & Volume (Units) Analysis By Product Type, 2020 to 2024
- Current and Future Market Size Value (USD Mn) & Volume (Units) Analysis and Forecast By Product Type, 2025 to 2035
- Head Mannequin
- Full Body Mannequin
- Upper Body Mannequin
- Lower Body Mannequin
- Y-o-Y Growth Trend Analysis By Product Type, 2020 to 2024
- Absolute $ Opportunity Analysis By Product Type, 2025 to 2035
- Global Analysis 2020 to 2024 and Forecast 2025 to 2035, By Material Type
- Introduction / Key Findings
- Historical Market Size Value (USD Mn) & Volume (Units) Analysis By Material Type, 2020 to 2024
- Current and Future Market Size Value (USD Mn) & Volume (Units) Analysis and Forecast By Material Type, 2025 to 2035
- Fiberglass
- Polyethylene
- Fiber-Reinforced Plastic
- Chrome
- Polypropylene (PP)
- Foam
- Metal
- Wood
- Other Materials
- Y-o-Y Growth Trend Analysis By Material Type, 2020 to 2024
- Absolute $ Opportunity Analysis By Material Type, 2025 to 2035
- Global Analysis 2020 to 2024 and Forecast 2025 to 2035, By Target Group
- Introduction / Key Findings
- Historical Market Size Value (USD Mn) & Volume (Units) Analysis By Target Group, 2020 to 2024
- Current and Future Market Size Value (USD Mn) & Volume (Units) Analysis and Forecast By Target Group, 2025 to 2035
- Adults Mannequin
- Children Mannequin
- Infants & Toddlers Mannequin
- Y-o-Y Growth Trend Analysis By Target Group, 2020 to 2024
- Absolute $ Opportunity Analysis By Target Group, 2025 to 2035
- Global Analysis 2020 to 2024 and Forecast 2025 to 2035, By Region
- Introduction
- Historical Market Size Value (USD Mn) & Volume (Units) Analysis By Region, 2020 to 2024
- Current Market Size Value (USD Mn) & Volume (Units) Analysis and Forecast By Region, 2025 to 2035
- North America
- Latin America
- Europe
- East Asia
- South Asia
- Oceania
- MEA
- Market Attractiveness Analysis By Region
- North America Analysis 2020 to 2024 and Forecast 2025 to 2035, By Country
- Historical Market Size Value (USD Mn) & Volume (Units) Trend Analysis By Market Taxonomy, 2020 to 2024
- Market Size Value (USD Mn) & Volume (Units) Forecast By Market Taxonomy, 2025 to 2035
- By Country
- U.S.
- Canada
- By Product Type
- By Material Type
- By Target Group
- By Country
- Market Attractiveness Analysis
- By Country
- By Product Type
- By Material Type
- By Target Group
- Key Takeaways
- Latin America Analysis 2020 to 2024 and Forecast 2025 to 2035, By Country
- Historical Market Size Value (USD Mn) & Volume (Units) Trend Analysis By Market Taxonomy, 2020 to 2024
- Market Size Value (USD Mn) & Volume (Units) Forecast By Market Taxonomy, 2025 to 2035
- By Country
- Brazil
- Mexico
- Argentina
- Chile
- Peru
- Rest of Latin America
- By Product Type
- By Material Type
- By Target Group
- By Country
- Market Attractiveness Analysis
- By Country
- By Product Type
- By Material Type
- By Target Group
- Key Takeaways
- Europe Analysis 2020 to 2024 and Forecast 2025 to 2035, By Country
- Historical Market Size Value (USD Mn) & Volume (Units) Trend Analysis By Market Taxonomy, 2020 to 2024
- Market Size Value (USD Mn) & Volume (Units) Forecast By Market Taxonomy, 2025 to 2035
- By Country
- Germany
- Italy
- France
- U.K.
- Spain
- Russia
- BENELUX
- Rest of Europe
- By Product Type
- By Material Type
- By Target Group
- By Country
- Market Attractiveness Analysis
- By Country
- By Product Type
- By Material Type
- By Target Group
- Key Takeaways
- East Asia Analysis 2020 to 2024 and Forecast 2025 to 2035, By Country
- Historical Market Size Value (USD Mn) & Volume (Units) Trend Analysis By Market Taxonomy, 2020 to 2024
- Market Size Value (USD Mn) & Volume (Units) Forecast By Market Taxonomy, 2025 to 2035
- By Country
- China
- Japan
- South Korea
- By Product Type
- By Material Type
- By Target Group
- By Country
- Market Attractiveness Analysis
- By Country
- By Product Type
- By Material Type
- By Target Group
- Key Takeaways
- South Asia Analysis 2020 to 2024 and Forecast 2025 to 2035, By Country
- Historical Market Size Value (USD Mn) & Volume (Units) Trend Analysis By Market Taxonomy, 2020 to 2024
- Market Size Value (USD Mn) & Volume (Units) Forecast By Market Taxonomy, 2025 to 2035
- By Country
- India
- Thailand
- Malaysia
- Indonesia
- Rest of South Asia
- By Product Type
- By Material Type
- By Target Group
- By Country
- Market Attractiveness Analysis
- By Country
- By Product Type
- By Material Type
- By Target Group
- Key Takeaways
- Oceania Analysis 2020 to 2024 and Forecast 2025 to 2035, By Country
- Historical Market Size Value (USD Mn) & Volume (Units) Trend Analysis By Market Taxonomy, 2020 to 2024
- Market Size Value (USD Mn) & Volume (Units) Forecast By Market Taxonomy, 2025 to 2035
- By Country
- Australia
- New Zealand
- By Product Type
- By Material Type
- By Target Group
- By Country
- Market Attractiveness Analysis
- By Country
- By Product Type
- By Material Type
- By Target Group
- Key Takeaways
- MEA Analysis 2020 to 2024 and Forecast 2025 to 2035, By Country
- Historical Market Size Value (USD Mn) & Volume (Units) Trend Analysis By Market Taxonomy, 2020 to 2024
- Market Size Value (USD Mn) & Volume (Units) Forecast By Market Taxonomy, 2025 to 2035
- By Country
- GCC
- Rest of MEA
- By Product Type
- By Material Type
- By Target Group
- By Country
- Market Attractiveness Analysis
- By Country
- By Product Type
- By Material Type
- By Target Group
- Key Takeaways
- Key Countries Analysis
- U.S.
- Pricing Analysis
- Market Share Analysis, 2024
- By Product Type
- By Material Type
- By Target Group
- Japan
- Pricing Analysis
- Market Share Analysis, 2024
- By Product Type
- By Material Type
- By Target Group
- Germany
- Pricing Analysis
- Market Share Analysis, 2024
- By Product Type
- By Material Type
- By Target Group
- China
- Pricing Analysis
- Market Share Analysis, 2024
- By Product Type
- By Material Type
- By Target Group
- France
- Pricing Analysis
- Market Share Analysis, 2024
- By Product Type
- By Material Type
- By Target Group
- U.S.
- Market Structure Analysis
- Competition Dashboard
- Competition Benchmarking
- Market Share Analysis of Top Players
- By Regional
- By Product Type
- By Material Type
- By Target Group
- Competition Analysis
- Competition Deep Dive
- Hans Boodt Mannequins
- Overview
- Product Portfolio
- Profitability by Market Segments (Product/Age /Sales Channel/Region)
- Sales Footprint
- Strategy Overview
- Marketing Strategy
- Product Strategy
- Channel Strategy
- Genesis Display GmbH
- Overview
- Product Portfolio
- Profitability by Market Segments (Product/Age /Sales Channel/Region)
- Sales Footprint
- Strategy Overview
- Marketing Strategy
- Product Strategy
- Channel Strategy
- Proportion London Ltd.
- Overview
- Product Portfolio
- Profitability by Market Segments (Product/Age /Sales Channel/Region)
- Sales Footprint
- Strategy Overview
- Marketing Strategy
- Product Strategy
- Channel Strategy
- Xiamen Crystal Mannequin
- Overview
- Product Portfolio
- Profitability by Market Segments (Product/Age /Sales Channel/Region)
- Sales Footprint
- Strategy Overview
- Marketing Strategy
- Product Strategy
- Channel Strategy
- CORTEC GmbH
- Overview
- Product Portfolio
- Profitability by Market Segments (Product/Age /Sales Channel/Region)
- Sales Footprint
- Strategy Overview
- Marketing Strategy
- Product Strategy
- Channel Strategy
- Cofrad Mannequins
- Overview
- Product Portfolio
- Profitability by Market Segments (Product/Age /Sales Channel/Region)
- Sales Footprint
- Strategy Overview
- Marketing Strategy
- Product Strategy
- Channel Strategy
- Xiamen Nanyang Mannequins and Hangers Co. Ltd.
- Overview
- Product Portfolio
- Profitability by Market Segments (Product/Age /Sales Channel/Region)
- Sales Footprint
- Strategy Overview
- Marketing Strategy
- Product Strategy
- Channel Strategy
- Wuxi Elegant Mannequin Co. Ltd.
- Overview
- Product Portfolio
- Profitability by Market Segments (Product/Age /Sales Channel/Region)
- Sales Footprint
- Strategy Overview
- Marketing Strategy
- Product Strategy
- Channel Strategy
- Bonavery Mannequins
- Overview
- Product Portfolio
- Profitability by Market Segments (Product/Age /Sales Channel/Region)
- Sales Footprint
- Strategy Overview
- Marketing Strategy
- Product Strategy
- Channel Strategy
- Window France
- Overview
- Product Portfolio
- Profitability by Market Segments (Product/Age /Sales Channel/Region)
- Sales Footprint
- Strategy Overview
- Marketing Strategy
- Product Strategy
- Channel Strategy
- Noa Brands Europe S.L
- Overview
- Product Portfolio
- Profitability by Market Segments (Product/Age /Sales Channel/Region)
- Sales Footprint
- Strategy Overview
- Marketing Strategy
- Product Strategy
- Channel Strategy
- Hans Boodt Mannequins
- Competition Deep Dive
- Assumptions & Acronyms Used
- Research Methodology
List Of Table
- Table 1: Global Value (USD Mn) Forecast by Region, 2020 to 2035
- Table 2: Global Volume (Units) Forecast by Region, 2020 to 2035
- Table 3: Global Value (USD Mn) Forecast by Product Type, 2020 to 2035
- Table 4: Global Volume (Units) Forecast by Product Type, 2020 to 2035
- Table 5: Global Value (USD Mn) Forecast by Material Type, 2020 to 2035
- Table 6: Global Volume (Units) Forecast by Material Type, 2020 to 2035
- Table 7: Global Value (USD Mn) Forecast by Target Group, 2020 to 2035
- Table 8: Global Volume (Units) Forecast by Target Group, 2020 to 2035
- Table 9: North America Value (USD Mn) Forecast by Country, 2020 to 2035
- Table 10: North America Volume (Units) Forecast by Country, 2020 to 2035
- Table 11: North America Value (USD Mn) Forecast by Product Type, 2020 to 2035
- Table 12: North America Volume (Units) Forecast by Product Type, 2020 to 2035
- Table 13: North America Value (USD Mn) Forecast by Material Type, 2020 to 2035
- Table 14: North America Volume (Units) Forecast by Material Type, 2020 to 2035
- Table 15: North America Value (USD Mn) Forecast by Target Group, 2020 to 2035
- Table 16: North America Volume (Units) Forecast by Target Group, 2020 to 2035
- Table 17: Latin America Value (USD Mn) Forecast by Country, 2020 to 2035
- Table 18: Latin America Volume (Units) Forecast by Country, 2020 to 2035
- Table 19: Latin America Value (USD Mn) Forecast by Product Type, 2020 to 2035
- Table 20: Latin America Volume (Units) Forecast by Product Type, 2020 to 2035
- Table 21: Latin America Value (USD Mn) Forecast by Material Type, 2020 to 2035
- Table 22: Latin America Volume (Units) Forecast by Material Type, 2020 to 2035
- Table 23: Latin America Value (USD Mn) Forecast by Target Group, 2020 to 2035
- Table 24: Latin America Volume (Units) Forecast by Target Group, 2020 to 2035
- Table 25: Europe Value (USD Mn) Forecast by Country, 2020 to 2035
- Table 26: Europe Volume (Units) Forecast by Country, 2020 to 2035
- Table 27: Europe Value (USD Mn) Forecast by Product Type, 2020 to 2035
- Table 28: Europe Volume (Units) Forecast by Product Type, 2020 to 2035
- Table 29: Europe Value (USD Mn) Forecast by Material Type, 2020 to 2035
- Table 30: Europe Volume (Units) Forecast by Material Type, 2020 to 2035
- Table 31: Europe Value (USD Mn) Forecast by Target Group, 2020 to 2035
- Table 32: Europe Volume (Units) Forecast by Target Group, 2020 to 2035
- Table 33: East Asia Value (USD Mn) Forecast by Country, 2020 to 2035
- Table 34: East Asia Volume (Units) Forecast by Country, 2020 to 2035
- Table 35: East Asia Value (USD Mn) Forecast by Product Type, 2020 to 2035
- Table 36: East Asia Volume (Units) Forecast by Product Type, 2020 to 2035
- Table 37: East Asia Value (USD Mn) Forecast by Material Type, 2020 to 2035
- Table 38: East Asia Volume (Units) Forecast by Material Type, 2020 to 2035
- Table 39: East Asia Value (USD Mn) Forecast by Target Group, 2020 to 2035
- Table 40: East Asia Volume (Units) Forecast by Target Group, 2020 to 2035
- Table 41: South Asia Value (USD Mn) Forecast by Country, 2020 to 2035
- Table 42: South Asia Volume (Units) Forecast by Country, 2020 to 2035
- Table 43: South Asia Value (USD Mn) Forecast by Product Type, 2020 to 2035
- Table 44: South Asia Volume (Units) Forecast by Product Type, 2020 to 2035
- Table 45: South Asia Value (USD Mn) Forecast by Material Type, 2020 to 2035
- Table 46: South Asia Volume (Units) Forecast by Material Type, 2020 to 2035
- Table 47: South Asia Value (USD Mn) Forecast by Target Group, 2020 to 2035
- Table 48: South Asia Volume (Units) Forecast by Target Group, 2020 to 2035
- Table 49: Oceania Value (USD Mn) Forecast by Country, 2020 to 2035
- Table 50: Oceania Volume (Units) Forecast by Country, 2020 to 2035
- Table 51: Oceania Value (USD Mn) Forecast by Product Type, 2020 to 2035
- Table 52: Oceania Volume (Units) Forecast by Product Type, 2020 to 2035
- Table 53: Oceania Value (USD Mn) Forecast by Material Type, 2020 to 2035
- Table 54: Oceania Volume (Units) Forecast by Material Type, 2020 to 2035
- Table 55: Oceania Value (USD Mn) Forecast by Target Group, 2020 to 2035
- Table 56: Oceania Volume (Units) Forecast by Target Group, 2020 to 2035
- Table 57: MEA Value (USD Mn) Forecast by Country, 2020 to 2035
- Table 58: MEA Volume (Units) Forecast by Country, 2020 to 2035
- Table 59: MEA Value (USD Mn) Forecast by Product Type, 2020 to 2035
- Table 60: MEA Volume (Units) Forecast by Product Type, 2020 to 2035
- Table 61: MEA Value (USD Mn) Forecast by Material Type, 2020 to 2035
- Table 62: MEA Volume (Units) Forecast by Material Type, 2020 to 2035
- Table 63: MEA Value (USD Mn) Forecast by Target Group, 2020 to 2035
- Table 64: MEA Volume (Units) Forecast by Target Group, 2020 to 2035
List Of Figures
- Figure 1: Global Volume (Units) Forecast 2020 to 2035
- Figure 2: Global Pricing Analysis
- Figure 3: Global Value (USD Mn) Forecast 2020 to 2035
- Figure 4: Global Value Share and BPS Analysis by Product Type, 2025 and 2035
- Figure 5: Global Y-o-Y Growth Comparison by Product Type, 2025 to 2035
- Figure 6: Global Attractiveness Analysis by Product Type
- Figure 7: Global Value Share and BPS Analysis by Material Type, 2025 and 2035
- Figure 8: Global Y-o-Y Growth Comparison by Material Type, 2025 to 2035
- Figure 9: Global Attractiveness Analysis by Material Type
- Figure 10: Global Value Share and BPS Analysis by Target Group, 2025 and 2035
- Figure 11: Global Y-o-Y Growth Comparison by Target Group, 2025 to 2035
- Figure 12: Global Attractiveness Analysis by Target Group
- Figure 13: Global Value (USD Mn) Share and BPS Analysis by Region, 2025 and 2035
- Figure 14: Global Y-o-Y Growth Comparison by Region, 2025 to 2035
- Figure 15: Global Attractiveness Analysis by Region
- Figure 16: North America Incremental $ Opportunity, 2025 to 2035
- Figure 17: Latin America Incremental $ Opportunity, 2025 to 2035
- Figure 18: Europe Incremental $ Opportunity, 2025 to 2035
- Figure 19: East Asia Incremental $ Opportunity, 2025 to 2035
- Figure 20: South Asia Incremental $ Opportunity, 2025 to 2035
- Figure 21: Oceania Incremental $ Opportunity, 2025 to 2035
- Figure 22: MEA Incremental $ Opportunity, 2025 to 2035
- Figure 23: North America Value Share and BPS Analysis by Country, 2025 and 2035
- Figure 24: North America Value Share and BPS Analysis by Product Type, 2025 and 2035
- Figure 25: North America Y-o-Y Growth Comparison by Product Type, 2025 to 2035
- Figure 26: North America Attractiveness Analysis by Product Type
- Figure 27: North America Value Share and BPS Analysis by Material Type, 2025 and 2035
- Figure 28: North America Y-o-Y Growth Comparison by Material Type, 2025 to 2035
- Figure 29: North America Attractiveness Analysis by Material Type
- Figure 30: North America Value Share and BPS Analysis by Target Group, 2025 and 2035
- Figure 31: North America Y-o-Y Growth Comparison by Target Group, 2025 to 2035
- Figure 32: North America Attractiveness Analysis by Target Group
- Figure 33: Latin America Value Share and BPS Analysis by Country, 2025 and 2035
- Figure 34: Latin America Value Share and BPS Analysis by Product Type, 2025 and 2035
- Figure 35: Latin America Y-o-Y Growth Comparison by Product Type, 2025 to 2035
- Figure 36: Latin America Attractiveness Analysis by Product Type
- Figure 37: Latin America Value Share and BPS Analysis by Material Type, 2025 and 2035
- Figure 38: Latin America Y-o-Y Growth Comparison by Material Type, 2025 to 2035
- Figure 39: Latin America Attractiveness Analysis by Material Type
- Figure 40: Latin America Value Share and BPS Analysis by Target Group, 2025 and 2035
- Figure 41: Latin America Y-o-Y Growth Comparison by Target Group, 2025 to 2035
- Figure 42: Latin America Attractiveness Analysis by Target Group
- Figure 43: Europe Value Share and BPS Analysis by Country, 2025 and 2035
- Figure 44: Europe Value Share and BPS Analysis by Product Type, 2025 and 2035
- Figure 45: Europe Y-o-Y Growth Comparison by Product Type, 2025 to 2035
- Figure 46: Europe Attractiveness Analysis by Product Type
- Figure 47: Europe Value Share and BPS Analysis by Material Type, 2025 and 2035
- Figure 48: Europe Y-o-Y Growth Comparison by Material Type, 2025 to 2035
- Figure 49: Europe Attractiveness Analysis by Material Type
- Figure 50: Europe Value Share and BPS Analysis by Target Group, 2025 and 2035
- Figure 51: Europe Y-o-Y Growth Comparison by Target Group, 2025 to 2035
- Figure 52: Europe Attractiveness Analysis by Target Group
- Figure 53: East Asia Value Share and BPS Analysis by Country, 2025 and 2035
- Figure 54: East Asia Value Share and BPS Analysis by Product Type, 2025 and 2035
- Figure 55: East Asia Y-o-Y Growth Comparison by Product Type, 2025 to 2035
- Figure 56: East Asia Attractiveness Analysis by Product Type
- Figure 57: East Asia Value Share and BPS Analysis by Material Type, 2025 and 2035
- Figure 58: East Asia Y-o-Y Growth Comparison by Material Type, 2025 to 2035
- Figure 59: East Asia Attractiveness Analysis by Material Type
- Figure 60: East Asia Value Share and BPS Analysis by Target Group, 2025 and 2035
- Figure 61: East Asia Y-o-Y Growth Comparison by Target Group, 2025 to 2035
- Figure 62: East Asia Attractiveness Analysis by Target Group
- Figure 63: South Asia Value Share and BPS Analysis by Country, 2025 and 2035
- Figure 64: South Asia Value Share and BPS Analysis by Product Type, 2025 and 2035
- Figure 65: South Asia Y-o-Y Growth Comparison by Product Type, 2025 to 2035
- Figure 66: South Asia Attractiveness Analysis by Product Type
- Figure 67: South Asia Value Share and BPS Analysis by Material Type, 2025 and 2035
- Figure 68: South Asia Y-o-Y Growth Comparison by Material Type, 2025 to 2035
- Figure 69: South Asia Attractiveness Analysis by Material Type
- Figure 70: South Asia Value Share and BPS Analysis by Target Group, 2025 and 2035
- Figure 71: South Asia Y-o-Y Growth Comparison by Target Group, 2025 to 2035
- Figure 72: South Asia Attractiveness Analysis by Target Group
- Figure 73: Oceania Value Share and BPS Analysis by Country, 2025 and 2035
- Figure 74: Oceania Value Share and BPS Analysis by Product Type, 2025 and 2035
- Figure 75: Oceania Y-o-Y Growth Comparison by Product Type, 2025 to 2035
- Figure 76: Oceania Attractiveness Analysis by Product Type
- Figure 77: Oceania Value Share and BPS Analysis by Material Type, 2025 and 2035
- Figure 78: Oceania Y-o-Y Growth Comparison by Material Type, 2025 to 2035
- Figure 79: Oceania Attractiveness Analysis by Material Type
- Figure 80: Oceania Value Share and BPS Analysis by Target Group, 2025 and 2035
- Figure 81: Oceania Y-o-Y Growth Comparison by Target Group, 2025 to 2035
- Figure 82: Oceania Attractiveness Analysis by Target Group
- Figure 83: MEA Value Share and BPS Analysis by Country, 2025 and 2035
- Figure 84: MEA Value Share and BPS Analysis by Product Type, 2025 and 2035
- Figure 85: MEA Y-o-Y Growth Comparison by Product Type, 2025 to 2035
- Figure 86: MEA Attractiveness Analysis by Product Type
- Figure 87: MEA Value Share and BPS Analysis by Material Type, 2025 and 2035
- Figure 88: MEA Y-o-Y Growth Comparison by Material Type, 2025 to 2035
- Figure 89: MEA Attractiveness Analysis by Material Type
- Figure 90: MEA Value Share and BPS Analysis by Target Group, 2025 and 2035
- Figure 91: MEA Y-o-Y Growth Comparison by Target Group, 2025 to 2035
- Figure 92: MEA Attractiveness Analysis by Target Group
- Figure 93: Global - Tier Structure Analysis
- Figure 94: Global - Company Share Analysis
- FAQs -
What was the global Mannequin market size reported by Fact.MR for 2025?
The Global Mannequin market was valued at USD 15,650 Million in 2025.
Who are the major players operating in the mannequin market?
Prominent players in the market are Hans Boodt Mannequins, Genesis Display GmbH, Proportion London Ltd., Wuxi Elegant Mannequin Co. Ltd., Bonavery Mannequins, Window France, and Noa Brands Europe S.L.
What is the Estimated Valuation of the mannequin market in 2035?
The market is expected to reach a valuation of USD 29,377 Million in 2035.
What value CAGR did the Mannequin market exhibit over the last five years?
The historic growth rate of the Mannequin market was 4.6% from 2020 to 2024.