


- Base Value(2025): 486.4 Mn
- Estimated Value(2026): 520.3 Mn
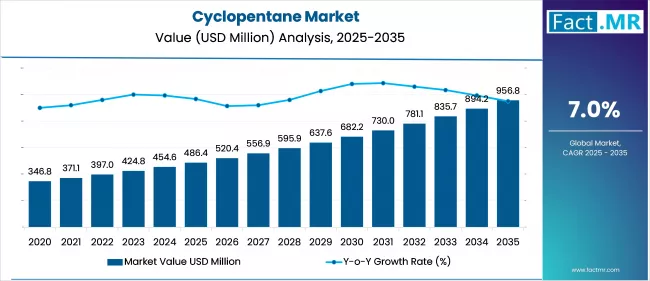
- Forecast Value (2035): 956.8 Mn
- CAGR (2026 - 2035): 7.0%
Cyclopentane Market Outlook (2025 to 2035)
The global cyclopentane market is forecast to reach USD 956.8 million by 2035, up from USD 486.4 million in 2025. During the forecast period, the industry is projected to register at a CAGR of 7.0%. Stringent environmental regulations are driving the shift toward cyclopentane as an eco-friendly alternative to high-GWP blowing agents. The rising demand for energy-efficient refrigeration and insulation is driving the use of cyclopentane in the appliances and construction sectors.
What are the Drivers of Cyclopentane Market?
Stringent environmental regulations and the global push toward sustainability are primarily driving the growth of the global cyclopentane market. Governments and international bodies, through frameworks like the Montreal Protocol and the Kigali Amendment, are enforcing the gradual phase-out of ozone-depleting substances such as hydrochlorofluorocarbons (HCFCs) and high-global warming potential (GWP) hydrofluorocarbons (HFCs).
In this context, cyclopentane has emerged as a highly viable alternative due to its zero ozone depletion potential (ODP) and low GWP. As regulations tighten across North America, Europe, and parts of Asia Pacific, cyclopentane is increasingly adopted in foam-blowing applications, particularly in refrigeration and building insulation.
Another major driver is the rising demand from the refrigeration and cold-chain logistics sectors. Cyclopentane is widely used as a blowing agent in the production of rigid polyurethane foams, which are critical for thermal insulation in refrigerators and freezers. The rapid expansion of cold storage infrastructure, fueled by growth in e-commerce, pharmaceuticals, and the food and beverage industries, is further boosting demand. Emerging economies, such as India and China, are investing heavily in cold-chain development, creating significant opportunities for cyclopentane-based insulation materials.
The construction industry's growing emphasis on energy-efficient buildings is also contributing to the market's expansion. Green building initiatives and stricter energy codes are prompting increased use of high-performance insulation materials, where cyclopentane-blown foams are favored for their superior thermal conductivity and environmental safety. Urbanization and large-scale infrastructure projects in developing regions are accelerating this trend, making the construction segment a key end-use market for cyclopentane.
Advancements in cyclopentane manufacturing and safety technologies are supporting its broader industrial adoption. Improvements in refining processes, storage systems, and fire safety measures are mitigating the flammability concerns traditionally associated with cyclopentane. The overall shift toward green chemicals, driven by both regulatory compliance and consumer preference, positions cyclopentane as a strategic material in the global move toward sustainable development.
What are the Regional Trends of Cyclopentane Market?
Asia Pacific holds the largest share of the global cyclopentane market and is projected to witness the fastest growth rate over the forecast period. Rapid urbanization, booming construction activity, and increasing demand for energy-efficient appliances in countries such as China, India, South Korea, and Indonesia are key drivers of growth. These nations are also expanding their cold storage infrastructure for pharmaceuticals and food & beverages, pushing demand for cyclopentane-blown insulation foams.
North America, led by the United States and Canada, shows steady growth in the cyclopentane market. Environmental initiatives by the U.S. EPA, coupled with the adoption of the American Innovation and Manufacturing (AIM) Act, are encouraging companies to transition from high-GWP foaming agents. The region benefits from strong demand in commercial refrigeration, residential insulation, and appliance manufacturing.
Europe is a mature but highly influential market due to its strict environmental legislation. The region has been at the forefront of phasing out HCFCs and HFCs under the EU F-Gas Regulation, promoting the use of low-global-warming-potential (GWP) substances, such as cyclopentane. Countries such as Germany, France, and the Nordic nations have implemented aggressive climate goals, which have spurred the use of cyclopentane in refrigeration, insulation, and construction sectors. The European market is characterized by early technology adoption, strong sustainability mandates, and leading OEMs shifting toward green alternatives.
The Middle East is witnessing a slow but growing interest in cyclopentane, driven by the expanding construction sector and increasing demand for energy-efficient cooling systems, particularly in Gulf countries with extreme climatic conditions.
What are the Challenges and Restraining Factors of Cyclopentane Market?
One of the most prominent issues is the high flammability of cyclopentane. As a hydrocarbon, cyclopentane is classified as highly volatile and poses serious fire and explosion hazards during production, transportation, and application, especially in confined industrial settings. This makes it essential to invest in specialized storage, ventilation, and fire-safety systems, which increases overall operational and capital costs. For many small or mid-sized manufacturers, especially in developing countries, these costs can act as a deterrent to adoption.
Another challenge lies in the complexity of regulations and compliance requirements. While global environmental policies support the shift toward low-global warming potential (GWP) substances, manufacturers must still navigate a range of safety, labeling, and transportation regulations across different regions. Compliance with organizations like OSHA (U.S.), REACH (Europe), and other national agencies demands robust documentation and infrastructure, which adds to the regulatory burden, particularly for companies without dedicated environmental health and safety (EHS) teams.
Infrastructure limitations and technical barriers can slow market growth. Cyclopentane requires controlled environments for safe handling, which are not always available in regions with underdeveloped industrial ecosystems.
Existing production facilities often require upgrades to accommodate hydrocarbon-based blowing agents, resulting in high upfront investment costs. This is especially true in emerging markets where alternative materials may already be in use and retrofitting can be costly and time-consuming.
The cyclopentane market faces growing competition from advanced, non-flammable blowing agents, particularly hydrofluoroolefins (HFOs). These next-generation substances offer excellent environmental performance with minimal safety risks, albeit at a higher price point.
However, for industries prioritizing safety and ease of use, such as healthcare or consumer appliances, HFOs present an attractive alternative. Combined with the volatility in raw material prices, which affects the cost structure of cyclopentane due to its derivation from crude oil, these factors can collectively restrict the market’s long-term scalability if not addressed through innovation and investment.
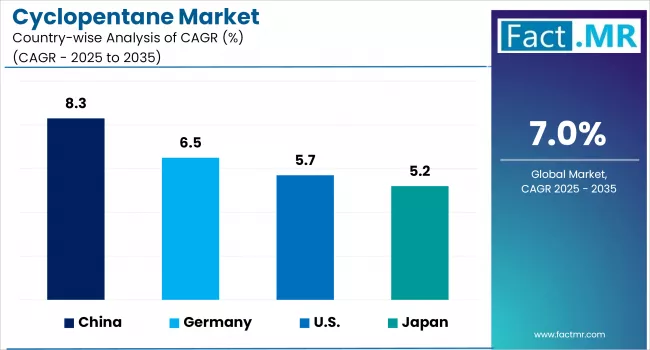
Country-Wise Outlook
United States Cyclopentane Market sees Growth Driven by Stringent Environmental Regulations
The growth of the cyclopentane market in the U.S. is driven by stringent environmental regulations and growing demand for sustainable refrigerants and insulation materials. The U.S. market is benefiting from regulatory initiatives like the Montreal Protocol and the American Innovation and Manufacturing (AIM) Act, which aim to reduce the use of ozone-depleting substances (ODS) and high-GWP blowing agents. These policies have led to the phase-out of hydrochlorofluorocarbons (HCFCs) and hydrofluorocarbons (HFCs), positioning cyclopentane as a viable, eco-friendly alternative.
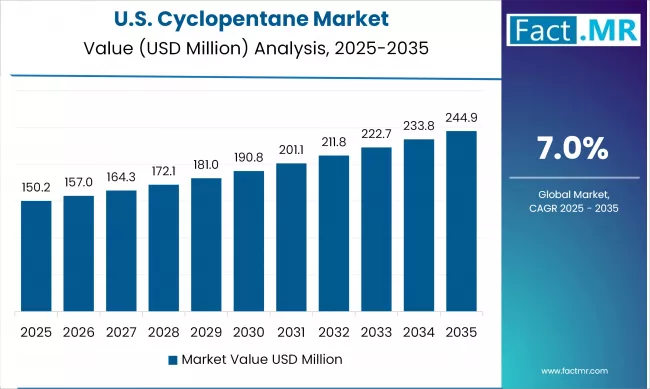
One of the key applications propelling market growth is the use of cyclopentane as a blowing agent in polyurethane foam for insulation and refrigeration. As demand for energy-efficient home appliances, commercial refrigeration systems, and cold-chain logistics continues to grow, cyclopentane's thermal insulation properties make it an attractive choice. The food and beverage sector, along with pharmaceuticals, have expanded their cold storage and logistics infrastructure, further fueling cyclopentane consumption.
Moreover, the U.S. construction industry’s increasing emphasis on green building practices and energy conservation is driving the use of cyclopentane-based insulation panels. Builders and manufacturers are adopting low-emission materials to meet LEED certification requirements and energy codes, which align with cyclopentane’s low Global Warming Potential (GWP) and zero Ozone Depletion Potential (ODP). These trends are particularly prominent in states like California and New York, where energy regulations are among the most rigorous in the country.
Investment in production capacity and technological upgrades are playing a vital role in supporting market growth. U.S.-based manufacturers are enhancing their production processes and investing in fire-safe handling and storage solutions to mitigate the risks associated with cyclopentane’s flammability. As awareness of sustainability continues to rise across industries, and infrastructure adapts to safety demands, the U.S. cyclopentane market is expected to maintain a stable and upward growth trajectory in the coming years.
China witnesses Rapid Market Growth Backed by Expansion of Cold-Chain Logistics, particularly in the Pharmaceutical and Food & Beverage Industries
China’s cyclopentane market is moving at a notably brisk pace, primarily fueled by surging consumer demand and robust infrastructure expansion. As disposable incomes rise, more households are purchasing refrigerators and freezers, particularly with the rapid growth in China’s restaurant and hospitality sectors, leading to increased use of cyclopentane as a foam-blowing agent.
Further amplifying this trend is the expansion of cold-chain logistics, particularly in the pharmaceutical and food & beverage industries. The development of storage and transportation facilities that require high-performance thermal insulation has created a sustained and growing market for cyclopentane-blown polyurethane foams. China’s cyclopentane market is experiencing rapid and sustained growth, driven by the mass adoption of cyclopentane in refrigerated appliances and cold-chain infrastructure.
Japan sees Foam-Blowing Agent in Refrigeration Appliances Fuels Demand for Cyclopentane
Japan’s cyclopentane market is expanding at a modest but consistent pace. This growth is being fueled by demand for cyclopentane as a foam-blowing agent in refrigeration appliances.
Beyond household appliances, cyclopentane is increasingly utilized in the commercial refrigeration, cold storage, and pharmaceutical industries within Japan. These sectors demand high-performance thermal insulation, especially to meet stringent national safety and efficiency standards.
Japan’s leadership in chemical manufacturing is driving the adoption of cyclopentane. Companies like Maruzen Petrochemical are among the regional producers building capacity and optimizing supply chains to serve domestic appliance and construction needs. Along with Japan’s environmental commitments and energy efficiency standards, the market outlook is stable, with steady investment and technological upgrades continuing to drive moderate growth throughout the forecast period.
Category-wise Analysis
Foam-Blowing Agent to Exhibit Leading by Product Type
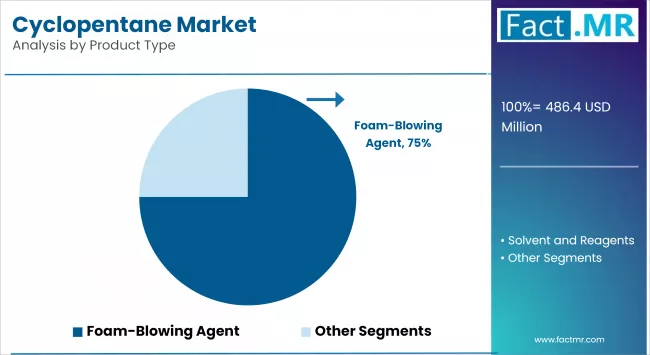
The foam-blowing agent segment currently dominates the cyclopentane market. This dominance is primarily attributed to cyclopentane’s widespread use as a blowing agent in the production of rigid polyurethane foams, which are essential for thermal insulation in refrigeration appliances and building panels. Its zero Ozone Depletion Potential (ODP) and low Global Warming Potential (GWP) make it a preferred substitute for HCFCs and HFCs in compliance with international environmental protocols. The increasing demand for energy-efficient refrigeration units in residential, commercial, and industrial settings, as well as the growing number of green building initiatives globally, are key drivers supporting this segment’s growth.
The solvent and reagents segment is projected to be the fastest-growing during the forecast period. This growth is driven by the rising demand for cyclopentane as a low-toxicity, high-purity solvent in chemical synthesis and industrial applications, including pharmaceuticals and electronics. Its properties as a non-polar, inert reagent make it valuable for specialized processes where environmental safety and control of reactivity are crucial. The segment is further driven by expanding pharmaceutical R&D, semiconductor production, and industrial cleaning applications, particularly in developed markets such as Japan and the U.S., where demand for high-performance solvents is increasing.
>98% to Exhibit Leading by Grade
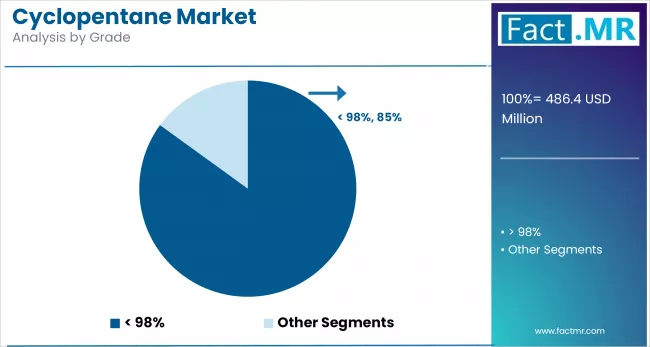
The segment with a purity of greater than 98% dominates the cyclopentane market, driven by its critical role in high-performance and eco-sensitive applications. It is extensively used in energy-efficient refrigeration systems, pharmaceutical manufacturing, and electronics, where low residue and high consistency are essential. This grade aligns with global sustainability initiatives as a low-GWP (Global Warming Potential) blowing agent, making it a preferred alternative to HCFCs and HFCs. Stringent environmental standards in developed countries are accelerating their adoption.
Cyclopentane with purity <98% is commonly used in cost-sensitive applications such as residential refrigerator insulation, rigid foam production, and select industrial solvents. It offers a balance between performance and affordability, making it ideal for large-scale commercial use in emerging economies. This grade meets functional standards without incurring the cost of high purification. However, due to evolving environmental regulations and stricter purity standards, its share is gradually declining.
Insulating Construction Material to Exhibit Leading by Application
The residential refrigerators segment dominates the cyclopentane market by application. These are widely used as a blowing agent in rigid polyurethane foam insulation for refrigerators due to their superior thermal insulation properties and environmentally friendly profile. The increasing global demand for energy-efficient and eco-friendly appliances, particularly in emerging markets such as China, India, and Southeast Asia, has significantly driven the use of cyclopentane in this segment. Additionally, regulatory mandates phasing out HCFCs and HFCs in domestic appliances have further accelerated the adoption of cyclopentane in refrigerator manufacturing worldwide.
The insulating construction material segment is expected to grow at the fastest rate during the forecast period. This growth is primarily driven by the rising focus on green building standards, energy conservation, and sustainable construction practices across both developed and developing countries. Cyclopentane-blown polyurethane foam is increasingly being used in walls, roofing panels, and floor insulation systems for residential and commercial buildings. Government incentives and regulations promoting low-emission building materials, coupled with growing urbanization and infrastructure development, particularly in Asia Pacific and the Middle East, are key factors accelerating the demand in this segment.
Competitive Analysis
The global cyclopentane market is becoming increasingly competitive, with a mix of established multinational chemical companies and a growing number of regional players. Companies are leveraging their technological expertise, production scale, and regulatory compliance to cater to the rising demand for environmentally friendly blowing agents and solvents, particularly in the refrigeration and construction sectors.
A major focus among key players is on capacity expansion and product innovation. For example, Haltermann Carless recently expanded its cyclopentane production capacity by 70% at its Speyer facility in Germany, aiming to meet growing demand in foam insulation applications. Similarly, Asian producers, particularly in China and Japan, are investing in refining and specialty chemical capabilities to support regional appliance and electronics manufacturing. These strategic moves are essential in meeting the strict environmental standards that drive the global shift from ozone-depleting and high-GWP substances to safer alternatives like cyclopentane.
Regional dynamics also play an important role in shaping competition. While North America and Europe are home to some of the most advanced producers with a strong focus on quality and regulatory compliance, Asia Pacific, especially China and India, is emerging as a key production and consumption hub. Local players in these regions are gaining market share by offering cost-effective alternatives and catering to booming domestic demand. However, the market remains challenging for new entrants due to high initial investment requirements, concerns about flammability, and complex regulatory landscapes. As a result, established firms with integrated operations and global reach continue to dominate the competitive environment.
Key players in the cyclopentane industry include Chevron Phillips Chemical Company LLC, Dymatic Chemicals, Inc., Beijing Eastern Acrylic Chemical Technology Co., Ltd, LG Chem, Ltd., Yeochun NCC Co., Ltd., Trecora Resources, and other players.
Recent Development
- In January 2024, European appliance giants launched a joint recycling initiative to recover and purify cyclopentane from discarded refrigerators, supporting circular economy goals.
Segmentation of Cyclopentane Market
-
By Product Type :
- Foam-Blowing Agent
- Solvent and Reagents
-
By Grade :
- <98%
- >98%
-
By Application :
- Residential Refrigerators
- Insulated Containers and Sippers
- Insulating Construction Material
- Analytical and Scientific Application
- Others
-
By Region :
- North America
- Latin America
- Western Europe
- Eastern Europe
- East Asia
- South Asia & Pacific
- Middle East & Africa
- Frequently Asked Questions -
What is the Global Cyclopentane Market size in 2025?
The cyclopentane market is valued at USD 486.4 million in 2025.
Who are the Major Players Operating in the Cyclopentane Market?
Prominent players in the market include Chevron Phillips Chemical Company LLC, Dymatic Chemicals, Inc., Beijing Eastern Acrylic Chemical Technology Co., Ltd, LG Chem, Ltd., and Yeochun NCC Co. Ltd.
What is the Estimated Valuation of the Cyclopentane Market by 2035?
The market is expected to reach a valuation of USD 956.8 million by 2035.
At what CAGR is the Cyclopentane Market slated to grow during the study period?
The growth rate of the cyclopentane market is 7.0% from 2025 to 2035.