


- Base Value(2025): 4.3 Bn
- Estimated Value(2025): 4.3 Bn
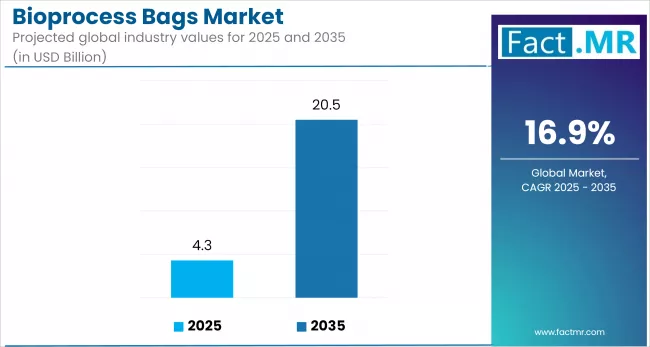
- Forecast Value (2035): 20.5 Bn
- CAGR (2025 - 2035): 16.90%
Bioprocess Bags Market Outlook (2025 to 2035)
The global bioprocess bags market is projected to grow from USD 4.3 billion in 2025 to USD 20.5 billion by 2035, with an annual growth rate of 16.90%, driven by the increased adoption of single-use technologies in biopharmaceutical manufacturing, rising biologics production, and the shift toward flexible and modular facilities.
Demand is further supported by CDMO expansion and the growing focus on cost-efficient, contamination-free processing. North America leads in market share, while the Asia Pacific region sees the fastest growth, driven by rapid biotech investment.
What are the Drivers of the Bioprocess Bags Market?
The bioprocess bags market is expanding rapidly, driven by the surge in biologics and cell and gene therapies, which now represent a growing share of global drug pipelines. As these therapies demand sterile, scalable solutions, single-use bioprocess bags have become a critical component in modern manufacturing.
The shift from traditional stainless-steel systems to disposable technologies is accelerating as manufacturers seek to reduce cleaning validation, cut capital costs, and increase operational agility. This trend is further supported by the rise of contract development and manufacturing organizations (CDMOs), which rely on flexible, modular systems to meet the diverse needs of their clients.
Personalized medicine is also fueling demand, as smaller, high-value batches require closed, adaptable systems. Meanwhile, post-COVID investment in localized biomanufacturing, particularly across the Asia-Pacific and Latin America regions, is driving adoption in emerging markets.
Cost and efficiency advantages, along with the regulatory acceptance of single-use systems by agencies such as the FDA and EMA, are driving market growth. In parallel, sustainability efforts, including the use of recyclable materials and closed-loop programs from key players such as Sartorius and Thermo Fisher, are helping to align the industry with environmental goals.
What are the Regional Trends of the Bioprocess Bags Market?
North America remains the leading market, driven by a strong biopharmaceutical industry, established regulatory frameworks, and widespread adoption of single-use technologies. The USA holds a major share due to consistent investment in biologics R&D, a high concentration of CDMOs, and support from the FDA for disposable manufacturing platforms. The region’s focus on advanced therapies and process intensification continues to reinforce demand.
Europe follows closely, with Germany, Switzerland, and the UK leading adoption. The region’s emphasis on GMP compliance, automation, and sustainable bioproduction methods supports market growth. EU-backed initiatives for biologics and biosimilars, along with growing investment in vaccine and gene therapy manufacturing, are accelerating the shift to single-use systems across manufacturing facilities.
The Asia Pacific is the fastest-growing region, driven by the expansion of biotech hubs in China, India, South Korea, and Singapore. Governments are supporting local biomanufacturing through subsidies and policy reforms. For instance, China’s “Made in China 2025” and India’s “Pharma Vision 2020” programs have increased domestic production capabilities, encouraging the adoption of cost-effective, scalable systems like bioprocess bags. Rising clinical trial activity and CDMO presence also fuel demand.
Latin America is seeing steady growth in Brazil and Mexico, where public-private partnerships and regulatory modernization are improving biologics manufacturing capabilities. Demand is rising for flexible, lower-cost systems in response to limited infrastructure and budget constraints.
The Middle East & Africa are emerging markets, with countries like Saudi Arabia and the UAE investing in local pharmaceutical production as part of broader healthcare infrastructure goals (e.g., Vision 2030). Although adoption is still in its early stages, regional demand is expected to rise as manufacturers seek to reduce their import dependency and build local capacity.
These regional dynamics reflect a global shift toward flexible, scalable, and compliant manufacturing solutions, positioning bioprocess bags as a central component of modern bioproduction strategies.
What are the Challenges and Restraining Factors in the Bioprocess Bags Market?
The bioprocess bags market faces challenges that could restrain growth. Supply chain disruptions and reliance on specialty polymers have led to material shortages and cost volatility. Environmental concerns surrounding single-use plastic waste are drawing increased scrutiny, particularly in regions with stringent sustainability goals.
Technical risks, including leachable and extractable, require extensive validation, adding to regulatory and quality burdens. High upfront qualification costs, limited reusability, and integration issues with legacy systems further impact scalability. Additionally, inconsistent regulatory standards across regions complicate global deployment in emerging markets.
Country-Wise Outlook
USA Bioprocess Bags Market Strengthened by Biologics Demand and Innovation
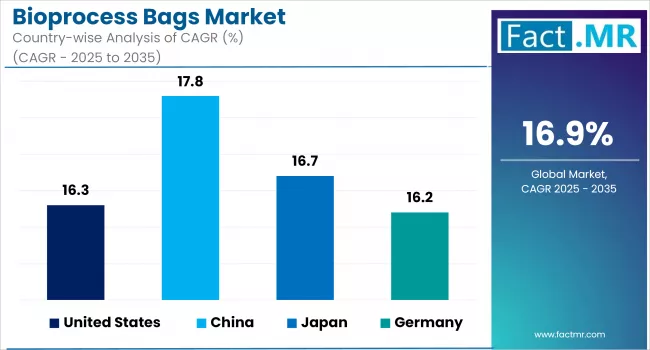
The United States bioprocess bags market is experiencing sustained growth, driven by the country’s strong biopharmaceutical infrastructure and rapid adoption of single-use technologies. Growing demand for biologics, including monoclonal antibodies, vaccines, and cell and gene therapies, has accelerated the shift toward flexible, contamination-free manufacturing systems.
This shift is further supported by the increasing use of upstream and downstream disposable systems in both clinical and commercial production. The expansion of CDMOs, investment in modular biomanufacturing facilities, and regulatory support for single-use compliance have created favorable conditions for adoption.
USA-based manufacturers are also investing in material innovation and integrating advanced features like embedded sensors, catering to evolving industry needs. At the same time, rising emphasis on sustainable production practices is prompting efforts to develop recyclable and environmentally responsible bioprocessing solutions.
China Leads Asia Pacific Expansion in Bioprocess Bags
China’s bioprocess bags market is gaining momentum as the country strengthens its position in the global biomanufacturing landscape. Backed by national initiatives like “Made in China 2025,” the government is actively supporting domestic biotech growth, driving demand for single-use technologies. The country is rapidly adopting disposable bioprocess systems in upstream applications such as cell culture and media preparation, while downstream adoption is also accelerating.
Local manufacturers are investing in advanced materials and tailored bag formats to meet diverse production needs across biologics, vaccines, and biosimilars. There is a notable shift toward integrating features like in-bag sensors and improved polymer linings to enhance process control and compliance. China's role in large-scale vaccine production during the COVID-19 pandemic further validated the use of flexible, single-use systems.
Additionally, the country's growing CDMO sector is fueling demand for modular, scalable manufacturing platforms. With a cost-competitive production base and expanding export capability, China is positioning itself as a regional supplier for bioprocessing solutions across the broader Asia Pacific market.
Japan Emerges as a Growing Hub for Bioprocess Bags
Japan is steadily advancing its role in the bioprocess bags sector, driven by efforts to strengthen domestic biomanufacturing and reduce reliance on imports. The country’s pharmaceutical and biopharmaceutical industries are actively adopting single-use technologies in upstream processes such as media preparation and cell cultivation. There is also growing interest in downstream applications, including purification and fluid handling.
This shift is supported by a strong CDMO presence and government-led initiatives to boost biotech innovation and local production capacity. Japanese manufacturers are responding by offering advanced bag designs, integrating features like real-time monitoring, improved sterility, and greater material compatibility to meet strict quality and regulatory standards.
At the same time, Japan faces certain operational challenges, including dependency on imported components and rigorous validation requirements. Smaller players are cautious due to concerns around extractables and leachables in high-purity environments. However, continued investment in R&D, combined with evolving regulatory clarity, is positioning Japan as a key contributor to bioprocessing supply chains across the Asia Pacific region.
Category-wise Analysis
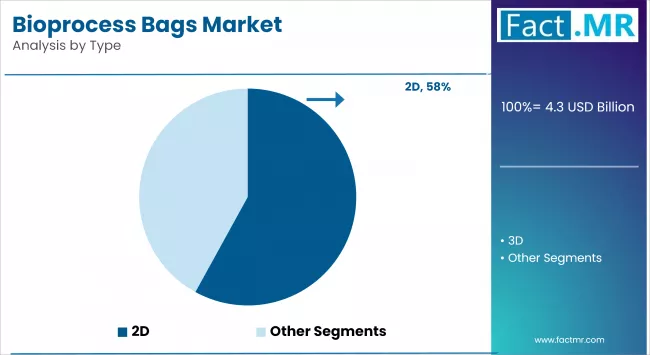
3D Bioprocess Bags to Exhibit Leading Share Among Types
Three-dimensional (3D) bioprocess bags are rapidly securing a dominant share in the bioprocess bags market, driven by their superior capacity and operational efficiency. These flexible, multi-layered systems are increasingly preferred for large-scale upstream fermentation and downstream purification processes in biologics and vaccine production. Manufacturers value 3D bags for their ability to streamline fluid handling, minimize contamination risk, and support integration with automated and single-use bioreactors.
3D configurations are outpacing traditional 2D formats in revenue growth, reflecting a shift toward high-volume dosing systems. They are now widely implemented in large-scale cell culture, buffer storage, and chromatography workflows across CDMOs and top-tier biopharma companies. Suppliers are responding by offering customized bag geometries, varied volume ranges, and adapted connectors to meet evolving production demands.
As biomanufacturing trends lean toward process intensification and closed-system automation, 3D bioprocess bags are expected to reinforce their leadership in system deployment and drive continued investment in single-use infrastructure.
Large Capacity Bags to Exhibit Leading Share Among Capacity
Large-capacity bioprocess bags are becoming the preferred choice in commercial-scale biomanufacturing due to their ability to handle higher volumes in a single batch. These bags are commonly used in applications such as buffer and media storage, cell culture, and downstream processing, where operational efficiency and reduced handling are critical.
Their integration with single-use bioreactors and automated mixing systems has made them essential for facilities aiming to scale production while maintaining process flexibility. Manufacturers are offering advanced configurations with reinforced materials, integrated sensors, and customizable ports to meet the needs of high-volume, GMP-compliant operations.
As biopharmaceutical production continues to shift toward intensified and continuous processes, the demand for large-format, scalable fluid management solutions is expected to remain strong across both in-house and outsourced manufacturing environments.

Buffer & Media Storage to Exhibit Leading Share Among Applications
Buffer and media storage remain the primary applications for bioprocess bags, supported by their widespread use across upstream workflows. These bags provide a sterile, flexible solution for storing large volumes of prepared media and process buffers, which are critical inputs in cell culture, fermentation, and purification stages.
Their ability to maintain fluid integrity, reduce contamination risk, and integrate with closed-system processes makes them essential in both clinical and commercial biomanufacturing environments. Demand is high in facilities adopting single-use platforms, where disposable systems streamline preparation and transfer processes while minimizing cleaning and validation requirements.
Contract manufacturers and large biopharma companies favor these bags for their scalability and adaptability, especially in high-throughput operations. Enhanced formats with improved barrier properties, gamma stability, and sensor integration are further expanding their use in high-volume, cGMP-compliant production lines.
Pharmaceuticals to Exhibit Leading Share Among End-use Industry
Pharmaceutical companies remain the primary end-users of bioprocess bags, driven by the increasing production of biologics, vaccines, and biosimilars. The industry's ongoing transition toward single-use technologies to support flexible, contamination-free manufacturing has positioned these bags as critical components across both R&D and commercial-scale operations.
The widespread use of bioprocess bags in media preparation, buffer storage, cell culture, and downstream processing aligns with the industry's push for greater efficiency and reduced turnaround time. Major drug manufacturers and CDMOs have adopted these systems to accelerate product development, improve facility flexibility, and reduce cleaning and validation burdens associated with traditional stainless-steel systems.
Increased regulatory focus on process integrity and sterility has further supported the shift, prompting pharmaceutical firms to integrate bioprocess bags into closed, automated production environments. With growing investments in biologics pipelines and facility modernization, the pharmaceutical sector continues to drive innovation and demand for volume across the global bioprocess bag market.
North America holds the Leading Share in the Bioprocess Bags Market
North America continues to lead the bioprocess bags market, supported by a well-established biopharmaceutical industry, advanced manufacturing capabilities, and broad adoption of single-use systems. The region benefits from a strong network of CDMOs, biotechs, and pharmaceutical manufacturers that rely on disposable technologies to streamline production and maintain sterile operations.
The United States drives much of this demand, with consistent investment in biologics, vaccines, and cell and gene therapies. Regulatory support from agencies like the FDA has further encouraged the use of single-use systems, promoting faster development timelines and reduced validation burdens.
Ongoing R&D activity, combined with the presence of major OEMs and material suppliers, has positioned North America as an early adopter of next-generation bioprocess bags featuring advanced materials, greater durability, and integrated monitoring capabilities. With continued investment in facility expansion and process innovation, the region is expected to remain a critical market for bioprocessing technologies.
Competitive Analysis
The bioprocess bags market is characterized by strong competition, with leading players such as Corning Incorporated, Charter Medical Ltd., Danaher Corporation, Entegris Inc., Merck, Rim Bio Inc., Saint-Gobain, Sartorius AG, and Thermo Fisher Scientific driving innovation and market expansion. These companies are investing in advanced materials, innovative bag designs, and integrated sensor technologies to meet the evolving demands of biomanufacturing.
Strategic partnerships, capacity expansions, and acquisitions are shaping the competitive landscape. For instance, Sartorius and Thermo Fisher have made significant investments in single-use technology facilities to strengthen their supply capabilities, while companies like Danaher and Merck continue to broaden their product portfolios through targeted acquisitions and R&D initiatives.
The focus remains on improving product performance, regulatory compliance, and sustainability, as end-users increasingly seek customizable, scalable solutions for biologics, vaccines, and cell therapies. This dynamic environment continues to push market players toward differentiation through quality, reliability, and technological advancement.
Recent Development
- In 2023, Sartorius Stedim Biotech finalized a €2.4 billion (USD 2.6 billion) acquisition of Polyplus, gaining viral vector and transfection reagent capabilities vital for cell and gene therapy production.
Segmentation of the Bioprocess Bags Market
-
By Type :
- 2D
- 3D
-
By Capacity :
- Small
- Medium
- Large
- Extra Large
-
By Application :
- Buffer & Media Storage
- Cell Culture
- Cell Separation & Harvest
- Chromatography Feed & Collection
- Ultrafiltration & Diafiltration
- Intermediate & Final Product Hold
- Others
-
By End-use Industry :
- Biotechnology
- Pharmaceuticals
-
By Region :
- North America
- Latin America
- Europe
- East Asia
- South Asia & Oceania
- Middle East & Africa
- Frequently Asked Questions -
What is the global bioprocess bags market size in 2025?
The market is valued at USD 4.3 billion in 2025.
Who are the major players operating in the bioprocess bags market?
Prominent players in the market include Corning Incorporated, Charter Medical Ltd., Danaher Corporation, Entegris Inc., Merck, Rim Bio Inc., and others.
What is the estimated valuation of the bioprocess bags market by 2035?
The market is expected to reach a valuation of USD 20.5 billion by 2035.
At what CAGR is the bioprocess bags market projected to grow during the study period?
The market is slated to grow at 16.90% CAGR during the study period.