- Market Value (2025): USD 521.3 Mn
- Estimated Value (2026): USD 550.0 Mn
- Forecast Value (2036): USD 939.5 Mn
- CAGR (2026-2036): 5.5%
What is the 1,3 Butanediol Market forecast to be worth by 2036?
USD 550.0 million in 2026 to USD 939.5 million by 2036 at a 5.5% CAGR.
- The 1,3 butanediol market reached USD 521.3 million in 2025.
- Demand is projected to increase from USD 550.0 million in 2026 to USD 939.5 million by 2036.
- The market is forecast to record a 5.5% CAGR from 2026 to 2036 as chemical manufacturers and formulation teams standardize industrial solvent inputs.
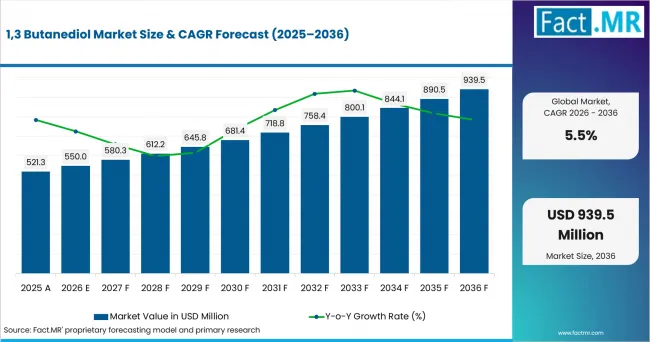
1,3 Butanediol Market Value Analysis | Source: Fact.MR
What are the defining numbers behind 1,3 Butanediol Market growth?
USD 389.5 million absolute opportunity by 2036, led by industrial grade 1,3-butanediol, industrial solvents application and chemical manufacturing companies.
- Demand Drivers in the Market
- Chemical manufacturers need stable liquid intermediates because batch quality depends on predictable purity and handling behavior across solvent systems.
- Cosmetics formulators need humectant and solvent inputs that fit product-registration records and personal-care safety files.
- Polymer and resin producers need compatible solvent grades during scale-up. Adjacent coating additives purchasing follows similar documentation discipline.
- Procurement teams need direct industrial sales routes so plant schedules, drum availability and technical documents stay aligned during qualification cycles.
- Key Segments Analyzed
- By Product: Industrial Grade 1,3-Butanediol is expected to hold 68.40% share in 2026.
- By Application: Industrial Solvents Application is projected to account for 41.90% share in 2026.
- By End Use: Chemical Manufacturing Companies is estimated to represent 56.70% share in 2026.
- By Technology: Chemical Synthesis Technology is anticipated to capture 63.80% share in 2026.
- By Formulation: Liquid Formulations is forecast to hold 52.60% share in 2026.
- By Distribution Channel: Direct Industrial Sales is expected to account for 44.30% share in 2026.
- Analyst Opinion at Fact.MR
- Shambhu Nath Jha, Principal Consultant at Fact.MR, states, "1,3 butanediol is not bought only as a commodity solvent. Plant teams look for documented grade consistency, predictable handling and supply continuity. Vendors are expected to gain preference when they combine product-grade discipline with application support for solvents, cosmetics and chemical intermediates."
- Strategic Implications
- Manufacturers should publish clear purity, water-content and handling documentation for industrial-grade and cosmetic-grade customers.
- Distributors should separate bulk chemical accounts from smaller specialty buyers because each group needs different delivery and documentation support.
- Cosmetic ingredient sellers should connect solvent performance with product-listing records, formulation safety files and batch traceability.
- Bio-based developers should prove cost, purity and scale before treating bio-based platform chemicals demand as a commercial replacement route.
Germany is projected to record 5.5% CAGR through 2036, supported by specialty chemical manufacturing and solvent demand. The USA is expected to post 5.2% CAGR as chemical shipments and cosmetic product listings support industrial and personal-care channels. South Korea is forecast to reach 5.0% CAGR due to export-oriented cosmetics and chemical production. Japan is anticipated to advance at 4.8% CAGR as chemical production planning supports solvent and intermediate use. The UK is estimated to record 4.7% CAGR, while France reaches 4.5% and Italy posts 4.0% as regional chemical price and output trends shape purchasing conditions.
How does the 1,3 Butanediol Market break down by segment?
Industrial Grade 1,3-Butanediol leads Product at 68.40%; Chemical Manufacturing Companies lead End Use at 56.70%.
Which product dominates?
Industrial Grade 1,3-Butanediol holds 68.40% share in 2026.
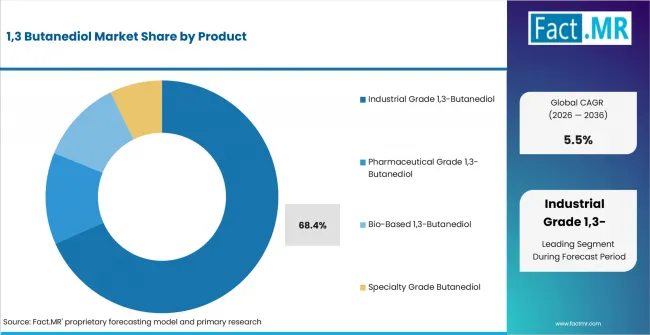
1,3 Butanediol Market Analysis By Product | Source: Fact.MR
Industrial grade material leads because it fits broad solvent and intermediate use. Producers use this grade where purity, safe liquid handling and cost discipline matter more than specialty-positioning claims.
What leads the application segment?
Industrial Solvents Application accounts for 41.90% share in 2026.
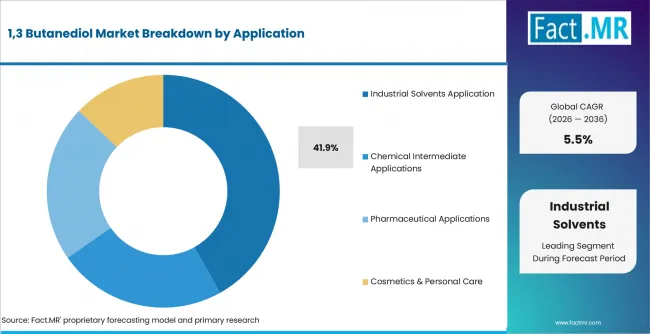
1,3 Butanediol Market Analysis By Application | Source: Fact.MR
Industrial solvent use leads because 1,3 butanediol fits coating, resin and intermediate-processing workflows. Formulation additives purchasing shows the same need for compatibility records.
How does end use shape demand?
Chemical Manufacturing Companies represent 56.70% share in 2026.
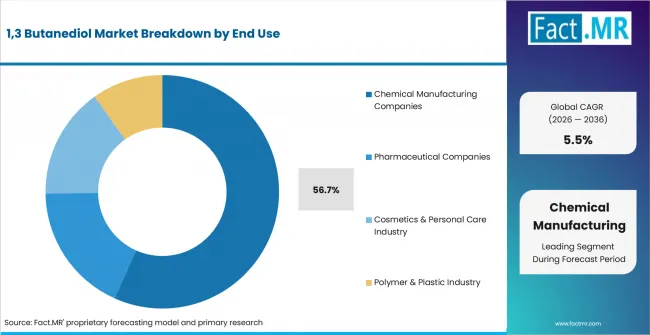
1,3 Butanediol Market Analysis By End Use | Source: Fact.MR
Chemical manufacturing companies hold 56.70% end-use share because they buy recurring volumes and maintain formal supplier-qualification records. Smaller users remain relevant, but their purchasing often moves through distributors.
What supports technology selection?
Chemical Synthesis Technology captures 63.80% share in 2026.
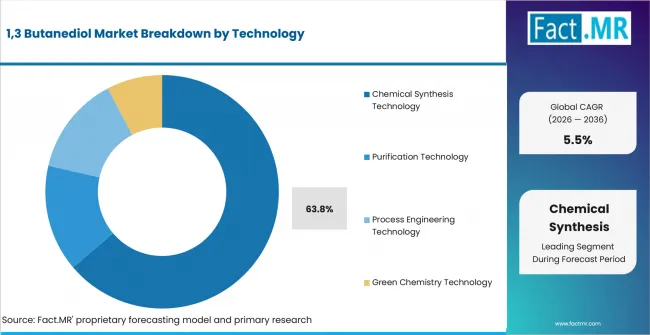
1,3 Butanediol Market Analysis By Technology | Source: Fact.MR
Chemical synthesis technology leads because it gives producers a familiar route for scale, grade control and impurity management. Fermentation remains relevant where low carbon chemicals positioning justifies extra qualification work.
Which formulation format leads?
Liquid Formulations hold 52.60% share in 2026.
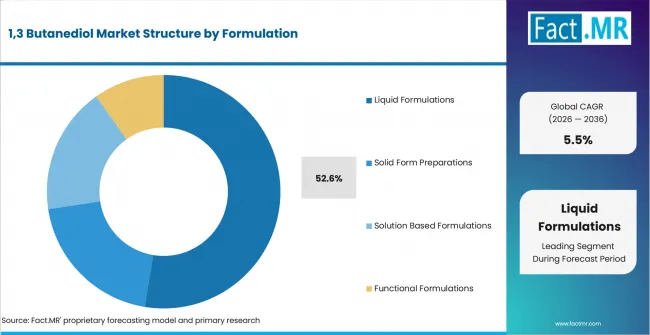
1,3 Butanediol Market Analysis By Formulation | Source: Fact.MR
Liquid formulations lead because 1,3 butanediol is usually handled as a pumpable input. Hydrogenated cosmetic ingredients and other personal-care inputs face similar traceability expectations.
What leads distribution?
Direct Industrial Sales account for 44.30% share in 2026.
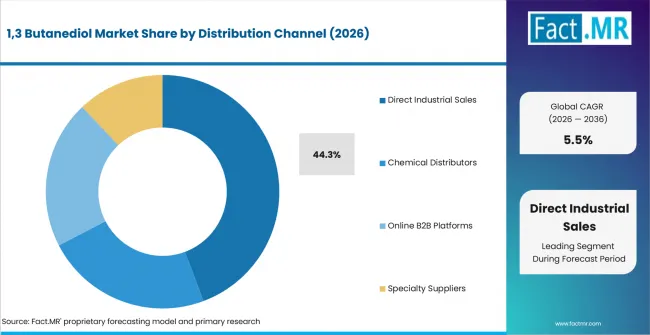
1,3 Butanediol Market Analysis By Distribution Channel | Source: Fact.MR
Direct industrial sales lead because large chemical users require technical contact, contract terms and scheduled supply. Distributors remain useful for smaller accounts and regional availability.
What is accelerating 1,3 Butanediol Market adoption, and what is holding it back?
Demand is projected to rise through solvent use, cosmetic formulation demand and chemical manufacturing continuity. Growth is constrained by feedstock exposure, qualification cycles and bio-based scale limits.
Driver Impact Analysis
| DRIVER | (~) % IMPACT ON CAGR | GEOGRAPHIC RELEVANCE | IMPACT TIMELINE |
|---|---|---|---|
| Industrial solvent use in chemical plants | +1.1% | Global | Short term (<= 2 years) |
| Cosmetic formulation and listing requirements | +0.8% | USA, South Korea, Japan | Medium term (2-4 years) |
| Polymer and resin intermediate demand | +0.7% | Europe, North America | Medium term (2-4 years) |
| Direct technical sales and documentation depth | +0.5% | Global | Long term (>= 4 years) |
Source: Fact.MR analysis. Updated Aug 21, 2026
- Industrial solvent use in chemical plants: Repeated coating, resin and intermediate-processing use supports qualified grades.
- Cosmetic formulation and listing requirements: MoCRA-era records make ingredient traceability more visible.
- Polymer and resin intermediate demand: Resin producers value grades that protect process stability.
Opportunity Impact Analysis
| OPPORTUNITY | (~) % IMPACT ON CAGR | GEOGRAPHIC RELEVANCE | IMPACT TIMELINE |
|---|---|---|---|
| Bio-based and fermentation-derived grades | +0.6% | USA, Europe, Japan | Long term (>= 4 years) |
| Cosmetic-grade positioning for skin and hair care | +0.5% | South Korea, USA, Japan | Medium term (2-4 years) |
| Specialty direct-supply programs | +0.4% | Global | Short term (<= 2 years) |
Source: Fact.MR analysis. Updated Aug 21, 2026
- Bio-based and fermentation-derived grades: Suppliers must match industrial purity and cost before substitution expands.
- Cosmetic-grade positioning: formulators need humectant grades that can be recorded clearly inside finished-product safety files.
- Specialty direct-supply programs: Large accounts value portals that simplify specification updates.
Restraint Impact Analysis
| RESTRAINT | (~) % IMPACT ON CAGR | GEOGRAPHIC RELEVANCE | IMPACT TIMELINE |
|---|---|---|---|
| Feedstock and chemical price volatility | -0.6% | Europe, North America | Short term (<= 2 years) |
| Long qualification cycles in regulated applications | -0.4% | USA, Europe, Japan | Medium term (2-4 years) |
| Limited scale for fermentation routes | -0.3% | Global | Long term (>= 4 years) |
Source: Fact.MR analysis. Updated Aug 21, 2026
- Feedstock and chemical price volatility: price swings can delay optional grade trials when buyers are focused on cost control.
- Long qualification cycles: Supplier changes can require new safety and quality records.
- Limited fermentation scale: Industrial users need volume availability and cost parity first.
Which countries are scaling the 1,3 Butanediol Market through 2036?
- The displayed country range spans 1.5 percentage points from Germany at 5.5% CAGR to Italy at 4.0% CAGR.
- Germany remains 0.3 percentage point above the USA as specialty chemical output and EU chemicals trade support direct qualification work.
- The USA remains 0.2 percentage point above South Korea as chemical shipments and cosmetic listings create a broader domestic base.
- South Korea remains 0.2 percentage point above Japan through export-facing cosmetics and national industrial output.
- The UK, France and Italy form the lower displayed band where price pressure and output softness limit discretionary grade switching.
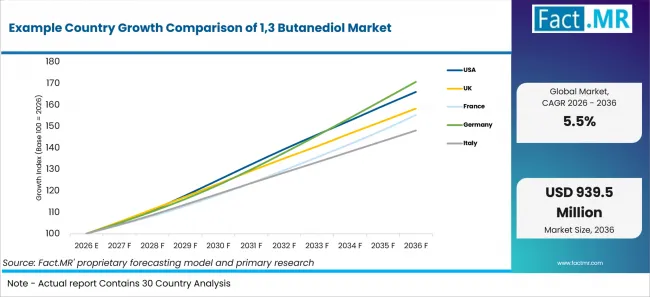
Example Country Growth Comparison Of 1,3 Butanediol Market | Source: Fact.MR
| Country | CAGR (2026-2036) |
|---|---|
| Germany | 5.5% |
| USA | 5.2% |
| South Korea | 5.0% |
| Japan | 4.8% |
| UK | 4.7% |
| France | 4.5% |
| Italy | 4.0% |
Source: Fact.MR analysis. Updated Aug 21, 2026
What supports Germany adoption?
5.5% CAGR, supported by specialty chemical output and EU chemicals trade.
Germany’s growth reflects a large specialty chemical base and strong export activity. Eurostat reported that Germany exported EUR 134 billion of chemicals and related products to non-EU countries in 2024, making it the largest exporter among EU member states. Industrial users value consistent solvent quality and documentation, although higher chemical prices, compatibility testing and bio-based cost requirements may slow broader substitution.
How is the USA developing demand?
5.2% CAGR, backed by chemical shipments and cosmetic product documentation.
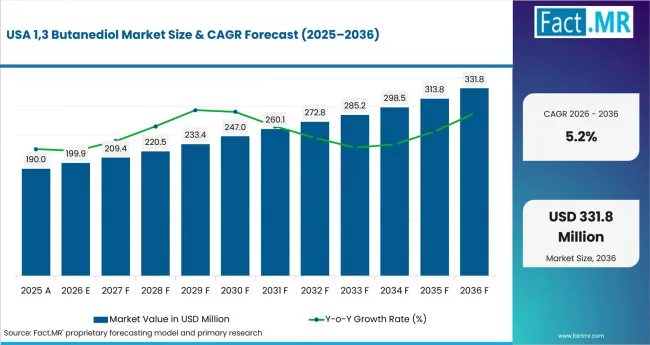
1,3 Butanediol Market Country Value Analysis | Source: Fact.MR
USA growth is supported by sizeable chemical shipments and extensive cosmetic-product activity. U.S. Census Bureau data available through FRED placed seasonally adjusted chemical-product shipments at USD 87.224 billion in June 2026, while FDA reported 1,298,361 unique, active cosmetic product listings as of June 30, 2026. Price volatility, MoCRA documentation and distributor dependence may lengthen supplier changes and formulation approvals.
What is driving South Korea’s growth?
5.0% CAGR, led by export-facing cosmetics and specialty chemical demand.
South Korea’s growth reflects strong export activity and rising demand from cosmetics manufacturers. Official South Korean data showed that cosmetics exports reached a record USD 11.4 billion in 2025. High-purity grades and batch documentation support demand, while weaker industrial output, renewed product-file checks and limited fermentation scale may restrain supplier switching.
How does Japan perform?
4.8% CAGR, supported by chemical production planning and quality-led procurement.
Japan’s growth reflects disciplined chemical procurement and demand for repeatable specialty-grade performance. METI reported industrial production rising 1.9% in June 2026, while Daicel linked stronger 1,3-BG sales to cosmetics demand. Long qualification cycles, high producer prices and limited local bio-based scale may restrict faster adoption.
What supports U.K. growth?
4.7% CAGR, shaped by chemical price pressure and industrial formulation needs.
U.K. growth is supported by manufacturing activity and demand from industrial formulators. ONS reported that UK manufacturing output grew 1.6% in the three months to May 2026 compared with the three months to February, while chemical input prices increased 6.6% year over year in June 2026. Falling production, distributor-led purchasing and regulated applications may extend supplier qualification timelines.
How is France scaling demand?
4.5% CAGR, supported by formulation demand and output-sensitive purchasing.
France’s growth reflects chemical exports and demand from cosmetics and industrial formulators. Eurostat reported that France exported EUR 54 billion of chemicals and related products to non-EU countries in 2024. Manufacturing weakness, compatibility testing and competition from established distributors may limit faster switching toward alternative butanediol grades.
What supports Italy adoption?
4.0% CAGR, tied to chemical-price conditions and direct supply requirements.
Italy’s growth reflects steady industrial demand for documented liquid grades used in coatings and resins. Eurostat reported that Italy imported EUR 34 billion of chemicals and related products from non-EU countries in 2024. Higher chemical prices, distributor reliance and limited cost parity for bio-based alternatives may constrain broader adoption.
Who leads the 1,3 Butanediol Market?
Supplier competition is shaped by grade availability, production route and documentation depth.
Oxea lists cosmetic- and industrial-quality 1,3-BG; KH Neochem Co., Ltd. lists 1,3-butylene glycol (CAS 107-88-0); and Daicel lists 1,3-BG in its chemical and personal-care portfolios. Again/Genomatica remains relevant to renewable chemicals through bio-based butylene glycol technology.
Which companies are the key providers?
Key companies include OQ Chemicals GmbH; KH Neochem Co., Ltd.; Again (Genomatica); and Daicel Corporation.
- OQ Chemicals GmbH
- KH Neochem Co., Ltd.
- Again (Genomatica)
- Daicel Corporation
Bibliography
- Federal Statistical Office (Destatis). (2026, July 7). Production in May 2026: +0.9% on the previous month.
- Eurostat. (2025, September 29). EU exports of chemicals reach a new record high.
- Federal Statistical Office (Destatis). (2026, June 19). Producer prices in May 2026: +2.2% on May 2025.
- U.S. Census Bureau. (2026, August 4). Monthly full report on manufacturers’ shipments, inventories, & orders.
- U.S. Bureau of Labor Statistics. (2026, July 15). Producer Price Index News Release – 2026 M06 Results.
- Ministry of Trade, Industry and Resources. (2026, January 2). Korea’s annual exports reach new highs in 2025.
- Ministry of Data and Statistics. (2026, June 30). Monthly Industrial Statistics, May 2026.
- Ministry of Economy, Trade and Industry. (2026, August 17). Indices of Industrial Production for June, 2026 (Revised Report).
- Daicel Corporation. (2025, August 1). 1st Quarter (Apr. to Jun.) of Fiscal Year ending March 2026 Financial Results Briefing.
- Bank of Japan. (2026, July 10). Monthly Report on the Corporate Goods Price Index (Preliminary Figures for June 2026).
This Report Answers
- The report explains where 1,3 butanediol is used across product, application, end use, technology, formulation and distribution.
- Segment analysis identifies the leading subsegments and why industrial users prioritize them.
- Country analysis examines the listed markets and adoption mechanisms.
- Competitive analysis reviews providers across chemical, specialty and bio-based routes.
- Application analysis assesses how solvent behavior and purity influence purchasing.
What does the 1,3 Butanediol Market cover?
The 1,3 Butanediol Market covers industrial and specialty grades used in solvent systems, chemical intermediates, cosmetics and polymer-related production. Adjacent propanediol coverage shows how diols connect humectant and solvent purchasing.
The assessment covers chemical synthesis and fermentation routes across industrial solvents, coatings, resin use, pharmaceutical inputs and cosmetics. Adjacent aliphatic solvents coverage is used only as contextual interlinking.
What is included in the scope?
The analytical scope includes industrial, cosmetic, bio-based and specialty 1,3-butanediol categories sold through direct industrial sales or chemical distribution. Pharmaceutical, API, electronic and other regulated-grade labels are retained and require product-specific supplier and qualification evidence before they are treated as verified commercial grades. The wider green chemicals space is treated only as adjacent context.
What is excluded from the scope?
The scope excludes unrelated bulk alcohols sold without a 1,3 butanediol specification, finished cosmetic products and finished pharmaceuticals. Wider solvent categories are excluded when they are not direct comparators or adjacent demand indicators.
How Was the Analysis Built?
The analysis draws on 120+ sources, 35+ company portfolios, 25+ countries, and more than 20 industry interviews.
- Primary Research: Primary research includes discussions with manufacturers, service providers, technology developers, distributors, end users, procurement teams, and subject-matter experts. These conversations examine purchasing priorities, product adoption, operational challenges, approval requirements, competitive positioning, and the factors that influence wider market acceptance.
- Desk Research: Desk research covers government statistics, regulatory publications, company filings, trade data, technical studies, industry associations, standards, public policy, and other authoritative sources. Every source used in the analysis is documented in the bibliography.
- Market Sizing and Forecasting: Market estimates combine historical performance, demand indicators, pricing and volume trends, segment shares, company participation, country-level growth, adoption patterns, investment activity, and barriers to market expansion.
- Data Validation and Update Cycle: Findings are validated by comparing primary interviews with public data, company activity, regulatory changes, trade patterns, and industry developments. Regular updates review new product launches, capacity changes, partnerships, approvals, procurement trends, and shifts in commercial adoption.
Segmentation
What is the report’s scope and coverage?
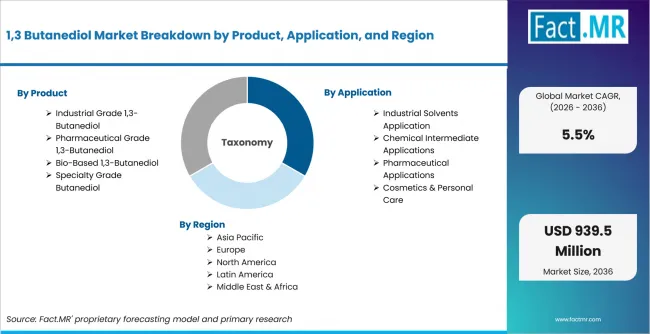
1,3 Butanediol Market Breakdown By Product, Application, And Region | Source: Fact.MR
| Attribute | Details |
|---|---|
| Quantitative Units | USD million |
| Market Definition | 1,3-butanediol (1,3-butylene glycol; CAS 107-88-0) is documented for cosmetics and personal care, solvent and chemical processing, coatings, polymer-related uses and other specialty formulations. Application-specific pharmaceutical or regulated uses require supplier and qualification evidence for the intended grade. |
| Product | Industrial Grade 1,3-Butanediol and other listed product grades. |
| Application | Industrial Solvents Application and other listed application areas. |
| End Use | Chemical Manufacturing Companies and other listed end-use groups. |
| Technology | Chemical Synthesis Technology and other listed technology routes. |
| Formulation | Liquid Formulations and other listed formulation formats. |
| Distribution Channel | Direct Industrial Sales and other listed sales channels. |
| Regions Covered | North America; Latin America; Western Europe; Eastern Europe; East Asia; South Asia & Pacific; Middle East & Africa |
| Countries Covered | USA; UK; France; Germany; Italy; South Korea; Japan |
| Key Companies Profiled | OQ Chemicals GmbH; KH Neochem Co., Ltd.; Again (Genomatica); and Daicel Corporation |
| Forecast Period | 2026 to 2036 |
| Approach | Hybrid top-down and bottom-up approach using chemical manufacturing activity, solvent applications, cosmetic formulation use, technology route, country demand signals and provider portfolio review. |
Source: Fact.MR analysis. Updated Aug 21, 2026
How is the market segmented?
-
By Product
- Industrial Grade 1,3-Butanediol
- Chemical Intermediate Grade
- Hydrocarbon Compatible Grade
- Pharmaceutical Grade 1,3-Butanediol
- API Grade Solvent Systems
- Cosmetic Grade Butanediol
- Bio-Based 1,3-Butanediol
- Fermentation Derived Grade
- Green Chemistry Grade
- Specialty Grade Butanediol
- High Purity Electronic Grade
- Custom Blended Grade
- Industrial Grade 1,3-Butanediol
-
By Application
- Industrial Solvents Application
- Coating Solvent Applications
- Resin Solvent Applications
- Chemical Intermediate Applications
- Polymer Production Applications
- Specialty Chemical Synthesis
- Pharmaceutical Applications
- Drug Formulation Applications
- Active Ingredient Processing
- Cosmetics & Personal Care
- Skincare Formulations
- Hair Care Applications
- Industrial Solvents Application
-
By End Use
- Chemical Manufacturing Companies
- Bulk Chemical Producers
- Specialty Chemical Manufacturers
- Pharmaceutical Companies
- Drug Manufacturing Firms
- Biopharmaceutical Companies
- Cosmetics & Personal Care Industry
- Skincare Product Manufacturers
- Hair Care Product Manufacturers
- Polymer & Plastic Industry
- Engineering Plastic Producers
- Resin Manufacturing Companies
- Chemical Manufacturing Companies
-
By Technology
- Chemical Synthesis Technology
- Catalytic Hydrogenation Systems
- Fermentation Technology
- Purification Technology
- Distillation Systems
- Membrane Separation Systems
- Process Engineering Technology
- Continuous Flow Systems
- Batch Processing Systems
- Green Chemistry Technology
- Bio Based Production Systems
- Energy Efficient Systems
- Chemical Synthesis Technology
-
By Formulation
- Liquid Formulations
- Pure Liquid Form
- Blended Liquid Formulations
- Solid Form Preparations
- Powder Based Systems
- Granular Form Systems
- Solution Based Formulations
- Water Based Solutions
- Solvent Based Solutions
- Functional Formulations
- Performance Additive Systems
- Non Performance Additive Systems
- Liquid Formulations
-
By Distribution Channel
- Direct Industrial Sales
- Manufacturer Direct Supply
- Enterprise Sales Channels
- Chemical Distributors
- Regional Distributors
- Global Distributors
- Online B2B Platforms
- Digital Chemical Marketplaces
- Manufacturer Portals
- Specialty Suppliers
- Custom Blending Suppliers
- Direct Industrial Sales
-
By Region
- North America
- Latin America
- Western Europe
- Eastern Europe
- East Asia
- South Asia and Pacific
- Middle East & Africa
Frequently Asked Questions
How big is the 1,3 butanediol market in 2026?
What is the CAGR of the 1,3 butanediol market from 2026 to 2036?
Which product leads the 1,3 butanediol market?
Which application leads the 1,3 butanediol market?
Who are the leading companies in the 1,3 butanediol market?
Who worked on this report


Preview the report firsthand - request a free sample
Free SampleGet the brochure for pricing and purchase details
Download PDF