

 Market")
- Base Value(2024): 224.9 Mn
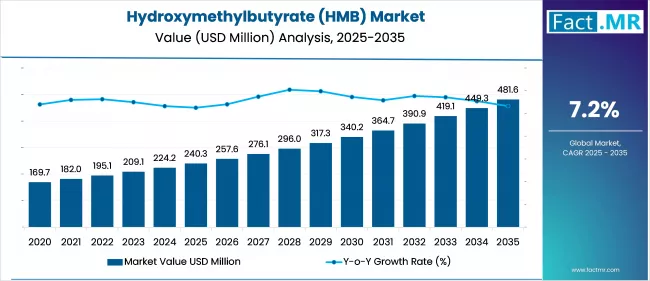
- Forecast Value (2035): 481.6 Mn
- CAGR (2035): 7.5%
Hydroxymethylbutyrate (HMB) Market Outlook (2025 to 2035)
The global Hydroxymethylbutyrate (HMB) market is expected to reach USD 481.6 million by 2035, up from USD 224.2 million in 2024. During the forecast period 2025 to 2035, the industry is projected to expand at a CAGR of 7.2%, driven by increasing fitness consciousness, growing clinical research validating muscle-preserving effects, surging demand from aging populations seeking strength retention, and increased inclusion in sports nutrition formulations.
Regulatory support for dietary supplements and innovation in delivery formats further reinforce its growth trajectory, making HMB a promising segment in the functional health solutions market.
What drives Hydroxymethylbutyrate (HMB) Market growth across sports nutrition, clinical nutrition, and aging populations?
The primary driver of the hydroxymethylbutyrate market is its effectiveness in enhancing muscle retention, recovery, and performance. The broader engagement in sports and fitness has led to high demand for muscle-supportive nutrition, particularly among amateur and professional athletes. Simultaneously, the expanding aging population has intensified clinical interest in using HMB to combat sarcopenia and muscle degradation in older adults.
Increased availability of dietary supplements in retail outlets and online has facilitated consumer adoption. Burgeoning scientific validation by peer-reviewed studies and experiments has strengthened market confidence and encouraged integration into broader categories of nutritional and therapeutic products.
What are the emerging trends shaping the global Hydroxymethylbutyrate (HMB) Market in 2025?
Several key developments shape the HMB market. Among these, a notable shift towards personalized nutrition has emerged, with HMB being developed as one of the individual health solutions tailored to meet individual needs. Another trend is the integration of HMB into functional foods and beverages beyond conventional capsules and powdered supplements.
Advanced formulation technologies have enhanced bioavailability and user convenience. Also, a combination of HMB with other compatible nutrients, for instance, Vitamin D or creatine, is gaining traction.
Sustainability trends have also influenced demand, with growing interest in plant-based and clean-label supplement formulations, as consumers increasingly prioritize ethically produced and transparent health solutions.
What factors are limiting the growth of the Hydroxymethylbutyrate (HMB) Market globally today?
Despite its potential, there are a number of restraints limiting the growth of HMB market. The relatively low production cost of HMB presents challenges related to pricing and marketability, especially in cost-sensitive regions. Limited consumer awareness outside fitness-focused groups continues to restrict broader adoption.
Regulatory scrutiny of health claims, particularly in Europe and certain parts of Asia, has complicated marketing efforts and slowed product approvals. Muscle-supportive ingredients, such as protein, branched-chain amino acids, and creatine, have gained wider traction, thereby reducing the visibility of HMB in these segments. Addressing these factors will require targeted education, cost-efficient innovation, and a clear regulatory pathway to fully develop market potential.
Which regions are driving the highest demand in the global Hydroxymethylbutyrate (HMB) Market growth?
North America has maintained its dominance in the HMB market, driven by demand in sports nutrition and a well-established clinical nutrition industry. This area has been enriched with research infrastructure, supplemented by regulations by the FDA, and high consumer education, especially in the United States.
Companies are developing novel HMB formulations for the athletes and elderly segments. Furthermore, platforms and direct-to-consumer systems have enabled increased market penetration and adoption among older populations.
The East Asia market has shown significant growth in HMB, driven by urbanization, rising income levels, and increasing health awareness. In countries such as China, Japan, and South Korea, demand for both sports and clinical nutrition products has increased steadily. Local manufacturing has expanded, supported by broader distribution networks and improved market access. Regional governments have promoted nutritional strategies for aging populations, expanding the clinical application of HMB.
The Western European market has continued to develop in HMB adoption, aligning with demographic changes and efforts to manage healthcare costs. Countries such as Germany, France, and the UK have incorporated HMB into medical nutrition protocols for rehabilitation and sarcopenia management.
The European Food Safety Authority (EFSA) has provided regulatory backing for HMB-based supplements, contributing to confidence in the products. Local companies are introducing quality offerings suited to the needs of older individuals and adults with fitness concerns.
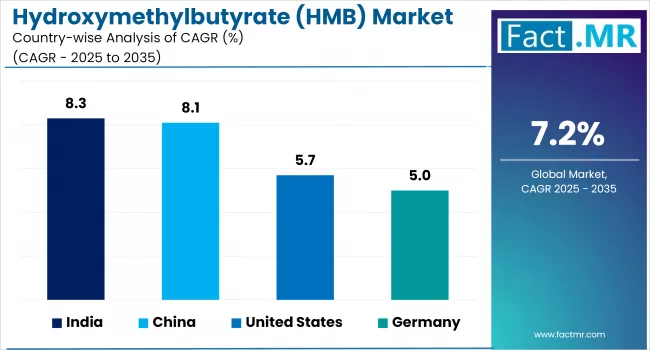
Country-wise Outlook
Health-Conscious Consumers and Functional Ingredients Boost U.S. Hydroxymethylbutyrate (HMB) Market
The Hydroxymethylbutyrate market in the United States has demonstrated consistent growth, as health and wellness considerations increasingly influence consumer behavior. The shift toward nutrient-dense, functional food products have prompted food manufacturers to revisit formulation strategies with an emphasis on clean-label and scientifically supported ingredients.
HMB, a derivative of GBL, has emerged as a natural preservative, particularly in organic baked goods where the use of synthetic additives is limited. The growing consumer preference for minimally processed, additive-free foods aligns well with the functional attributes of HMB.
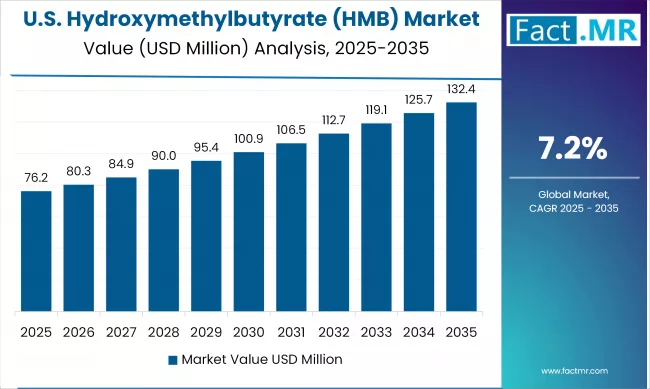
Moreover, the ability of HMB to extend the shelf life of frozen and pre-prepared dough products has contributed to improved operational efficiency among food retailers. These factors collectively highlight HMB’s role in supporting the health-driven transformation currently influencing the U.S. food processing industry.
Clean-Label Compliance and Dairy Innovation Propel Germany’s Hydroxymethylbutyrate (HMB) Market
Clean-label preferences and advancements in food safety practices in Germany have contributed to the growing traction of the Hydroxymethylbutyrate (HMB) market, reflecting a balanced response to the key priorities of the food safety sector. German consumers have increasingly shifted toward organic and additive-free products, prompting manufacturers to reformulate offerings to incorporate naturally derived preservation agents such as HMB.
Sourced from GBL, Hydroxymethylbutyrate (HMB) has demonstrated practical applications in the dairy and artisan bakery sectors, where maintaining structural integrity and ensuring a natural shelf life are crucial. Regulatory frameworks in Germany have become more stringent, particularly regarding the sustainability and authenticity of food ingredients.
These policies have aligned with consumer expectations, leading more food producers to adopt HMB in their formulations. This alignment between health-conscious consumer preferences and regulatory direction has strengthened market engagement, positioning HMB as a recognized component in Germany’s natural food preservation segment.
Industrial Growth and Regulatory Streamlining Boost China’s Hydroxymethylbutyrate (HMB) Market
The Hydroxymethylbutyrate (HMB) market in China has experienced notable development, supported by large-scale industrialization and evolving regulatory frameworks. The production of GBL derivatives is a sector in which the country has established a significant presence, with HMB being utilized across various areas, including pharmaceuticals, agricultural inputs, and electronic materials.
Local manufacturers have expanded output to meet growing demand in both domestic and international markets. At the same time, government agencies have introduced policy adjustments that have eased restrictions on drug imports and facilitated the oversight of GBL-related activities.
These regulatory refinements have improved the efficiency of trade and production processes, thereby supporting a broader range of HMB applications. As a result, China has strengthened its role as a key node within the global value chain of industries that utilize HMB.
Category-Wise Market Outlook
HMB Free Acid Gains Prominence Owing to Superior Absorption and Athletic Focus
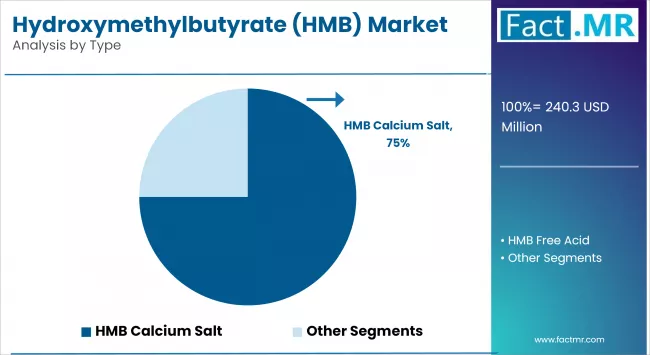
HMB free acid has gained increasing market traction due to its superior bioavailability compared to the calcium salt form, as the body more readily absorbs it. This variant has been well-received by athletes and fitness-focused consumers, particularly in North America and Europe, driving sustained growth in demand for performance supplements.
Its application across performance and medical contexts has expanded, supported by growing demand for fast-acting nutritional support in elite sports and rehabilitation. In clinical nutrition, particularly under controlled intake conditions, regulatory institutions have facilitated its adoption among specialized consumer segments.
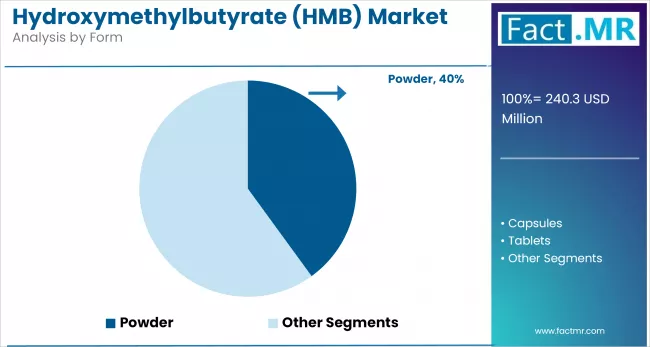
Capsules Emerge as the Fastest-Growing Form Due to Convenience and Consumer Preference
Capsules have gained notable preference due to their ease of ingestion, accurate dosing, and portability, particularly among older adults and health-conscious individuals. This format has been widely accepted in urban markets, where there is consistent demand for convenient, mobile health supplements.
Among established health and wellness brands, capsules are often perceived by consumers as a more hygienic and refined option compared to powders or tablets. In response to evolving preferences, nutraceutical companies have focused on encapsulated formulations to meet demand for minimal taste interference and improved digestibility, contributing to increased market adoption.
Athletic Performance Leads the Market Backed by Sports Nutrition Boom and Muscle Preservation Benefits
Athletic performance has become a prominent application area for HMB, with the compound’s role in supporting muscle retention and strength well-recognized within the sports nutrition market. The global emphasis on fitness, particularly in the period following the pandemic, has contributed to a noticeable increase in the demand for performance-supporting supplements.
HMB’s approved function in limiting muscle degradation has established it as a preferred ingredient in both pre- and post-workout formulations. Countries such as the U.S., Germany, and Japan have witnessed increased consumer adoption, supported by growing health and wellness expenditure among both professional athletes and recreational fitness users.
Competitive Analysis
Key participants in the hydroxymethylbutyrate industry have been active in pharmaceutical-grade nutrition, contract manufacturing, and research-based ingredient formulation. TSI Group Ltd has positioned itself as a consistent supplier of performance ingredients, with a particular emphasis on purity in its HMB offerings.
Metabolic Technologies, Inc. has developed HMB through a proprietary process and has supported its product with scientific validation to maintain efficacy. Zhejiang Yiwan Biotech Co., Ltd has contributed to the Chinese market with scalable chemical manufacturing capabilities.
Shijiazhuang Jirong Pharmaceutical Co., Ltd has expanded its production scope to include therapeutic-grade HMB, while Xinyi Zhenxing Biochemical Co., Ltd has operated in accordance with export compliance standards for its HMB products.
Chempure has worked in the synthesis of specialty chemicals, offering HMB to targeted segments. AbHformulations has delivered customized formulas with a nutraceutical emphasis. Parchem Fine & Specialty Chemicals has distributed HMB to various international markets.
NutraScience Labs has maintained full-cycle support for HMB supplements across its operations. BPI Sports has promoted HMB as part of its fitness-focused product line, reflecting its engagement with the athletic recovery category.
Key players of the hydroxymethylbutyrate industry are TSI Group Ltd, Metabolic Technologies, Inc., Zhejiang Yiwan Biotech Co., Ltd, Shijiazhuang Jirong Pharmaceutical Co., Ltd, Xinyi Zhenxing Biochemical Co., Ltd, Chempure, AbHformulations, Parchem Fine & Specialty Chemicals, NutraScience Labs, and BPI Sports.
Recent Development:
- In June 2025, Fitties launched its HMB+ Performance Guide, offering users a personalized roadmap to optimize muscle recovery. The guide combines HMB supplementation with tailored dosing strategies based on workout intensity, body weight, and fitness goals. It empowers athletes and fitness enthusiasts to maximize muscle retention, reduce soreness, and accelerate post-exercise recovery.
- In October 2024, Abbott launched Protality™ Advance, a high-protein nutritional shake fortified with HMB, designed to counteract muscle loss during weight loss. Specifically tailored for individuals using GLP-1 receptor agonists, the formula supports lean muscle preservation, enhances metabolic health, and addresses nutritional gaps commonly associated with calorie-restricted or medically supervised weight management programs.
Fact.MR has provided detailed information about the price points of key manufacturers of the Hydroxymethylbutyrate (HMB) Market, positioned across regions, including sales growth, production capacity, and speculative technological expansion, in the recently published report.
Methodology and Industry Tracking Approach
The 2025 Global Hydroxymethylbutyrate (HMB) Market Report by Fact.MR sets a new benchmark for strategic market intelligence, delivering a rigorously modeled, data-rich evaluation of HMB’s expanding role across food preservation, industrial applications, and sustainable chemical formulations.
Based on insights from over 7,500 stakeholders across 35 countries with 300+ validated responses per geography, the report integrates perspectives from R&D leaders, procurement heads, engineers, and compliance officers across top-tier organizations in food processing, water treatment, chemical manufacturing, and agro-industrials. This dual-layered respondent framework ensures a comprehensive view into HMB’s operational, regulatory, and innovation dynamics.
Spanning a research cycle from June 2024 to May 2025, the report captures critical developments including the emergence of low-residue, food-grade formulations, HMB’s diversification into eco-compliant industrial sectors, and increasing regulatory momentum around ingredient traceability and labeling harmonization.
Drawing from 250+ validated sources ranging from Codex listings and EH&S datasets to proprietary consumption audits, it employs advanced tools such as product lifecycle indexing and elasticity modeling. This edition is an essential resource for procurement strategists, regulatory decision-makers, chemical innovators, and institutional investors navigating a quality-driven, compliance-intensive global market landscape.
Segmentation of Hydroxymethylbutyrate (HMB) Market Research
-
By Type :
- HMB Calcium Salt
- HMB Free Acid
-
By Form :
- Powder
- Capsules
- Tablets
- Liquid
-
By Application :
- Muscle Health
- Sarcopenia & Aging Support
- Weight & Metabolic Management
- Immune & Recovery Enhancement
- Athletic Performance
-
By End Use :
- Sports Nutrition
- Pharmaceuticals
- Functional Food & Beverages
- Dietary Supplements
- Clinical Nutrition
-
By Distribution Channel :
- Online Retail
- Specialty Stores
- Pharmacies
-
By Region :
- North America
- Latin America
- Western Europe
- Eastern Europe
- East Asia
- South Asia & Pacific
- Middle East & Africa
- Frequently Asked Questions -
What was the Global Hydroxymethylbutyrate (HMB) Market Size Reported by Fact.MR for 2024?
The global Hydroxymethylbutyrate (HMB) market was valued at USD 224.9 million in 2024.
Who are the Major Players Operating in the Hydroxymethylbutyrate (HMB) Market?
Prominent players in the market are TSI Group Ltd, Metabolic Technologies, Inc., Zhejiang Yiwan Biotech Co., Ltd, Shijiazhuang Jirong Pharmaceutical Co., Ltd, among others.
What is the Estimated Valuation of the Hydroxymethylbutyrate (HMB) Market in 2035?
The market is expected to reach a valuation of USD 481.6 million in 2035.
What Value CAGR did the Hydroxymethylbutyrate (HMB) Market Exhibit Over the Last Five Years?
The historic growth rate of the Hydroxymethylbutyrate (HMB) Market was 6.4% from 2020 to 2024.