Chillers Market

Chillers Market Analysis, By Product Type, By Capacity, By Cooling Technology, By Coolant Type, By End Use Sector and By Region - Market Insights 2025 to 2035

The compressor chillers segment projected to grow at a CAGR of 3.3%, whereas the absorption chiller segment is likely to grow at 2.1%. In terms of countries, India projected to grow at 4.9%, followed by China at 3.3% and U.S. to grow at 2.4%.

Chillers Market Outlook (2025 to 2035)

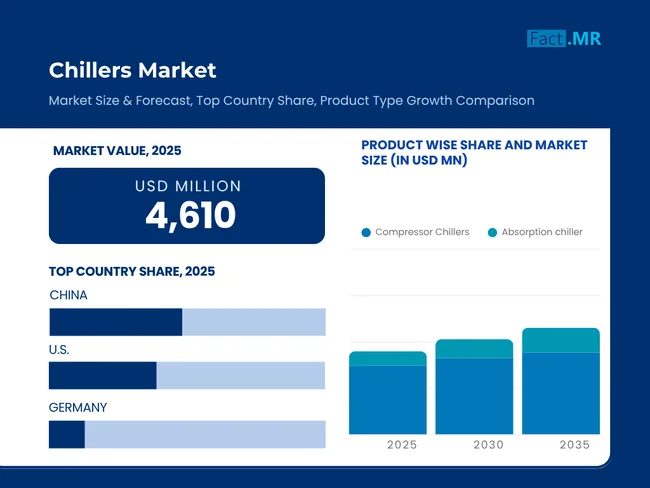
The global chillers market is expected to reach USD 6,256.3 billion by 2035, up from USD 4,610.3 billion in 2025, reflecting a projected CAGR of 3.1% over the forecast period.

The increased need for precise temperature adjustments in data centers, hospitals, and high-reliability production remains a driving force behind the liberalization of chillers. Nonetheless, regulatory pressure in terms of refrigerant use and the overall energy efficiency of the life cycle is changing procurement trends and the architecture (of systems) in all end-use sectors.

Chillers Market

Don't Need a Global Report?

save 40%! on Country & Region specific reports

What is driving demand for chillers globally?

The use of chillers has become necessary to provide centralized cooling of temperature-sensitive systems. Chilled water systems, at commercial scales, are being pursued for their ability to deliver space- and scale-efficient solutions across various sectors, from corporate offices to hospitality and data centers.

The higher capacity and the capacity to resist loads in industrial sectors, on its part, has increased the demand of water-cooled and screw- type chillers, mainly in the chemical, food and beverage, plastics and automotive industries wherein per ton of cooling capacity is less expensive to install compared with the installed capacity of other chillers.

At the same time, a limited set of refrigerants is about to change, due to the relaxation of refrigerant rules under the Kigali Arrangement and local phase-out plans (e.g., the India HCFC Phaseout Management Plan and the U.S. AIM Act).

Manufacturers have responded by integrating variable-speed compressor technologies, adaptive control logic, and modularity to meet both regulatory and cost-effectiveness requirements.

What are the regional dynamics of the Chillers Market?

Chillers Market Share By Top Regions 2025

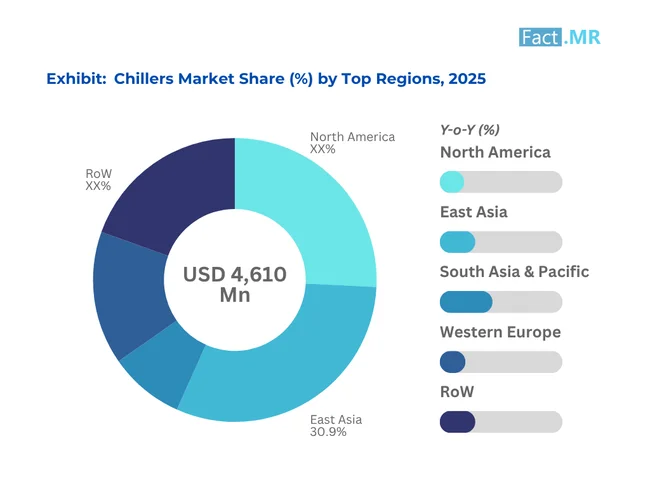
Methodical retrofit activity dominates commercial HVAC in North America. Industrial adoption is fragmented and constrained due to capital budgeting cycles and regional climate zoning codes; industrial adoption is slowly moving away from fragmentation.

Europe has long been a leader in the deployment of centrifugal and scroll chillers in public infrastructure and district cooling operations. The building sector has been pushed with the Energy Performance of Buildings Directive (EPBD), further ensuring enforcement of F-gas regulations to limit the use of high-GWP refrigerants.

Construction in China and manufacturing capacity in India, Vietnam, and Thailand. Newly built data centers in Singapore and Japan, along with augmented procurement, have somewhat supported demand for scroll and modular air-cooled chillers. Backing the procurement, while not directly, government programs such as India’s Cooling Action Plan, as well as China’s promotion of green industrial parks, add to the procurement support.

More Insights, Lesser Cost (-50% off)

Insights on import/export production,
pricing analysis, and more – Only @ Fact.MR

What are the challenges and restraining factors of Chillers Market?

Capital cost remains the most constraining factor, particularly for centrifugal and absorption chillers, which require higher upfront investment and larger installation infrastructure. GWP compliance also necessitates regular retrofitting and cyclical replacement of coolants, further increasing the lifecycle costs.

Operational risks arise from under-performance under part-load conditions due to fixed-speed compressors, which have made part-load performance a concern in variable-load applications, such as data centers and hospitals, where demand rates fluctuate unpredictably.

Lastly, unresolved standardization issues persist in emerging economies, particularly regarding the integration of building codes, access to refrigerants, and post-installation support infrastructure. Several developing markets continue to address this lack of servicing expertise and spare part incompatibility.

Country-Wise Outlook

United States enforces low-GWP transition through regulatory compliance and federal grants.

United States Chillers Market Size (US$ Mn) 2025 To 2035

Relying on the EPA SNAP Rule 23 and AIM Act mandates, manufacturers and institutional buyers in the United States hastened the transition toward chillers utilizing R-454B, R-1234ze(E), and R-513A. Federal procurement is giving preference to products conforming to AHRI 550/590 standards and ASHRAE 90.1 energy codes. Here, hybrid chiller integration is further aided while capital barriers are reduced through cooling-as-a-service contracts in municipal facilities.

Germany reinforces the water-cooled segment through industrialized decarburization targets

Under its National Industrial Strategy 2030, Germany's chiller market is driven by the decarbonization of industrial process heat. The chemical and discrete manufacturing sectors are investing in screw and absorption chillers with thermal energy recovery units. In urban areas, the low noise and compactness of the system are enforced under zoning constraints, and the increasing use of R717 (ammonia) is observed due to its zero-GWP and non-flammable properties, notwithstanding concerns about toxicity.

Scroll and screw chillers are supported in China for installation under smart factory policies

In support of the "Made in China 2025" industrial upgrade plan, the PRC government provides subsidies toward setting up high-efficiency cooling systems. In manufacturing hubs, chillers with R410A and R448A are specified, whereas Tier 1 city projects require a greater number of modular air-cooled systems. The Ministry of Ecology and Environment in China is experimenting with refrigerant recovery zones to prevent illegal emission of refrigerants, bringing the secondary market into compliance.

Know thy Competitors

Competitive landscape highlights only certain players
Complete list available upon request

Category-Wise Analysis

Scroll and screw chillers continue to dominate mid- to high-capacity usage

Scroll chillers are generally preferred for commercial buildings and small data centers because they are small with high partial-load COPs. However, screw chillers are primarily used in industrial operations that require continuous operation at high thermal loads, particularly in applications such as food processing, chemical production, and plastics manufacturing.

Demand centered between the 50–150 ton segment

The cooling capacity range of 50 to 150 tons remains the core demand band, accounting for the majority of installations across hospitals, hotels, and commercial buildings. Larger systems (greater than 150 tons) are typically deployed in heavy process industries or centralized utilities. Below 30 tons, packaged air conditioners remain more prevalent than chillers.

Water-cooled systems remain dominant, but air-cooled systems are gaining in urban settings

Chillers Market Share By Cooling Technology 2025

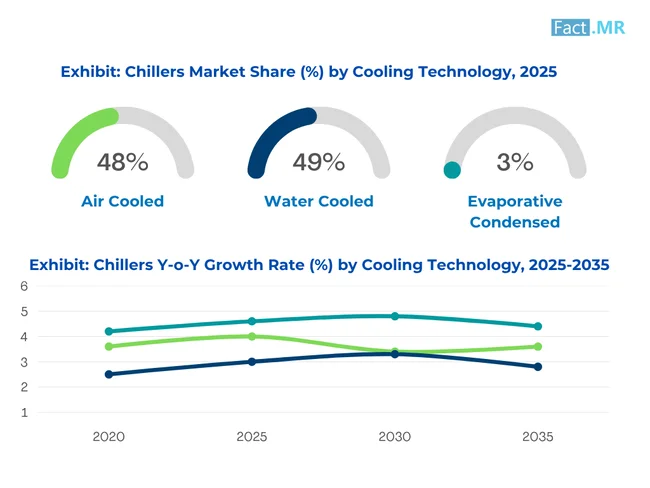
Water-cooled types are more efficient, particularly in systems characterized by low ambient temperatures and those with high load variations. Air-cooled systems are, however, gaining popularity in crowded urban areas and for retrofit solutions, as they are easier to site and require reduced initial infrastructure requirements.

Competitive Analysis

The chillers market is a highly concentrated industry, where world-leading companies account for more than 60 percent of the value. The most important competitive levers present are refrigerant flexibility, energy efficiency, adaptive control algorithms and modularity.

Technology platforms are also being perfected that enable multi-refrigerant compatibility, enabling end-user operators to choose in line with changing F-gas regulations. Large manufacturers have developed designs for compressors that offer variable-speed and magnetic bearing solutions to improve partial-load efficiency.

Strategic differentiation is also visible in after-sales support networks. OEMs with predictive maintenance services and real-time performance dashboards are gaining share in the institutional segment. In cost-sensitive sectors, value engineering and lower service cost per hour continue to shape procurement decisions.

To reduce lead time and comply with regional codes, firms are implementing regional assembly and custom configuration across the board to optimize costs. For example, production lines in the U.S. are optimized using AHRI-registered scroll units, whereas European production is ramping up based on ammonia-based large-tonnage systems.

The current consolidation of HVAC companies has also led to the standardization of products across different parts of the globe. Nevertheless, there is a risk of price erosion, particularly in markets such as South Asia and Latin America, where the second-tier would compete on a volume basis without much differentiation in terms of technology.

Major players in the chillers industry include Carrier, Trane Technologies, Johnson Controls, Daikin Industries, LG Electronics, Mitsubishi Electric, GEA Group, Blue Star Ltd., MTA SpA, and Smart Chiller Group.

Recent Development

  • January 2025 - Daikin released the VRX-series scroll chiller, featuring a built-in inverter compressor and multi-refrigerant control of R-32 and R-1234yf.
  • August 2024 -Johnson Controls announced a collaboration with the U.S. DOE to pilot the ultra-low GWP centrifugal chillers under real-time load conditions.

Methodology and Industry Tracking Approach

Fact.MR conducted a comprehensive 12-month study (June 2024 to May 2025) across 19 countries, combining demand-side and supply-side data. Over 6,300 respondents participated, including facilities engineers, HVAC planners, procurement directors, and maintenance specialists from sectors such as data centers, chemical plants, hospitals, and automotive factories.

Primary research focused on evaluating:

  • Cooling system replacement cycles
  • Refrigerant migration timelines
  • Energy usage patterns under partial-load conditions
  • Control system compatibility with Building Management Systems (BMS)

Secondary validation was carried out through:

  • Compliance data from the EPA (U.S.), the EU F-Gas Regulation, India’s Ozone Cell, and national building codes
  • Energy efficiency guidelines from ASHRAE, AHRI, and Eurovent Certification
  • Supplier-level analysis from OEM annual reports and verified performance data sheets

Technology benchmarking was performed across six compressor architectures, comparing system COPs, operating costs, and refrigerant transitions. Chillers using R290, R717, and R1234ze(E) were examined for lifecycle costs and safety trade-offs.

Since 2016, Fact.MR has tracked the chillers market under its broader Industrial HVAC & Building Utilities Program, focusing on equipment lifecycle analysis, refrigerant regulation response, and capacity deployment across smart infrastructure projects.

Segmentation of Chillers Market

  • By Product :

    • Compressor Chillers
      • Screw
      • Centrifugal
      • Scroll
      • Reciprocating
    • Absorption Chillers
  • By Capacity :

    • Up to 30 Ton
    • 30 – 50 Ton
    • 50 – 70 Ton
    • 70 – 100 Ton
    • 100 – 150 Ton
    • Above 150 Ton
  • By Cooling Technology :

    • Air Cooled
    • Water Cooled
    • Evaporative Condensed
  • By Coolant Type :

    • R134A
    • R744
    • R717
    • HCFC (R22, R123, R124, R151)
    • HCS (R600A, R290)
    • R407C
    • R404A
    • R410A
    • R448A
    • R449A
    • Others
  • By End Use Sector :

    • Commercial
      • Corporate Offices
      • Data Centers
      • Hospitality
    • Industrial
      • Chemical & Petrochemical
      • Healthcare
      • Plastics & Polymers
      • Food & Beverage
      • Oil & Gas
      • Energy & Power
      • Automotive
      • Discreet Manufacturing
  • By Region :

    • North America
    • Latin America
    • Western Europe
    • Eastern Europe
    • East Asia
    • South Asia & Pacific
    • Middle East & Africa

Table of Content

  1. Executive Summary
  2. Industry Introduction, including Taxonomy and Market Definition
  3. Trends and Success Factors
    • Macro-economic Factors
    • Market Dynamics
    • Recent Industry Developments
  4. Global Market Demand Analysis 2020 to 2024 and Forecast 2025 to 2035
    • Historical Analysis
    • Future Projections
  5. Pricing Analysis
  6. Global Market Analysis 2020 to 2024 and Forecast 2025 to 2035
    • By Product
    • By Capacity
    • By Cooling Technology
    • By Coolant Type
    • By End Use Sector
  7. By Product
    • Compressor Chillers
      • Screw Chiller
      • Centrifugal Chiller
      • Scroll Chiller
      • Reciprocating Chiller
    • Absorption Chiller
  8. By Capacity
    • Up to 30 Ton
    • 30 - 50 Ton
    • 50 - 70 Ton
  9. By Cooling Technology
    • Air Cooled
    • Water Cooled
    • Evaporative Condensed
  10. By Coolant Type
    • R134A
    • R744
    • R717
  11. By End Use Sector
    • Commercial
      • Corporate Office
      • Data Centers
      • Hospitality Sector
    • Industrial
      • Chemical & Petrochemical
      • Healthcare
      • Plastics & Polymers
      • Food & Beverage
      • Oil & Gas
      • Energy & Power
      • Automotive
      • Discreet Manufacturing
  12. By Region
    • North America
    • Latin America
    • Western Europe
    • South Asia & Pacific
    • East Asia
    • Eastern Europe
    • Middle East & Africa
  13. North America Sales Analysis 2020 to 2024 and Forecast 2025 to 2035, by Key Segments and Countries
  14. Latin America Sales Analysis 2020 to 2024 and Forecast 2025 to 2035, by Key Segments and Countries
  15. Western Europe Sales Analysis 2020 to 2024 and Forecast 2025 to 2035, by Key Segments and Countries
  16. South Asia & Pacific Sales Analysis 2020 to 2024 and Forecast 2025 to 2035, by Key Segments and Countries
  17. East Asia Sales Analysis 2020 to 2024 and Forecast 2025 to 2035, by Key Segments and Countries
  18. Eastern Europe Sales Analysis 2020 to 2024 and Forecast 2025 to 2035, by Key Segments and Countries
  19. Middle East & Africa Sales Analysis 2020 to 2024 and Forecast 2025 to 2035, by Key Segments and Countries
  20. Sales Forecast to 2035 by Product, Capacity, Cooling Technology, Coolant Type, and End Use Sector for 30 Countries
  21. Competitive Assessment
    • Company Share Analysis by Key Players
    • Competition Dashboard
  22. Company Profile
    • Abot
    • Blue Star Ltd.
    • Broad Group
    • Carrier Corporation
    • Daikin Industries
    • Dunham Group
    • Friulair SRL
    • GEA Group

List Of Table

  • Table 1: Global Market Units Forecast by Region, 2020 to 2035
  • Table 2: Global Market Units Forecast by Product, 2020 to 2035
  • Table 3: Global Market Units Forecast by Capacity, 2020 to 2035
  • Table 4: Global Market Units Forecast by Cooling Technology, 2020 to 2035
  • Table 5: Global Market Units Forecast by Coolant Type, 2020 to 2035
  • Table 6: Global Market Units Forecast by End Use Sector, 2020 to 2035
  • Table 7: North America Market Units Forecast by Country, 2020 to 2035
  • Table 8: North America Market Units Forecast by Product, 2020 to 2035
  • Table 9: North America Market Units Forecast by Capacity, 2020 to 2035
  • Table 10: North America Market Units Forecast by Cooling Technology, 2020 to 2035
  • Table 11: North America Market Units Forecast by Coolant Type, 2020 to 2035
  • Table 12: North America Market Units Forecast by End Use Sector, 2020 to 2035
  • Table 13: Latin America Market Units Forecast by Country, 2020 to 2035
  • Table 14: Latin America Market Units Forecast by Product, 2020 to 2035
  • Table 15: Latin America Market Units Forecast by Capacity, 2020 to 2035
  • Table 16: Latin America Market Units Forecast by Cooling Technology, 2020 to 2035
  • Table 17: Latin America Market Units Forecast by Coolant Type, 2020 to 2035
  • Table 18: Latin America Market Units Forecast by End Use Sector, 2020 to 2035
  • Table 19: Western Europe Market Units Forecast by Country, 2020 to 2035
  • Table 20: Western Europe Market Units Forecast by Product, 2020 to 2035
  • Table 21: Western Europe Market Units Forecast by Capacity, 2020 to 2035
  • Table 22: Western Europe Market Units Forecast by Cooling Technology, 2020 to 2035
  • Table 23: Western Europe Market Units Forecast by Coolant Type, 2020 to 2035
  • Table 24: Western Europe Market Units Forecast by End Use Sector, 2020 to 2035
  • Table 25: South Asia & Pacific Market Units Forecast by Country, 2020 to 2035
  • Table 26: South Asia & Pacific Market Units Forecast by Product, 2020 to 2035
  • Table 27: South Asia & Pacific Market Units Forecast by Capacity, 2020 to 2035
  • Table 28: South Asia & Pacific Market Units Forecast by Cooling Technology, 2020 to 2035
  • Table 29: South Asia & Pacific Market Units Forecast by Coolant Type, 2020 to 2035
  • Table 30: South Asia & Pacific Market Units Forecast by End Use Sector, 2020 to 2035
  • Table 31: East Asia Market Units Forecast by Country, 2020 to 2035
  • Table 32: East Asia Market Units Forecast by Product, 2020 to 2035
  • Table 33: East Asia Market Units Forecast by Capacity, 2020 to 2035
  • Table 34: East Asia Market Units Forecast by Cooling Technology, 2020 to 2035
  • Table 35: East Asia Market Units Forecast by Coolant Type, 2020 to 2035
  • Table 36: East Asia Market Units Forecast by End Use Sector, 2020 to 2035
  • Table 37: Eastern Europe Market Units Forecast by Country, 2020 to 2035
  • Table 38: Eastern Europe Market Units Forecast by Product, 2020 to 2035
  • Table 39: Eastern Europe Market Units Forecast by Capacity, 2020 to 2035
  • Table 40: Eastern Europe Market Units Forecast by Cooling Technology, 2020 to 2035
  • Table 41: Eastern Europe Market Units Forecast by Coolant Type, 2020 to 2035
  • Table 42: Eastern Europe Market Units Forecast by End Use Sector, 2020 to 2035
  • Table 43: Middle East & Africa Market Units Forecast by Country, 2020 to 2035
  • Table 44: Middle East & Africa Market Units Forecast by Product, 2020 to 2035
  • Table 45: Middle East & Africa Market Units Forecast by Capacity, 2020 to 2035
  • Table 46: Middle East & Africa Market Units Forecast by Cooling Technology, 2020 to 2035
  • Table 47: Middle East & Africa Market Units Forecast by Coolant Type, 2020 to 2035
  • Table 48: Middle East & Africa Market Units Forecast by End Use Sector, 2020 to 2035

List Of Figures

  • Figure 1: Global Market Value Share (%), Growth Rate (Y-o-Y), and Units Projection by Product, 2020 to 2035
  • Figure 2: Global Market Value Share (%), Growth Rate (Y-o-Y), and Units Projection by Capacity, 2020 to 2035
  • Figure 3: Global Market Value Share (%), Growth Rate (Y-o-Y), and Units Projection by Cooling Technology, 2020 to 2035
  • Figure 4: Global Market Value Share (%), Growth Rate (Y-o-Y), and Units Projection by Coolant Type, 2020 to 2035
  • Figure 5: Global Market Value Share (%), Growth Rate (Y-o-Y), and Units Projection by End Use Sector, 2020 to 2035
  • Figure 6: Global Market Value Share (%), Growth Rate (Y-o-Y), and Units Projection by Region, 2020 to 2035
  • Figure 7: North America Market Value Share (%), Growth Rate (Y-o-Y), and Units Projection by Product, 2020 to 2035
  • Figure 8: North America Market Value Share (%), Growth Rate (Y-o-Y), and Units Projection by Capacity, 2020 to 2035
  • Figure 9: North America Market Value Share (%), Growth Rate (Y-o-Y), and Units Projection by Cooling Technology, 2020 to 2035
  • Figure 10: North America Market Value Share (%), Growth Rate (Y-o-Y), and Units Projection by Coolant Type, 2020 to 2035
  • Figure 11: North America Market Value Share (%), Growth Rate (Y-o-Y), and Units Projection by End Use Sector, 2020 to 2035
  • Figure 12: North America Market Value Share (%), Growth Rate (Y-o-Y), and Units Projection by Country, 2020 to 2035
  • Figure 13: Latin America Market Value Share (%), Growth Rate (Y-o-Y), and Units Projection by Product, 2020 to 2035
  • Figure 14: Latin America Market Value Share (%), Growth Rate (Y-o-Y), and Units Projection by Capacity, 2020 to 2035
  • Figure 15: Latin America Market Value Share (%), Growth Rate (Y-o-Y), and Units Projection by Cooling Technology, 2020 to 2035
  • Figure 16: Latin America Market Value Share (%), Growth Rate (Y-o-Y), and Units Projection by Coolant Type, 2020 to 2035
  • Figure 17: Latin America Market Value Share (%), Growth Rate (Y-o-Y), and Units Projection by End Use Sector, 2020 to 2035
  • Figure 18: Latin America Market Value Share (%), Growth Rate (Y-o-Y), and Units Projection by Country, 2020 to 2035
  • Figure 19: Western Europe Market Value Share (%), Growth Rate (Y-o-Y), and Units Projection by Product, 2020 to 2035
  • Figure 20: Western Europe Market Value Share (%), Growth Rate (Y-o-Y), and Units Projection by Capacity, 2020 to 2035
  • Figure 21: Western Europe Market Value Share (%), Growth Rate (Y-o-Y), and Units Projection by Cooling Technology, 2020 to 2035
  • Figure 22: Western Europe Market Value Share (%), Growth Rate (Y-o-Y), and Units Projection by Coolant Type, 2020 to 2035
  • Figure 23: Western Europe Market Value Share (%), Growth Rate (Y-o-Y), and Units Projection by End Use Sector, 2020 to 2035
  • Figure 24: Western Europe Market Value Share (%), Growth Rate (Y-o-Y), and Units Projection by Country, 2020 to 2035
  • Figure 25: South Asia & Pacific Market Value Share (%), Growth Rate (Y-o-Y), and Units Projection by Product, 2020 to 2035
  • Figure 26: South Asia & Pacific Market Value Share (%), Growth Rate (Y-o-Y), and Units Projection by Capacity, 2020 to 2035
  • Figure 27: South Asia & Pacific Market Value Share (%), Growth Rate (Y-o-Y), and Units Projection by Cooling Technology, 2020 to 2035
  • Figure 28: South Asia & Pacific Market Value Share (%), Growth Rate (Y-o-Y), and Units Projection by Coolant Type, 2020 to 2035
  • Figure 29: South Asia & Pacific Market Value Share (%), Growth Rate (Y-o-Y), and Units Projection by End Use Sector, 2020 to 2035
  • Figure 30: South Asia & Pacific Market Value Share (%), Growth Rate (Y-o-Y), and Units Projection by Country, 2020 to 2035
  • Figure 31: East Asia Market Value Share (%), Growth Rate (Y-o-Y), and Units Projection by Product, 2020 to 2035
  • Figure 32: East Asia Market Value Share (%), Growth Rate (Y-o-Y), and Units Projection by Capacity, 2020 to 2035
  • Figure 33: East Asia Market Value Share (%), Growth Rate (Y-o-Y), and Units Projection by Cooling Technology, 2020 to 2035
  • Figure 34: East Asia Market Value Share (%), Growth Rate (Y-o-Y), and Units Projection by Coolant Type, 2020 to 2035
  • Figure 35: East Asia Market Value Share (%), Growth Rate (Y-o-Y), and Units Projection by End Use Sector, 2020 to 2035
  • Figure 36: East Asia Market Value Share (%), Growth Rate (Y-o-Y), and Units Projection by Country, 2020 to 2035
  • Figure 37: Eastern Europe Market Value Share (%), Growth Rate (Y-o-Y), and Units Projection by Product, 2020 to 2035
  • Figure 38: Eastern Europe Market Value Share (%), Growth Rate (Y-o-Y), and Units Projection by Capacity, 2020 to 2035
  • Figure 39: Eastern Europe Market Value Share (%), Growth Rate (Y-o-Y), and Units Projection by Cooling Technology, 2020 to 2035
  • Figure 40: Eastern Europe Market Value Share (%), Growth Rate (Y-o-Y), and Units Projection by Coolant Type, 2020 to 2035
  • Figure 41: Eastern Europe Market Value Share (%), Growth Rate (Y-o-Y), and Units Projection by End Use Sector, 2020 to 2035
  • Figure 42: Eastern Europe Market Value Share (%), Growth Rate (Y-o-Y), and Units Projection by Country, 2020 to 2035
  • Figure 43: Middle East & Africa Market Value Share (%), Growth Rate (Y-o-Y), and Units Projection by Product, 2020 to 2035
  • Figure 44: Middle East & Africa Market Value Share (%), Growth Rate (Y-o-Y), and Units Projection by Capacity, 2020 to 2035
  • Figure 45: Middle East & Africa Market Value Share (%), Growth Rate (Y-o-Y), and Units Projection by Cooling Technology, 2020 to 2035
  • Figure 46: Middle East & Africa Market Value Share (%), Growth Rate (Y-o-Y), and Units Projection by Coolant Type, 2020 to 2035
  • Figure 47: Middle East & Africa Market Value Share (%), Growth Rate (Y-o-Y), and Units Projection by End Use Sector, 2020 to 2035
  • Figure 48: Middle East & Africa Market Value Share (%), Growth Rate (Y-o-Y), and Units Projection by Country, 2020 to 2035

- FAQs -

What is the expected market size of chillers in 2025?

The market is estimated to reach USD 4,610.3 billion by 2025.

What is the forecasted valuation by 2035?

The global chillers market is projected to reach USD 6,256.3 billion by 2035.

Who are the key manufacturers in this market?

Major players include Trane, Carrier, Johnson Controls, Daikin, Mitsubishi Electric, LG, Blue Star, Midea, and GEA Group.

Which cooling capacity segment dominates demand?

Chillers within the 50–150 ton range account for the majority of commercial and institutional installations.

- Also of Interest -

Brine Chillers Market

Brine Chillers Market Analysis by Air-cooled and Water-cooled for Food & Beverages, Chemicals & Petrochemicals, Pharmaceuticals, HVAC, Energy, and Others from 2023 to 2033

Process Chillers Market

Process Chillers Market Analysis, By Capacity (Up to 20 Tons, 20 - 150 Tons, 150 - 300 Tons, and Above 300 Tons), By Compressor Type (Positive Displacement and Centrifugal), By End Use Industry (Plastics, Food & Beverages, Pharmaceutical, Printing, Chemical, Energy, Engineering & Mechanical, and Others), & Region - Market Insights 2025 to 2035

Methanol Chillers Market

Methanol Chillers Market Analysis by Absorption and Compression Chillers for Chemical & Petrochemicals, Food & Beverages, Pharmaceuticals, HVAC & Refrigeration, and Data Centers from 2023 to 2033

Gas Liquefaction Chillers Market

Gas Liquefaction Chillers Market Study by Air-cooled and Water-cooled for Liquefied Natural Gas Plants, Petrochemicals, Pharmaceuticals & Biotechnology, Food & Beverages, and Others from 2023 to 2033

Chillers Market

Schedule a Call