


- Base Value(2025): 5.3 Bn
- Forecast Value (2035): 15.2 Bn
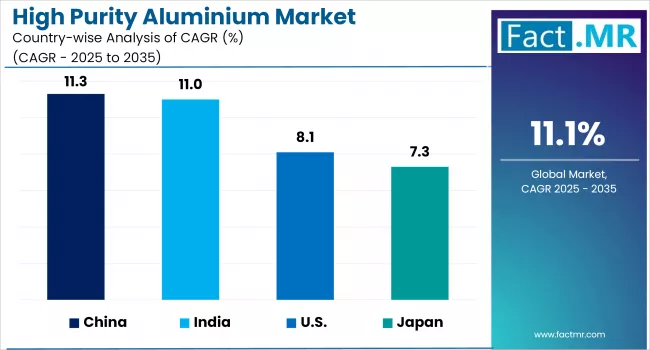
- CAGR (2035): 11.1%
High Purity Aluminium Market Outlook (2025 to 2035)
The global high-purity aluminium market is projected to increase from USD 5.3 billion in 2025 to USD 15.2 billion by 2035, with a CAGR of 11.1%, driven by the increasing use of high-purity alumina (HPA) in electric vehicle (EV) batteries and electronic manufacturing components. Their use makes them ideal for applications requiring superior conductivity, corrosion resistance, and high thermal stability in EV batteries and advanced electronics.
-2025-to-2035.webp)
What are the Drivers of High Purity Aluminium Market?
The lithium-ion battery's performance is enhanced by the nano-thickness of alumina-coated separators and the thin coating on the separator sheet. The battery's durability is improved by this HPA, which increases its capacity to withstand a high rate of discharge.
High Purity Alumina (HPA) is a refined form of aluminium oxide with a purity of 99.9% or higher. Its properties and applications are considerably influenced by its purity, which is categorized by the number of "nines" (4N, 5N, 6N). The U.S. Department of Energy anticipates that the majority of its lighting installation projects will be completed by 2035.
The residential sector is expected to incorporate LED lighting technology, facilitated by ENERGY STAR products. ENERGY STAR-qualified products consume approximately 75% less energy than LCDs. The HPA market is expected to expand during the forecast period due to its utilization in LED manufacturing for residential and commercial illumination.
The global HPA market is experiencing significant expansion due to the growing demand for LED manufacturing and electric vehicle batteries. In lithium-ion batteries, HPA is an essential component due to its stability and conductivity. Additionally, the market is observing trends such as the development of new technologies to reduce costs and strategic partnerships.
Additionally, the industry is significantly influenced by the increasing demand for LED lighting, electronics, and EV batteries, which are extensively utilized due to their superior hardness, thermal stability, and brightness.
HPA observes significant demand for plasma displays, as they are a cost-effective and energy-efficient alternative to traditional materials, such as incandescent light bulbs. It is also a fundamental base material for synthetic sapphire substrates, which are used in various microelectronics, particularly semiconductors.
What are the Regional Trends of High Purity Aluminium Market?
The North American market has tremendous growth potential due to improved technology and aggressive R&D. The U.S., Canada, and Mexico dominate the region's market with electric cars, semiconductors, and LED lighting innovations.
Additionally, investments in high purity alumina manufacturing capacities aim to improve domestic mineral supply chains and reduce imports, driving market growth. Due to its world-leading electronics industry and semiconductor production capabilities, the market is expected to dominate North America in 2025, with the largest revenue share.
Consumer demand also drives market growth, particularly in the semiconductor industry. Significant investments in new manufacturing and research facilities demonstrate the U.S.'s commitment to leadership in high-purity alumina production. European high-purity alumina consumption is expected to increase due to the growing demand for semiconductor technology and energy-efficient lighting solutions.
LEDs and electric vehicles benefit from the region's efforts to promote sustainability and reduce carbon emissions. Innovation in high-purity alumina technologies is encouraged by robust regulatory regimes. As Europe adopts greener technologies, demand for high-purity alumina is expected to rise.
In 2025, the APAC market had the largest revenue share. The strong manufacturing skills of China, Japan, South Korea, and India drove this expansion. This area dominates the LED market and is producing an increasing number of electric vehicles, particularly in China. The presence of major battery manufacturing facilities strengthens the region's market position.
Due to its large semiconductor production base and strong LED lighting sector, China's high-purity alumina market led the Asia-Pacific market in 2024. China is also a global leader in lighting products due to government initiatives and rising local demand. China's global dominance is reinforced by the growing demand for high-purity alumina in battery applications from the electric car sector.
The Latin America market is predicted to grow, driven by infrastructure and renewable energy initiatives. Brazil is also developing its industrial capabilities by using high-purity alumina for diverse purposes. LEDs and electric vehicles are gaining popularity due to concerns over energy efficiency and sustainability, which is expected to enhance the regional high-purity alumina market.
What are the Challenges and Restraining Factors of High Purity Aluminium Market?
The market faces challenges such as high production costs and limited availability of raw materials. The production of high-purity aluminum ingots is energy-intensive, and fluctuations in energy prices can have a substantial impact on manufacturing costs.
Furthermore, the market's expansion may be hindered by the cost and availability of raw materials, particularly bauxite. The financial burden on manufacturers is further compounded by the necessity for ongoing investment in research and development to enhance production efficiency and reduce costs.
While environmental regulations and the movement toward sustainable practices offer opportunities, they also introduce operational challenges and compliance costs that could potentially influence market dynamics.
The Bayer process is commonly used for the commercial production of high-purity aluminum; however, it generates significant industrial waste known as bauxite residue, also referred to as red mud, with approximately 1.4 to 1.5 tons of red mud produced per ton of aluminum.
Red mud is regarded as environmentally hazardous due to its substantial volume, alkalinity, and storage complications. Currently, over 200 aluminium smelters worldwide are involved in producing aluminium from bauxite.
The production of red soil is also increasing in tandem with the global demand for aluminium. Although red mud is classified as low- or non-hazardous waste in most countries, its storage and disposal require high capital investment, leading to significant additional costs that can erode profit margins for some companies.
Sophisticated apparatus and devices are necessary for the production of high-purity aluminium. Consequently, the production of these compounds is frequently accompanied by substantial operational expenses. To establish a standard plant with an annual capacity of 4,000 tons, a CAPEX of approximately USD 297.6 million and an OPEX of approximately USD 44.6 million are required.
The market trends will be influenced by a variety of factors, including weak global economic growth, rising inflation, and the emergence of wars that result in fluctuating trade conditions. In order to ensure their future in this business sector, HPA manufacturers will need to navigate these challenges.
Country-Wise Outlook
U.S. High Purity Aluminium Market Sees Growth Driven by Energy Storage And Electric Vehicles
The market is witnessing significant growth, primarily driven by its critical role in advanced technological applications. The expanding consumer electronics industry, along with extensive R&D activities, is a major factor fueling this demand. High purity alumina (HPA), also known as aluminum oxide, is a refined non-metallurgical form of alumina produced through processes such as hydrolysis of aluminum oxide, hydrochloric acid leaching, underwater spark discharge with aluminum, and vapor-phase oxidation.
-2025-to-2035.webp)
As industries like electronics, energy, and optoelectronics continue to advance, the demand for high-purity alumina is expected to grow, positioning the U.S. as a significant player in the regional market. The versatility and exceptional purity of high-purity alumina ensure its status as an essential material for cutting-edge technologies, which is expected to further propel market growth in the coming years.
China Witnesses Rapid Market Growth Backed by Government Policy and Industry Action Plans
The Chinese government’s 2025-2027 Aluminium Industry Action Plan emphasizes strengthening the aluminium supply chain, ensuring resource security, and promoting green transformation. Targets include increasing domestic bauxite reserves, boosting recycled aluminium output, and stricter energy and environmental standards for new projects.
These policies are designed to enhance resource self-sufficiency, circular economy practices, and green innovation, all of which support sustainable growth in the HPA sector. China is focusing on cleaner production methods and the integration of recycled aluminium to meet both environmental goals and rising product demand.
The push for energy efficiency and the use of clean energy in aluminium production aligns with global trends toward decarbonization, particularly as high-quality bauxite becomes increasingly scarce and environmental regulations tighten. Ongoing investments in research and development are improving production efficiency and enabling new applications for HPA in high-performance electronics and advanced manufacturing, further supporting high-purity aluminium market growth.
Japan is Experiencing Significant Growth, Primarily Driven by Aerospace And Defense
HPA is crucial for producing sapphire substrates used in LED devices. The increasing adoption of LED lighting in Japan, driven by both energy efficiency and regulatory compliance, is propelling market growth. The aerospace sector’s need for lightweight, high-strength, and ultra-pure materials is contributing to the rising demand for high-purity aluminum.
Japan is advancing several new initiatives in the high-purity aluminium sector, focusing on sustainability, advanced manufacturing, and technological innovation. Companies like Sumitomo Corporation are investing in the production of low-carbon aluminium using renewable energy sources such as hydro, solar, and wind power.
The launch of branded products like "GEM" aims to position low-carbon aluminium as a premium, environmentally friendly alternative, supporting Japan's broader carbon-neutral goals.
Category-wise Analysis
4N to Exhibit Leading by Grade
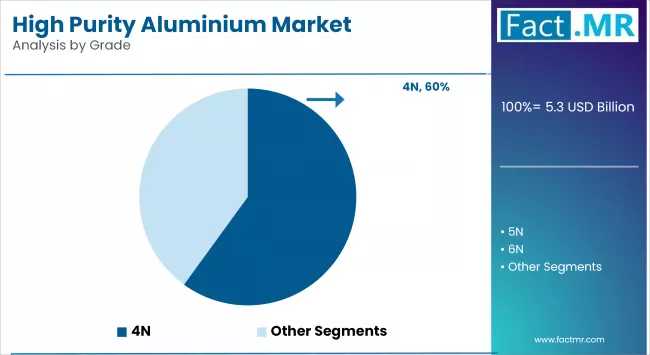
The 4N grade segment accounts for the largest revenue share in the high-purity aluminium market, owing to its extensive application in LED lighting, lithium-ion batteries, and other industrial uses. Its 99.99% purity level offers an effective balance between performance and cost, making it a popular choice across large-scale manufacturing sectors, particularly in the rapidly growing lighting and EV industries.
The 5N grade segment is projected to be the fastest-growing segment during the forecast period, driven by rising demand for ultra-high-purity materials in advanced electronics, aerospace, and semiconductor applications. As technological advancements continue to push for greater precision and reliability, the adoption of 5N aluminium is accelerating, supported by enhanced production capabilities and quality control by major manufacturers.
Semiconductor to Exhibit Leading by End-Use
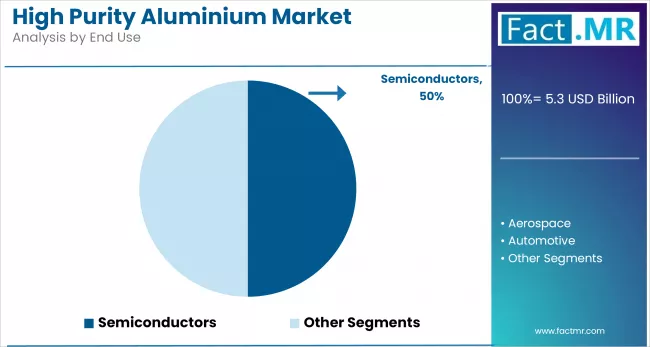
The semiconductor industry dominates the high-purity aluminium market, driven by its essential role in wafer production and chemical vapor deposition processes. With the rapid growth in semiconductor device manufacturing and electronic components, demand for high-purity aluminum continues to surge.
In the broader electronics sector, high-purity aluminium is vital for producing capacitor foils, flat panel displays, thin films, and data storage systems. The ongoing trend of device miniaturization and increasing need for high-performance components are further fueling market growth across these applications.
Ingots to Exhibit Leading by Form
The ingots segment holds the largest revenue share in the high-purity aluminium market due to its widespread use across various end-use industries such as semiconductors, electronics, and aerospace. Ingots are favored for their ease of transport, storage, and further processing into different shapes and components, making them highly versatile and cost-effective for large-scale manufacturing.
The wires and coils segment is expected to be the fastest-growing during the forecast period, driven by increasing demand from the electronics and automotive sectors. These forms are essential for electrical conductivity applications, including high-precision wiring in semiconductors and EV components, where purity and performance are critical.
Competitive Analysis
The high purity aluminium (HPA) market is becoming increasingly competitive, with a mix of global corporations and emerging players competing on the basis of technological innovation, material purity, and application versatility.
Key companies such as Orbite Technologies Inc., Altech Chemicals Ltd., Almatis, Inc., and Nippon Light Metal Holdings Co., Ltd. have established strong footprints globally, particularly in Asia-Pacific and Europe, leveraging their advanced refining techniques and broad application portfolios. These players maintain a competitive edge through strong R&D capabilities, secure raw material sourcing, and diversified end-use partnerships in industries like semiconductors, LEDs, and lithium-ion batteries.
Strategic initiatives such as partnerships, capacity expansions, and vertical integration are also reshaping the competitive landscape. Companies are investing in proprietary refining processes to achieve higher purities (4N and above), enabling them to meet the stringent quality demands of high-tech applications.
In parallel, regional players in developing economies are offering cost-effective solutions to cater to price-sensitive markets, particularly in Latin America and Southeast Asia. These players focus on scalability and affordability to capture emerging demand across renewable energy, electronics, and EV infrastructure sectors.
Key players in the high-purity aluminium industry include Nature Alu, Chalco, Showa Denko KK, Norsk Hydro, Kyushu Mitsui Aluminium, Nippon Light Metal Holding Co., Join World, RuSAL, Sumitomo Chemicals Co., Ltd., and other notable players.
Recent Development
- In June 2025, Hindalco Industries Limited, the metals flagship of the Aditya Birla Group, acquired a 100% equity stake in AluChem Companies, Inc., a US-based manufacturer of specialty alumina. The acquisition was made for an enterprise value of USD 125 million through Aditya Holdings LLC, a step-down wholly owned subsidiary of Hindalco.
(Source: https://www.hindalco.com/media/press-releases/hindalco-to-acquire-us-based-aluchem-companies-inc)
- In May 2024, Alpha HPA finalized its investment decision to proceed with the full-scale production of High Purity Alumina (HPA) at its site in Gladstone, Queensland. The company aims to build the world's largest single-site HPA refinery, with construction anticipated to begin in mid-2024 at the existing HPA First project site in Yarwun, near Gladstone.
(Source: https://alphahpa.com.au/alpha-hpa-takes-final-investment-decision-to-enter-full-scale-production-in-gladstone)
Segmentation of High Purity Aluminium Market
-
By Grade :
- 4N
- 5N
- 6N
-
By End Use :
- Semiconductors
- Chip Production
- Flat Panel Display Production
- Thin Film Production
- Electrolytic Capacitor Foils
- Electronic Storage Systems
- Others
- Aerospace
- Automotive
- Others
-
By Form :
- Disks
- Pellets
- Ingots
- Wires & Coils
- Other Forms
-
By Region :
- North America
- Latin America
- Western Europe
- Eastern Europe
- East Asia
- South Asia & Pacific
- Middle East & Africa
- Frequently Asked Questions -
What is the Global High Purity Aluminium Market Size in 2025?
The high purity aluminium market is valued at USD 5.3 billion in 2025.
Who are the Major Players Operating in the High Purity Aluminium Market?
Prominent players in the market include Nature Alu, Chalco, Showa Denko KK, Norsk Hydro, and Kyushu Mitsui Aluminium.
What is the Estimated Valuation of the High Purity Aluminium Market by 2035?
The market is expected to reach a valuation of USD 15.2 billion by 2035.
What Value CAGR Did the High Purity Aluminium Market Exhibit Over the last Five Years?
The growth rate of the high purity aluminium market is 8.6% from 2020-2024.