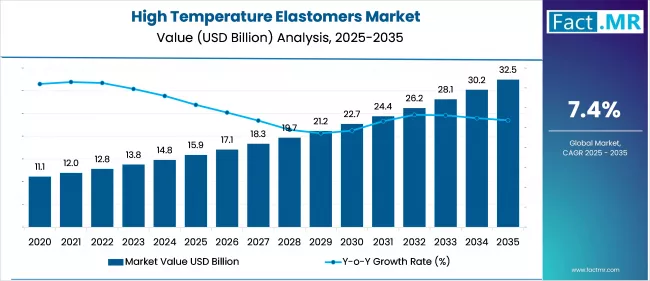
High Temperature Elastomers Market

High Temperature Elastomers Market, By Type, By Processing Method, By Application, By End Use Industry and Region - Market Insights 2025 to 2035

The Fluorocarbon Elastomers (FKM) segment is projected to grow at a CAGR of 7.2%, whereas another segment Perfluoroelastomers (FFKM) based is likely to grow at 6.4%. In terms of countries China is projected to grow at 7.3%, followed by US at 4% and Germany to grow at 2.5%.

High Temperature Elastomers Market Outlook (2025 to 2035)

The global high temperature elastomers market is expected to reach USD 32.5 billion by 2035, up from USD 14.8 billion in 2024. During the forecast period from 2025 to 2035, the industry is projected to expand at a CAGR of 7.4%, driven by demand from the automotive, aerospace, and industrial sectors, where elastomers are required to perform under high-temperature conditions.

Elastomers, such as silicone, fluorocarbon, and perfluoroelastomers, are being used as seals, gaskets, and insulation as industries seek high-performance materials that can withstand thermal stress. Their adoption is also being supported by technological progress and increasing interest in material longevity and system reliability in high-temperature and mission-critical applications.

High Temperature Elastomers Market

What are the drivers of the High Temperature Elastomers Market?

The global market for high-temperature elastomers is expected to grow due to the increasing demand for thermally stable materials in advanced automotive, aerospace, and other industries. Elastomers such as silicone, fluorocarbon, and perfluoroelastomers are being increasingly used in precision-engineered seals, hoses, and gaskets, as components are subjected to extreme heat, high pressure, and chemical resistance.

Another factor actively contributing to the shift to high-performance elastomeric materials is the increasing emphasis on fuel efficiency and emission-related regulatory requirements. Meanwhile, the functional applicability of elastomers in high-temperature electronics, oil and gas exploration, and next-generation propulsion systems is augmenting their use. The dynamic investments in R&D are improving both commercial uptake and material development for critical applications.

What are the regional trends of the High Temperature Elastomers Market?

The regional dynamics of the high-temperature elastomers market reflect varying levels of industrial maturity, regulatory setups, and the intensity of applications. North America has been at the forefront of innovation-driven adoption, with the aerospace, automotive, and oil and gas sectors representing key areas of use, particularly in the U.S., where OEMs emphasize material performance under thermal stress.

Europe focuses on regulatory conformity and CO2 neutrality, which further promotes the consumption of fluorinated elastomers in electric mobility and green aviation. Germany and France are nations that have been working on material certification and the development of specialty compounds.

Automobile manufacturing, electronics, and energy infrastructure are also experiencing increased consumption in the Asia-Pacific region through rapid industrialization in China, India, and South Korea. Latin America is experiencing growth in petrochemical and transport-related applications, while the Middle East and Africa present emerging opportunities linked to infrastructure development and investment in local manufacturing capabilities.

What are the challenges and restraining factors of the High Temperature Elastomers Market?

The high-temperature elastomers market faces challenges related to price, the complexity of processing, and the performance of the material under different conditions. High-performance elastomers, such as perfluoroelastomers and fluorosilicones, are associated with elevated production costs, which limit their use in sectors where cost sensitivity is a concern.

Moreover, their stringent processing needs necessitate an accurate fabrication space, which hinders compliance by smaller manufacturers. Performance reliability is another concern, particularly when degradation results from chemical incompatibility, repeated thermal cycling, or mechanical fatigue under extreme conditions.

Environmental compliance in synthesis also poses its challenges, especially in Europe. The absence of standardized testing procedures also complicates benchmarking across suppliers, resulting in challenges in material selection and extended timelines for validation by end-users.

Country-Wise Insights

The United States drives innovation in high-temperature elastomer applications

High Temperature Elastomers Market Cagr Analysis By Country

The United States is a leading country in the high-temperature elastomers market, supported by its established aerospace, defense, automotive, and oil and gas industries. Thermal integrity and the availability of materials over long periods, as required by NASA and DoD, are driving the demand for FFKM, fluorosilicone, and silicone elastomers.

United States High Temperature Elastomers Market Value Analysis 2025-2035

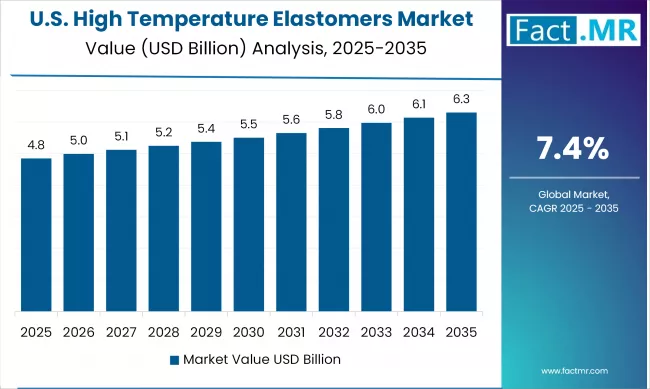
High-temperature insulating materials and thermal gaskets are experiencing increased consumption due to the rise in the manufacturing of EVs. Regulatory requirements, such as CAFE standards and EPA emission standards, are also gaining increased market traction. Key industrial regions, including Texas, Michigan, and California, are experiencing the adoption of advanced elastomers into mission-critical systems, as OEMs and tier-1 suppliers strategically partner in R&D.

Germany leads in automotive-grade high-temperature elastomer integration

The demand for high-temperature elastomers in Germany is driven by the requirements of precision engineering and advanced automotive manufacturing. OEMs such as BMW, Volkswagen, and Mercedes-Benz are utilizing fluorocarbon and silicone elastomers in engine compartment applications that are exposed to elevated temperatures and chemical exposure.

The shift towards e-mobility, turbocharged engines and light systems has further enhanced the elastomeric specification requirements. EU REACH and Blue Angel program regulatory focus is facilitating the use of durable material with low emissions. The presence of high levels of R&D cooperation between polymer suppliers, auto-component makers, and applied science institutes in areas like Bavaria and Baden-Wurttemberg is maintaining German dominance of elastomer formulation and range of application.

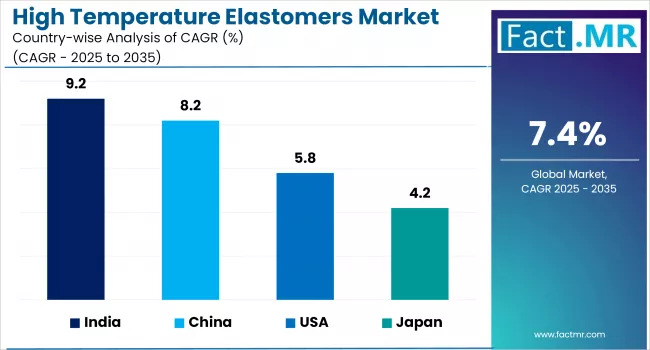
China’s industrial expansion fuels high-temperature elastomer consumption growth

The high-temperature elastomers market in China is expanding gradually, alongside its automotive, electronic, and petrochemical industries. The use of elastomers in the form of thermal sealing, e-mobility insulation, and refinery equipment is being driven by national policies in favor of industrial modernization and emission reduction.

Elastomer-integrated manufacturing is underway in provinces as Jiangsu, Zhejiang and Guangdong. Innovations in EV batteries, high-speed rail, and solar energy components are increasing domestic demand for fluorosilicone and FKM elastomers.

The governmental effort in import substitution in high-performance materials is helping in improving the production rate locally. Moreover, technology is advancing through strategic alliances between Chinese material producers and international chemical companies.

Category-Wise Analysis

FKM elastomers deliver heat and chemical resistance for durability

High Temperature Elastomers Market Analysis By Type

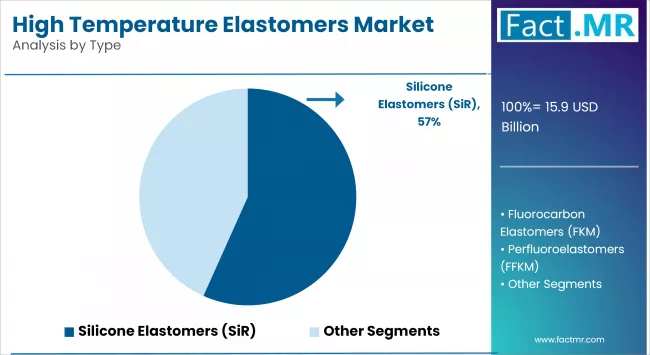
Fluorocarbon elastomers (FKM) are widely used among high temperature elastomers because of their rare ability to withstand high temperatures, fuels, oils and abrasive chemicals. The materials are applied in automotive powertrain systems, aerospace propulsion, and oilfield sealing requirements since these materials are able to maintain mechanical integrity at temperatures above 250°C.

New formulations are being developed to perform in low-compression-set and chemically volatile conditions. Improved thermal cycling and fluid resistance are achieved through FKM elastomers co-formulated with nano-loaders and processable polymer blends. Their extensive integration into emission control systems and high-pressure engine zones has made them a standard solution for OEMs seeking reliable, durable, and regulation-compliant materials for thermally demanding components.

High-temp seals and gaskets ensure performance under thermal stress

High-temperature elastomers have been widely applied in seals and gaskets because they are used universally in maintaining pressure, containing fluids, and providing thermal insulation in most mission-critical systems. Automotive turbochargers, aircraft engines, and chemical reactors require elastomers that can maintain their elastic properties while providing sealing capabilities at elevated temperatures under frequent dynamic mechanical stress.

Superior reliability is now achieved through multilayer and co-extruded sealing systems composed of silicone, FKM, and FFKM. With the electrification, miniaturization, and light-weighting designs, their high-temp sealing solutions will be increasingly application-specific, with a focus on reducing the compression set, the ability to withstand thermal aging, and compatibility with bio-based fuels and lubricants.

Automotive sector drives elastomer demand for thermal reliability solutions

The automotive industry is one of the primary end-use sectors for high-temperature elastomers, driven by the evolution of drivetrain technologies, increased operating temperatures, and regulatory requirements related to emissions and durability. Gaskets, turbo hoses, air intake systems and sensor enclosures are also made of high-performance elastomers that resist thermal variation and chemical exposure.

The increasing adoption of hybrid and electric vehicles is raising the demand for elastomers in battery sealing, thermal insulation systems, and electrical protection valves. OEMs are collaborating with elastomer compounders to develop lightweight, low-VOC, and thermally resistant formulations. As internal combustion engine platforms advance and electrified vehicle architectures expand, the role of thermal elastomers becomes central to component longevity and system reliability.

Competitive Analysis

Key players in the high temperature elastomers industry include Dow, Wacker Chemie AG, Momentive, Shin-Etsu Chemical, Solvay, Daikin Industries, 3M, KCC Corporation, DuPont and China National Bluestar Group Co. Ltd.

Industries are placing increasing emphasis on heat-resistant, chemically stable elastomers that can operate in high-stress conditions across various sectors, including the automotive, aerospace, electronics, and oil and gas industries. The market is experiencing steady growth.

The performance-based formulation with the focus on high-performance demands of OEMs, i.e., to improve durability, thermal integrity, and operational reliability of mission-critical applications, is critical. The product innovation strategies are also being remodeled by the regulatory pressure to emissions and material sustainability.

To fulfill changing thermal and mechanical requirements, manufacturers are investing in advanced fluorosilicone, FFKM, and hybrid polymer technologies. Priorities include achieving low compression set, extended service life, and compatibility with a range of fuels. Strategic efforts include backward integration, expanding regional manufacturing capacity, and forming research and development partnerships. The market remains competitive due to ongoing material differentiation, varied testing protocols, and capabilities in precision molding.

Recent Development

  • In April 2025, DuPont launched a new generation of Viton low-carbon fluoroelastomers with improved thermal stability and a 20 percent reduced carbon footprint, aimed at high-pressure seals in water infrastructure and automotive applications. The technology enhances durability in extreme conditions (up to 220 °C) and reduces production emissions, promoting sustainable infrastructure solutions.
  • In May 2025, Solvay revealed a new high-performance, chemically resistant PEEK elastomer with better performance in the high-pressure fire suppression system and cooling pipelines. It is an innovation made with bio-based additives, which improves lifespan in challenging temperatures (up to 250 °C) and is in compliance with strict environmental regulations.

Fact.MR has provided detailed information about the price points of key manufacturers of the High Temperature Elastomers Market positioned across regions, sales growth, production capacity, and speculative technological expansion, in the recently published report.

Methodology and Industry Tracking Approach

The global high temperature elastomers market report by Fact.MR used the input of 11,800 stakeholders in 30 countries, with at least 300 legitimate actors being interviewed by regional markets. Around 65 percent of the respondents were end users and integrators (e.g., automotive OEMs, aerospace contractors, component molders, and electronics firms), and 35 percent were domain experts (e.g., polymer scientists, materials engineers, and supply chain leaders).

The data gathering period spanned from August 2025 to June 2026, capturing both current and future trends, thermal performance norms, purchase patterns, and developmental preferences related to compliance risks within the value chain of elastomeric materials. All the answers were regionally weighted to follow the dynamics of the global elastomer markets and application density.

More than 280 confirmed records were utilized in the analysis, such as technical datasheets, R&D pipelines, regulatory disclosures, material safety records, and trade reports. The conclusions in the report regarding pricing trends, demand forecasts and competitive position were confirmed with a variety of quantitative models such as multivariate regression and models of the material lifecycle.

With Fact.MR monitoring consumer behavior, product efficacy, industry trends, and market opportunities since 2018, this report is becoming an authoritative source of information that stakeholders can rely on.

Segmentation of High Temperature Elastomers Market

  • By Type :

    • Silicone Elastomers (SiR)
    • Fluorocarbon Elastomers (FKM)
    • Perfluoroelastomers (FFKM)
    • Fluorosilicone Elastomers (FVMQ)
    • Polyacrylate Elastomers (ACM)
    • Ethylene Acrylic Elastomers (AEM)
    • Others
  • By Processing Method :

    • Injection Molding
    • Compression Molding
    • Extrusion
    • 3D Printing / Additive Manufacturing
    • Others (Transfer Molding, etc.)
  • By Application :

    • Seals & Gaskets
    • Hoses & Tubing
    • O-rings
    • Wire & Cable Insulation
    • Engine Components
    • Heat Shields
    • Valve Stems & Connectors
    • Other Custom Molded Parts
  • By End-Use Industry :

    • Automotive
    • Aerospace & Defense
    • Electronics & Semiconductors
    • Oil & Gas
    • Industrial Machinery
    • Energy & Power (including Solar and Wind)
    • Chemical Processing
    • Healthcare & Medical Devices
    • Others (Food Processing, Marine, etc.)
  • By Region :

    • North America
    • Latin America
    • Western Europe
    • Eastern Europe
    • East Asia
    • South Asia & Pacific
    • Middle East & Africa

Table of Content

  1. Executive Summary
    • Global Market Outlook
    • Demand-side Trends
    • Supply-side Trends
    • Technology Roadmap Analysis
    • Analysis and Recommendations
  2. Market Overview
    • Market Coverage / Taxonomy
    • Market Definition / Scope / Limitations
  3. Market Background
    • Market Dynamics
      • Drivers
      • Restraints
      • Opportunity
      • Trends
    • Scenario Forecast
      • Demand in Optimistic Scenario
      • Demand in Likely Scenario
      • Demand in Conservative Scenario
    • Opportunity Map Analysis
    • Product Life Cycle Analysis
    • Supply Chain Analysis
      • Supply Side Participants and their Roles
        • Producers
        • Mid-Level Participants (Traders/ Agents/ Brokers)
        • Wholesalers and Distributors
      • Value Added and Value Created at Node in the Supply Chain
      • List of Raw Material Suppliers
      • List of Existing and Potential Buyer’s
    • Investment Feasibility Matrix
    • Value Chain Analysis
      • Profit Margin Analysis
      • Wholesalers and Distributors
      • Retailers
    • PESTLE and Porter’s Analysis
    • Regulatory Landscape
      • By Key Regions
      • By Key Countries
    • Regional Parent Market Outlook
    • Production and Consumption Statistics
    • Import and Export Statistics
  4. Global Market Analysis 2020 to 2024 and Forecast, 2025 to 2035
    • Historical Market Size Value (USD Bn) & Volume (Tons) Analysis, 2020 to 2024
    • Current and Future Market Size Value (USD Bn) & Volume (Tons) Projections, 2025 to 2035
      • Y-o-Y Growth Trend Analysis
      • Absolute $ Opportunity Analysis
  5. Global Market Pricing Analysis 2020 to 2024 and Forecast 2025 to 2035
  6. Global Market Analysis 2020 to 2024 and Forecast 2025 to 2035, By Type
    • Introduction / Key Findings
    • Historical Market Size Value (USD Bn) & Volume (Tons) Analysis By Type, 2020 to 2024
    • Current and Future Market Size Value (USD Bn) & Volume (Tons) Analysis and Forecast By Type, 2025 to 2035
      • Silicone Elastomers (SiR)
      • Fluorocarbon Elastomers (FKM)
      • Perfluoroelastomers (FFKM)
      • Fluorosilicone Elastomers (FVMQ)
      • Polyacrylate Elastomers (ACM)
      • Ethylene Acrylic Elastomers (AEM)
      • Others
    • Y-o-Y Growth Trend Analysis By Type, 2020 to 2024
    • Absolute $ Opportunity Analysis By Type, 2025 to 2035
  7. Global Market Analysis 2020 to 2024 and Forecast 2025 to 2035, By Processing Method
    • Introduction / Key Findings
    • Historical Market Size Value (USD Bn) & Volume (Tons) Analysis By Processing Method, 2020 to 2024
    • Current and Future Market Size Value (USD Bn) & Volume (Tons) Analysis and Forecast By Processing Method, 2025 to 2035
      • Injection Molding
      • Compression Molding
      • Extrusion
      • 3D Printing / Additive Manufacturing
      • Others (Transfer Molding, etc.)
    • Y-o-Y Growth Trend Analysis By Processing Method, 2020 to 2024
    • Absolute $ Opportunity Analysis By Processing Method, 2025 to 2035
  8. Global Market Analysis 2020 to 2024 and Forecast 2025 to 2035, By Application
    • Introduction / Key Findings
    • Historical Market Size Value (USD Bn) & Volume (Tons) Analysis By Application, 2020 to 2024
    • Current and Future Market Size Value (USD Bn) & Volume (Tons) Analysis and Forecast By Application, 2025 to 2035
      • Seals & Gaskets
      • Hoses & Tubing
      • O-rings
      • Wire & Cable Insulation
      • Engine Components
      • Heat Shields
      • Valve Stems & Connectors
      • Other Custom Molded Parts
    • Y-o-Y Growth Trend Analysis By Application, 2020 to 2024
    • Absolute $ Opportunity Analysis By Application, 2025 to 2035
  9. Global Market Analysis 2020 to 2024 and Forecast 2025 to 2035, By End Use Industry
    • Introduction / Key Findings
    • Historical Market Size Value (USD Bn) & Volume (Tons) Analysis By End Use Industry, 2020 to 2024
    • Current and Future Market Size Value (USD Bn) & Volume (Tons) Analysis and Forecast By End Use Industry, 2025 to 2035
      • Automotive
      • Aerospace & Defense
      • Electronics & Semiconductors
      • Oil & Gas
      • Industrial Machinery
      • Energy & Power (including Solar and Wind)
      • Chemical Processing
      • Healthcare & Medical Devices
      • Others
    • Y-o-Y Growth Trend Analysis By End Use Industry, 2020 to 2024
    • Absolute $ Opportunity Analysis By End Use Industry, 2025 to 2035
  10. Global Market Analysis 2020 to 2024 and Forecast 2025 to 2035, By Region
    • Introduction
    • Historical Market Size Value (USD Bn) & Volume (Tons) Analysis By Region, 2020 to 2024
    • Current Market Size Value (USD Bn) & Volume (Tons) Analysis and Forecast By Region, 2025 to 2035
      • North America
      • Latin America
      • Western Europe
      • East Asia
      • South Asia Pacific
      • Eastern Europe
      • Middle East & Africa
    • Market Attractiveness Analysis By Region
  11. North America Market Analysis 2020 to 2024 and Forecast 2025 to 2035, By Country
    • Historical Market Size Value (USD Bn) & Volume (Tons) Trend Analysis By Market Taxonomy, 2020 to 2024
    • Market Size Value (USD Bn) & Volume (Tons) Forecast By Market Taxonomy, 2025 to 2035
      • By Country
        • U.S.
        • Canada
        • Mexico
      • By Type
      • By Processing Method
      • By Application
      • By End Use Industry
    • Market Attractiveness Analysis
      • By Country
      • By Type
      • By Processing Method
      • By Application
      • By End Use Industry
    • Key Takeaways
  12. Latin America Market Analysis 2020 to 2024 and Forecast 2025 to 2035, By Country
    • Historical Market Size Value (USD Bn) & Volume (Tons) Trend Analysis By Market Taxonomy, 2020 to 2024
    • Market Size Value (USD Bn) & Volume (Tons) Forecast By Market Taxonomy, 2025 to 2035
      • By Country
        • Brazil
        • Chile
        • Rest of Latin America
      • By Type
      • By Processing Method
      • By Application
      • By End Use Industry
    • Market Attractiveness Analysis
      • By Country
      • By Type
      • By Processing Method
      • By Application
      • By End Use Industry
    • Key Takeaways
  13. Western Europe Market Analysis 2020 to 2024 and Forecast 2025 to 2035, By Country
    • Historical Market Size Value (USD Bn) & Volume (Tons) Trend Analysis By Market Taxonomy, 2020 to 2024
    • Market Size Value (USD Bn) & Volume (Tons) Forecast By Market Taxonomy, 2025 to 2035
      • By Country
        • Germany
        • Italy
        • France
        • U.K.
        • Spain
        • Russia
        • BENELUX
        • Rest of Europe
      • By Type
      • By Processing Method
      • By Application
      • By End Use Industry
    • Market Attractiveness Analysis
      • By Country
      • By Type
      • By Processing Method
      • By Application
      • By End Use Industry
    • Key Takeaways
  14. East Asia Market Analysis 2020 to 2024 and Forecast 2025 to 2035, By Country
    • Historical Market Size Value (USD Bn) & Volume (Tons) Trend Analysis By Market Taxonomy, 2020 to 2024
    • Market Size Value (USD Bn) & Volume (Tons) Forecast By Market Taxonomy, 2025 to 2035
      • By Country
        • China
        • Japan
        • South Korea
      • By Type
      • By Processing Method
      • By Application
      • By End Use Industry
    • Market Attractiveness Analysis
      • By Country
      • By Type
      • By Processing Method
      • By Application
      • By End Use Industry
    • Key Takeaways
  15. South Asia Pacific Market Analysis 2020 to 2024 and Forecast 2025 to 2035, By Country
    • Historical Market Size Value (USD Bn) & Volume (Tons) Trend Analysis By Market Taxonomy, 2020 to 2024
    • Market Size Value (USD Bn) & Volume (Tons) Forecast By Market Taxonomy, 2025 to 2035
      • By Country
        • India
        • ASEAN Countries
        • Australia & New Zealand
        • Rest of South Asia Pacific
      • By Type
      • By Processing Method
      • By Application
      • By End Use Industry
    • Market Attractiveness Analysis
      • By Country
      • By Type
      • By Processing Method
      • By Application
      • By End Use Industry
    • Key Takeaways
  16. Eastern Europe Market Analysis 2020 to 2024 and Forecast 2025 to 2035, By Country
    • Historical Market Size Value (USD Bn) & Volume (Tons) Trend Analysis By Market Taxonomy, 2020 to 2024
    • Market Size Value (USD Bn) & Volume (Tons) Forecast By Market Taxonomy, 2025 to 2035
      • By Country
        • Russia
        • Poland
        • Hungary
        • Balkan & Baltics
        • Rest of Eastern Europe
      • By Type
      • By Processing Method
      • By Application
      • By End Use Industry
    • Market Attractiveness Analysis
      • By Country
      • By Type
      • By Processing Method
      • By Application
      • By End Use Industry
    • Key Takeaways
  17. Middle East & Africa Market Analysis 2020 to 2024 and Forecast 2025 to 2035, By Country
    • Historical Market Size Value (USD Bn) & Volume (Tons) Trend Analysis By Market Taxonomy, 2020 to 2024
    • Market Size Value (USD Bn) & Volume (Tons) Forecast By Market Taxonomy, 2025 to 2035
      • By Country
        • KSA
        • Other GCC Countries
        • Turkiye
        • South Africa
        • Rest of MEA
      • By Type
      • By Processing Method
      • By Application
      • By End Use Industry
    • Market Attractiveness Analysis
      • By Country
      • By Type
      • By Processing Method
      • By Application
      • By End Use Industry
    • Key Takeaways
  18. Key Countries Market Analysis
    • China
      • Pricing Analysis
      • Market Share Analysis, 2024
        • By Type
        • By Processing Method
        • By Application
        • By End Use Industry
    • US
      • Pricing Analysis
      • Market Share Analysis, 2024
        • By Type
        • By Processing Method
        • By Application
        • By End Use Industry
    • Germany
      • Pricing Analysis
      • Market Share Analysis, 2024
        • By Type
        • By Processing Method
        • By Application
        • By End Use Industry
    • Japan
      • Pricing Analysis
      • Market Share Analysis, 2024
        • By Type
        • By Processing Method
        • By Application
        • By End Use Industry
    • India
      • Pricing Analysis
      • Market Share Analysis, 2024
        • By Type
        • By Processing Method
        • By Application
        • By End Use Industry
  19. Market Structure Analysis
    • Competition Dashboard
    • Competition Benchmarking
    • Market Share Analysis of Top Players
      • By Regional
      • By Type
      • By Processing Method
      • By Application
      • By End Use Industry
  20. Competition Analysis
    • Competition Deep Dive
      • Dow
        • Overview
        • Product Portfolio
        • Profitability by Market Segments (Product/Age /Sales Channel/Region)
        • Sales Footprint
        • Strategy Overview
          • Marketing Strategy
          • Product Strategy
          • Channel Strategy
      • Wacker Chemie AG
        • Overview
        • Product Portfolio
        • Profitability by Market Segments (Product/Age /Sales Channel/Region)
        • Sales Footprint
        • Strategy Overview
          • Marketing Strategy
          • Product Strategy
          • Channel Strategy
      • Momentive
        • Overview
        • Product Portfolio
        • Profitability by Market Segments (Product/Age /Sales Channel/Region)
        • Sales Footprint
        • Strategy Overview
          • Marketing Strategy
          • Product Strategy
          • Channel Strategy
      • Shin-Etsu Chemical
        • Overview
        • Product Portfolio
        • Profitability by Market Segments (Product/Age /Sales Channel/Region)
        • Sales Footprint
        • Strategy Overview
          • Marketing Strategy
          • Product Strategy
          • Channel Strategy
      • Solvay
        • Overview
        • Product Portfolio
        • Profitability by Market Segments (Product/Age /Sales Channel/Region)
        • Sales Footprint
        • Strategy Overview
          • Marketing Strategy
          • Product Strategy
          • Channel Strategy
      • Daikin Industries
        • Overview
        • Product Portfolio
        • Profitability by Market Segments (Product/Age /Sales Channel/Region)
        • Sales Footprint
        • Strategy Overview
          • Marketing Strategy
          • Product Strategy
          • Channel Strategy
      • 3M
        • Overview
        • Product Portfolio
        • Profitability by Market Segments (Product/Age /Sales Channel/Region)
        • Sales Footprint
        • Strategy Overview
          • Marketing Strategy
          • Product Strategy
          • Channel Strategy
      • KCC Corporation
        • Overview
        • Product Portfolio
        • Profitability by Market Segments (Product/Age /Sales Channel/Region)
        • Sales Footprint
        • Strategy Overview
          • Marketing Strategy
          • Product Strategy
          • Channel Strategy
      • DuPont
        • Overview
        • Product Portfolio
        • Profitability by Market Segments (Product/Age /Sales Channel/Region)
        • Sales Footprint
        • Strategy Overview
          • Marketing Strategy
          • Product Strategy
          • Channel Strategy
      • China National Bluestar Group Co. Ltd
        • Overview
        • Product Portfolio
        • Profitability by Market Segments (Product/Age /Sales Channel/Region)
        • Sales Footprint
        • Strategy Overview
          • Marketing Strategy
          • Product Strategy
          • Channel Strategy
  21. Assumptions & Acronyms Used
  22. Research Methodology

List Of Table

  • Table 1: Global Market Value (USD Bn) Forecast by Region, 2020 to 2035
  • Table 2: Global Market Volume (Tons) Forecast by Region, 2020 to 2035
  • Table 3: Global Market Value (USD Bn) Forecast by Type, 2020 to 2035
  • Table 4: Global Market Volume (Tons) Forecast by Type, 2020 to 2035
  • Table 5: Global Market Value (USD Bn) Forecast by Processing Method, 2020 to 2035
  • Table 6: Global Market Volume (Tons) Forecast by Processing Method, 2020 to 2035
  • Table 7: Global Market Value (USD Bn) Forecast by Application, 2020 to 2035
  • Table 8: Global Market Volume (Tons) Forecast by Application, 2020 to 2035
  • Table 9: Global Market Value (USD Bn) Forecast by End Use Industry, 2020 to 2035
  • Table 10: Global Market Volume (Tons) Forecast by End Use Industry, 2020 to 2035
  • Table 11: North America Market Value (USD Bn) Forecast by Country, 2020 to 2035
  • Table 12: North America Market Volume (Tons) Forecast by Country, 2020 to 2035
  • Table 13: North America Market Value (USD Bn) Forecast by Type, 2020 to 2035
  • Table 14: North America Market Volume (Tons) Forecast by Type, 2020 to 2035
  • Table 15: North America Market Value (USD Bn) Forecast by Processing Method, 2020 to 2035
  • Table 16: North America Market Volume (Tons) Forecast by Processing Method, 2020 to 2035
  • Table 17: North America Market Value (USD Bn) Forecast by Application, 2020 to 2035
  • Table 18: North America Market Volume (Tons) Forecast by Application, 2020 to 2035
  • Table 19: North America Market Value (USD Bn) Forecast by End Use Industry, 2020 to 2035
  • Table 20: North America Market Volume (Tons) Forecast by End Use Industry, 2020 to 2035
  • Table 21: Latin America Market Value (USD Bn) Forecast by Country, 2020 to 2035
  • Table 22: Latin America Market Volume (Tons) Forecast by Country, 2020 to 2035
  • Table 23: Latin America Market Value (USD Bn) Forecast by Type, 2020 to 2035
  • Table 24: Latin America Market Volume (Tons) Forecast by Type, 2020 to 2035
  • Table 25: Latin America Market Value (USD Bn) Forecast by Processing Method, 2020 to 2035
  • Table 26: Latin America Market Volume (Tons) Forecast by Processing Method, 2020 to 2035
  • Table 27: Latin America Market Value (USD Bn) Forecast by Application, 2020 to 2035
  • Table 28: Latin America Market Volume (Tons) Forecast by Application, 2020 to 2035
  • Table 29: Latin America Market Value (USD Bn) Forecast by End Use Industry, 2020 to 2035
  • Table 30: Latin America Market Volume (Tons) Forecast by End Use Industry, 2020 to 2035
  • Table 31: Western Europe Market Value (USD Bn) Forecast by Country, 2020 to 2035
  • Table 32: Western Europe Market Volume (Tons) Forecast by Country, 2020 to 2035
  • Table 33: Western Europe Market Value (USD Bn) Forecast by Type, 2020 to 2035
  • Table 34: Western Europe Market Volume (Tons) Forecast by Type, 2020 to 2035
  • Table 35: Western Europe Market Value (USD Bn) Forecast by Processing Method, 2020 to 2035
  • Table 36: Western Europe Market Volume (Tons) Forecast by Processing Method, 2020 to 2035
  • Table 37: Western Europe Market Value (USD Bn) Forecast by Application, 2020 to 2035
  • Table 38: Western Europe Market Volume (Tons) Forecast by Application, 2020 to 2035
  • Table 39: Western Europe Market Value (USD Bn) Forecast by End Use Industry, 2020 to 2035
  • Table 40: Western Europe Market Volume (Tons) Forecast by End Use Industry, 2020 to 2035
  • Table 41: East Asia Market Value (USD Bn) Forecast by Country, 2020 to 2035
  • Table 42: East Asia Market Volume (Tons) Forecast by Country, 2020 to 2035
  • Table 43: East Asia Market Value (USD Bn) Forecast by Type, 2020 to 2035
  • Table 44: East Asia Market Volume (Tons) Forecast by Type, 2020 to 2035
  • Table 45: East Asia Market Value (USD Bn) Forecast by Processing Method, 2020 to 2035
  • Table 46: East Asia Market Volume (Tons) Forecast by Processing Method, 2020 to 2035
  • Table 47: East Asia Market Value (USD Bn) Forecast by Application, 2020 to 2035
  • Table 48: East Asia Market Volume (Tons) Forecast by Application, 2020 to 2035
  • Table 49: East Asia Market Value (USD Bn) Forecast by End Use Industry, 2020 to 2035
  • Table 50: East Asia Market Volume (Tons) Forecast by End Use Industry, 2020 to 2035
  • Table 51: South Asia Pacific Market Value (USD Bn) Forecast by Country, 2020 to 2035
  • Table 52: South Asia Pacific Market Volume (Tons) Forecast by Country, 2020 to 2035
  • Table 53: South Asia Pacific Market Value (USD Bn) Forecast by Type, 2020 to 2035
  • Table 54: South Asia Pacific Market Volume (Tons) Forecast by Type, 2020 to 2035
  • Table 55: South Asia Pacific Market Value (USD Bn) Forecast by Processing Method, 2020 to 2035
  • Table 56: South Asia Pacific Market Volume (Tons) Forecast by Processing Method, 2020 to 2035
  • Table 57: South Asia Pacific Market Value (USD Bn) Forecast by Application, 2020 to 2035
  • Table 58: South Asia Pacific Market Volume (Tons) Forecast by Application, 2020 to 2035
  • Table 59: South Asia Pacific Market Value (USD Bn) Forecast by End Use Industry, 2020 to 2035
  • Table 60: South Asia Pacific Market Volume (Tons) Forecast by End Use Industry, 2020 to 2035
  • Table 61: Eastern Europe Market Value (USD Bn) Forecast by Country, 2020 to 2035
  • Table 62: Eastern Europe Market Volume (Tons) Forecast by Country, 2020 to 2035
  • Table 63: Eastern Europe Market Value (USD Bn) Forecast by Type, 2020 to 2035
  • Table 64: Eastern Europe Market Volume (Tons) Forecast by Type, 2020 to 2035
  • Table 65: Eastern Europe Market Value (USD Bn) Forecast by Processing Method, 2020 to 2035
  • Table 66: Eastern Europe Market Volume (Tons) Forecast by Processing Method, 2020 to 2035
  • Table 67: Eastern Europe Market Value (USD Bn) Forecast by Application, 2020 to 2035
  • Table 68: Eastern Europe Market Volume (Tons) Forecast by Application, 2020 to 2035
  • Table 69: Eastern Europe Market Value (USD Bn) Forecast by End Use Industry, 2020 to 2035
  • Table 70: Eastern Europe Market Volume (Tons) Forecast by End Use Industry, 2020 to 2035
  • Table 71: Middle East & Africa Market Value (USD Bn) Forecast by Country, 2020 to 2035
  • Table 72: Middle East & Africa Market Volume (Tons) Forecast by Country, 2020 to 2035
  • Table 73: Middle East & Africa Market Value (USD Bn) Forecast by Type, 2020 to 2035
  • Table 74: Middle East & Africa Market Volume (Tons) Forecast by Type, 2020 to 2035
  • Table 75: Middle East & Africa Market Value (USD Bn) Forecast by Processing Method, 2020 to 2035
  • Table 76: Middle East & Africa Market Volume (Tons) Forecast by Processing Method, 2020 to 2035
  • Table 77: Middle East & Africa Market Value (USD Bn) Forecast by Application, 2020 to 2035
  • Table 78: Middle East & Africa Market Volume (Tons) Forecast by Application, 2020 to 2035
  • Table 79: Middle East & Africa Market Value (USD Bn) Forecast by End Use Industry, 2020 to 2035
  • Table 80: Middle East & Africa Market Volume (Tons) Forecast by End Use Industry, 2020 to 2035

List Of Figures

  • Figure 1: Global Market Volume (Tons) Forecast 2020 to 2035
  • Figure 2: Global Market Pricing Analysis
  • Figure 3: Global Market Value (USD Bn) Forecast 2020 to 2035
  • Figure 4: Global Market Value Share and BPS Analysis by Type, 2025 and 2035
  • Figure 5: Global Market Y-o-Y Growth Comparison by Type, 2025 to 2035
  • Figure 6: Global Market Attractiveness Analysis by Type
  • Figure 7: Global Market Value Share and BPS Analysis by Processing Method, 2025 and 2035
  • Figure 8: Global Market Y-o-Y Growth Comparison by Processing Method, 2025 to 2035
  • Figure 9: Global Market Attractiveness Analysis by Processing Method
  • Figure 10: Global Market Value Share and BPS Analysis by Application, 2025 and 2035
  • Figure 11: Global Market Y-o-Y Growth Comparison by Application, 2025 to 2035
  • Figure 12: Global Market Attractiveness Analysis by Application
  • Figure 13: Global Market Value Share and BPS Analysis by End Use Industry, 2025 and 2035
  • Figure 14: Global Market Y-o-Y Growth Comparison by End Use Industry, 2025 to 2035
  • Figure 15: Global Market Attractiveness Analysis by End Use Industry
  • Figure 16: Global Market Value (USD Bn) Share and BPS Analysis by Region, 2025 and 2035
  • Figure 17: Global Market Y-o-Y Growth Comparison by Region, 2025 to 2035
  • Figure 18: Global Market Attractiveness Analysis by Region
  • Figure 19: North America Market Incremental $ Opportunity, 2025 to 2035
  • Figure 20: Latin America Market Incremental $ Opportunity, 2025 to 2035
  • Figure 21: Western Europe Market Incremental $ Opportunity, 2025 to 2035
  • Figure 22: East Asia Market Incremental $ Opportunity, 2025 to 2035
  • Figure 23: South Asia Pacific Market Incremental $ Opportunity, 2025 to 2035
  • Figure 24: Eastern Europe Market Incremental $ Opportunity, 2025 to 2035
  • Figure 25: Middle East & Africa Market Incremental $ Opportunity, 2025 to 2035
  • Figure 26: North America Market Value Share and BPS Analysis by Country, 2025 and 2035
  • Figure 27: North America Market Value Share and BPS Analysis by Type, 2025 and 2035
  • Figure 28: North America Market Y-o-Y Growth Comparison by Type, 2025 to 2035
  • Figure 29: North America Market Attractiveness Analysis by Type
  • Figure 30: North America Market Value Share and BPS Analysis by Processing Method, 2025 and 2035
  • Figure 31: North America Market Y-o-Y Growth Comparison by Processing Method, 2025 to 2035
  • Figure 32: North America Market Attractiveness Analysis by Processing Method
  • Figure 33: North America Market Value Share and BPS Analysis by Application, 2025 and 2035
  • Figure 34: North America Market Y-o-Y Growth Comparison by Application, 2025 to 2035
  • Figure 35: North America Market Attractiveness Analysis by Application
  • Figure 36: North America Market Value Share and BPS Analysis by End Use Industry, 2025 and 2035
  • Figure 37: North America Market Y-o-Y Growth Comparison by End Use Industry, 2025 to 2035
  • Figure 38: North America Market Attractiveness Analysis by End Use Industry
  • Figure 39: Latin America Market Value Share and BPS Analysis by Country, 2025 and 2035
  • Figure 40: Latin America Market Value Share and BPS Analysis by Type, 2025 and 2035
  • Figure 41: Latin America Market Y-o-Y Growth Comparison by Type, 2025 to 2035
  • Figure 42: Latin America Market Attractiveness Analysis by Type
  • Figure 43: Latin America Market Value Share and BPS Analysis by Processing Method, 2025 and 2035
  • Figure 44: Latin America Market Y-o-Y Growth Comparison by Processing Method, 2025 to 2035
  • Figure 45: Latin America Market Attractiveness Analysis by Processing Method
  • Figure 46: Latin America Market Value Share and BPS Analysis by Application, 2025 and 2035
  • Figure 47: Latin America Market Y-o-Y Growth Comparison by Application, 2025 to 2035
  • Figure 48: Latin America Market Attractiveness Analysis by Application
  • Figure 49: Latin America Market Value Share and BPS Analysis by End Use Industry, 2025 and 2035
  • Figure 50: Latin America Market Y-o-Y Growth Comparison by End Use Industry, 2025 to 2035
  • Figure 51: Latin America Market Attractiveness Analysis by End Use Industry
  • Figure 52: Western Europe Market Value Share and BPS Analysis by Country, 2025 and 2035
  • Figure 53: Western Europe Market Value Share and BPS Analysis by Type, 2025 and 2035
  • Figure 54: Western Europe Market Y-o-Y Growth Comparison by Type, 2025 to 2035
  • Figure 55: Western Europe Market Attractiveness Analysis by Type
  • Figure 56: Western Europe Market Value Share and BPS Analysis by Processing Method, 2025 and 2035
  • Figure 57: Western Europe Market Y-o-Y Growth Comparison by Processing Method, 2025 to 2035
  • Figure 58: Western Europe Market Attractiveness Analysis by Processing Method
  • Figure 59: Western Europe Market Value Share and BPS Analysis by Application, 2025 and 2035
  • Figure 60: Western Europe Market Y-o-Y Growth Comparison by Application, 2025 to 2035
  • Figure 61: Western Europe Market Attractiveness Analysis by Application
  • Figure 62: Western Europe Market Value Share and BPS Analysis by End Use Industry, 2025 and 2035
  • Figure 63: Western Europe Market Y-o-Y Growth Comparison by End Use Industry, 2025 to 2035
  • Figure 64: Western Europe Market Attractiveness Analysis by End Use Industry
  • Figure 65: East Asia Market Value Share and BPS Analysis by Country, 2025 and 2035
  • Figure 66: East Asia Market Value Share and BPS Analysis by Type, 2025 and 2035
  • Figure 67: East Asia Market Y-o-Y Growth Comparison by Type, 2025 to 2035
  • Figure 68: East Asia Market Attractiveness Analysis by Type
  • Figure 69: East Asia Market Value Share and BPS Analysis by Processing Method, 2025 and 2035
  • Figure 70: East Asia Market Y-o-Y Growth Comparison by Processing Method, 2025 to 2035
  • Figure 71: East Asia Market Attractiveness Analysis by Processing Method
  • Figure 72: East Asia Market Value Share and BPS Analysis by Application, 2025 and 2035
  • Figure 73: East Asia Market Y-o-Y Growth Comparison by Application, 2025 to 2035
  • Figure 74: East Asia Market Attractiveness Analysis by Application
  • Figure 75: East Asia Market Value Share and BPS Analysis by End Use Industry, 2025 and 2035
  • Figure 76: East Asia Market Y-o-Y Growth Comparison by End Use Industry, 2025 to 2035
  • Figure 77: East Asia Market Attractiveness Analysis by End Use Industry
  • Figure 78: South Asia Pacific Market Value Share and BPS Analysis by Country, 2025 and 2035
  • Figure 79: South Asia Pacific Market Value Share and BPS Analysis by Type, 2025 and 2035
  • Figure 80: South Asia Pacific Market Y-o-Y Growth Comparison by Type, 2025 to 2035
  • Figure 81: South Asia Pacific Market Attractiveness Analysis by Type
  • Figure 82: South Asia Pacific Market Value Share and BPS Analysis by Processing Method, 2025 and 2035
  • Figure 83: South Asia Pacific Market Y-o-Y Growth Comparison by Processing Method, 2025 to 2035
  • Figure 84: South Asia Pacific Market Attractiveness Analysis by Processing Method
  • Figure 85: South Asia Pacific Market Value Share and BPS Analysis by Application, 2025 and 2035
  • Figure 86: South Asia Pacific Market Y-o-Y Growth Comparison by Application, 2025 to 2035
  • Figure 87: South Asia Pacific Market Attractiveness Analysis by Application
  • Figure 88: South Asia Pacific Market Value Share and BPS Analysis by End Use Industry, 2025 and 2035
  • Figure 89: South Asia Pacific Market Y-o-Y Growth Comparison by End Use Industry, 2025 to 2035
  • Figure 90: South Asia Pacific Market Attractiveness Analysis by End Use Industry
  • Figure 91: Eastern Europe Market Value Share and BPS Analysis by Country, 2025 and 2035
  • Figure 92: Eastern Europe Market Value Share and BPS Analysis by Type, 2025 and 2035
  • Figure 93: Eastern Europe Market Y-o-Y Growth Comparison by Type, 2025 to 2035
  • Figure 94: Eastern Europe Market Attractiveness Analysis by Type
  • Figure 95: Eastern Europe Market Value Share and BPS Analysis by Processing Method, 2025 and 2035
  • Figure 96: Eastern Europe Market Y-o-Y Growth Comparison by Processing Method, 2025 to 2035
  • Figure 97: Eastern Europe Market Attractiveness Analysis by Processing Method
  • Figure 98: Eastern Europe Market Value Share and BPS Analysis by Application, 2025 and 2035
  • Figure 99: Eastern Europe Market Y-o-Y Growth Comparison by Application, 2025 to 2035
  • Figure 100: Eastern Europe Market Attractiveness Analysis by Application
  • Figure 101: Eastern Europe Market Value Share and BPS Analysis by End Use Industry, 2025 and 2035
  • Figure 102: Eastern Europe Market Y-o-Y Growth Comparison by End Use Industry, 2025 to 2035
  • Figure 103: Eastern Europe Market Attractiveness Analysis by End Use Industry
  • Figure 104: Middle East & Africa Market Value Share and BPS Analysis by Country, 2025 and 2035
  • Figure 105: Middle East & Africa Market Value Share and BPS Analysis by Type, 2025 and 2035
  • Figure 106: Middle East & Africa Market Y-o-Y Growth Comparison by Type, 2025 to 2035
  • Figure 107: Middle East & Africa Market Attractiveness Analysis by Type
  • Figure 108: Middle East & Africa Market Value Share and BPS Analysis by Processing Method, 2025 and 2035
  • Figure 109: Middle East & Africa Market Y-o-Y Growth Comparison by Processing Method, 2025 to 2035
  • Figure 110: Middle East & Africa Market Attractiveness Analysis by Processing Method
  • Figure 111: Middle East & Africa Market Value Share and BPS Analysis by Application, 2025 and 2035
  • Figure 112: Middle East & Africa Market Y-o-Y Growth Comparison by Application, 2025 to 2035
  • Figure 113: Middle East & Africa Market Attractiveness Analysis by Application
  • Figure 114: Middle East & Africa Market Value Share and BPS Analysis by End Use Industry, 2025 and 2035
  • Figure 115: Middle East & Africa Market Y-o-Y Growth Comparison by End Use Industry, 2025 to 2035
  • Figure 116: Middle East & Africa Market Attractiveness Analysis by End Use Industry
  • Figure 117: Global Market - Tier Structure Analysis
  • Figure 118: Global Market - Company Share Analysis

- FAQs -

What was the Global High Temperature Elastomers Market Size Reported by Fact.MR for 2025?

The global high temperature elastomers market was valued at USD 15.9 billion in 2025.

Who are the Major Players Operating in the High Temperature Elastomers Market?

Prominent players in the market are Dow, Wacker Chemie AG, Momentive, Shin-Etsu Chemical, Solvay, Daikin Industries, 3M, KCC Corporation, among others.

What is the Estimated Valuation of the High Temperature Elastomers Market in 2035?

The market is expected to reach a valuation of USD 32.5 billion in 2035.

What Value CAGR did the High Temperature Elastomers Market Exhibit Over the Last Five Years?

The historic growth rate of the high temperature elastomers market was 6.8% from 2020 to 2024.

- Also of Interest -

High Heat Foam Market

High Heat Foam Market Analysis, By Type, By Application, By End Use Industry, and Region - Market Insights 2025 to 2035

High Viscosity Lubricants Market

High Viscosity Lubricants Market Analysis, By Type (Synthetic Lubricants & Mineral-Based Lubricants), By Application (Automotive, Industrial, Marine, and Process Oils), By End User Industry (Automotive, Heavy Machinery, Oil and Gas, and Mining) and Region - Market Insights 2025 to 2035

High Purity Ferric Alum Market

High Purity Ferric Alum Market Analysis, By Type (Industrial Grade, Food Grade), By Form (Granular Form, Composite Forms, Powder Form, and other), By End User Industry (Water treatment, Paper manufacturing, and Textile Processing), and Region - Market Insights 2025 to 2035

High-End Electronic Yarn Market

High-End Electronic Yarn Market Analysis, By Product Type (Conductive Yarns, Optical Yarns, Thermochromic Yarns, Photochromic Yarns, Other Specialty Yarns), By Technology, By Application, and Region - Market Insights 2025 to 2035

High Temperature Elastomers Market

Schedule a Call