High Speed Steel Market
High Speed Steel Market Analysis, By Production Method, By Grade, By Application, By End-Use Industry, and Region - Market Insights 2025 to 2035
Analysis Of High Speed Steel Market Covering 30+ Countries Including Analysis Of US, Canada, UK, Germany, France, Nordics, GCC Countries, Japan, Korea And Many More
High Speed Steel Market Outlook (2025-2035)
The global high-speed steel market is projected to increase from USD 2.9 billion in 2025 to USD 5.5 billion by 2035, with a CAGR of 6.6% during the forecast period. The increasing demand for strong precision cutting tools in industrial automation drives growth. Their use makes them ideal for applications requiring high wear resistance, hardness at elevated temperatures, and reliable performance in sectors like metal cutting, automotive, and heavy machinery.
Quick Facts about High Speed Steel Market
- Industry Value (2025): USD 2.9 Billion
- Projected Value (2035): USD 5.5 Billion
- Forecast CAGR (2025 to 2035): 6.6%
- Leading Segment (2025): Powder Metallurgy (PM) HSS (36% Market Share)
- Country Growth Rate (2025 to 2035): China (8.1% CAGR)
- Top Key Players: Graphite India Ltd., NACHI-FUJIKOSHI CORP., Tiangong International Co. Ltd., and ThyssenKrupp AG
What are the Drivers of High Speed Steel Market?
The continued growth of global automotive production primarily drives the development of the high-speed steel market. The International Organization of Motor Vehicle Manufacturers (OICA) estimates that global vehicle production will exceed 94 million units in 2023. This expansion increases demand for high-precision, long-lasting tools for machining components such as crankshafts, camshafts, and engine valves, where HSS is preferred for its thermal resistance and long service life.
The aerospace industry's emphasis on high-performance tools drives up HSS demand. Aircraft manufacturers such as Boeing and Airbus need cutting tools that can withstand high temperatures and mechanical stress when machining superalloys and composite materials.
Additionally, the demand for metal cutting tools in the general engineering, maintenance, and fabrication sectors is driving market growth. HSS tools are affordable, easy to regrind, and adaptable, making them appealing to small and medium-sized businesses. These practical benefits ensure consistent consumption across a wide range of industries worldwide.
What are the Regional Trends of High Speed Steel Market?
High-speed steels are also popular in North America and Europe due to established industrial sectors and ongoing R&D. The U.S. is a major North American market with a strong automotive and aerospace industry. Demand for high-performance cutting and drilling tools in these sectors is driving high-speed steel adoption.
High-speed steels are also popular in Europe due to their advanced manufacturing and innovation. Germany, France, and the U.K. are major contributors to the demand for automotive and industrial machinery.
Asia Pacific accounts for the largest share of global high-speed steel demand, led by China, Japan, and India, where rapid industrialization, infrastructure development, and robust manufacturing bases are driving market growth. With significant investments in production and technology, the region's automotive and aerospace industries are growing.
High-speed steel market growth in Latin America and the Middle East & Africa is slower compared to Asia Pacific and North America. In Latin America, countries like Brazil and Mexico are key markets, driven by expanding industrial and manufacturing sectors. Meanwhile, the Middle East & Africa are increasing investments in industrial infrastructure and economic diversification. As demand for high-performance tools rises across construction, mining, and energy industries, the adoption of high-speed steels is growing, supporting steady market expansion in these regions.
What are the Challenges and Restraining Factors of High Speed Steel Market?
High-speed steel (HSS) is up against stiff competition from carbide-based and ceramic cutting tools, which provide superior hardness, cutting speed, and wear resistance. While HSS is inexpensive, its performance limitations in high-speed, high-temperature environments limit its usefulness in modern, automated CNC machining.
Another challenge is the increased use of advanced manufacturing technologies such as laser cutting, waterjet cutting, and additive manufacturing. These non-traditional methods frequently eliminate the need for traditional tooling materials such as HSS, limiting demand in industries shifting toward such innovations.
Environmental regulations and sustainability concerns also present challenges. HSS production requires a lot of energy and produces a lot of emissions, particularly due to the alloys it contains. Stricter environmental compliance standards in developed countries, such as those imposed by the EU's REACH regulations, may raise manufacturing costs or necessitate facility upgrades.
High-speed steel's relatively slower innovation rate when compared to emerging superalloy-based materials has an impact on its competitiveness in high-value applications, particularly aerospace and precision electronics.
Country-Wise Outlook
United States Strong Industrial Base Driving High-Speed Steel Demand
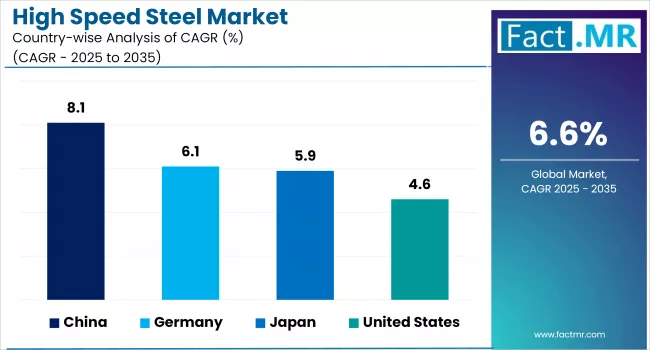
The U.S. advanced manufacturing sector and strong demand for precision tooling. HSS is widely used in industries such as automotive, aerospace, and industrial machinery, where durability, thermal resistance, and cutting performance are essential. The U.S. also has a strong metal fabrication sector, which drives demand for dependable cutting tools.
The resurgence of domestic manufacturing, aided by policies such as the Inflation Reduction Act and reshoring trends, is a significant driver in the U.S. high-speed steel market. This has resulted in more capital investment in machine shops and tool production facilities. For instance, the cutting tools market in the United States alone will exceed $4.3 billion by 2023, with HSS tools accounting for a sizable portion due to their cost-effectiveness and versatility in high-mix, low-volume applications.
The regulatory environment in the U.S. promotes high-quality manufacturing standards. Tool steel grades and performance are governed by ANSI and ASTM specifications, ensuring consistent quality for HSS products produced domestically and imported. The U.S. government also enforces strict safety and environmental regulations through agencies such as OSHA and the EPA, urging businesses to use cleaner and safer toolmaking processes.
China witnesses Rapid Market Growth Backed by Expansive Manufacturing and Industrial Growth
China is the world's leading producer and consumer of high-speed steel, due to its extensive manufacturing base. Because of its superior wear resistance and thermal stability, HSS is in high demand in the country's thriving automotive, toolmaking, and heavy machinery industries.
China continues to invest in R&D to improve metallurgical properties and reduce its reliance on imported high-performance steel. Institutions such as the Central Iron and Steel Research Institute (CISRI) have worked with domestic manufacturers to improve the performance of cobalt-free and environmentally friendly HSS grades, which are becoming increasingly popular due to global sustainability demands.
The "Made in China 2025" initiative has emphasized advanced manufacturing and material innovation, with a focus on upgrading domestic tooling technologies. Furthermore, environmental regulations are encouraging cleaner steel processing methods, influencing the market to adopt higher-efficiency, lower-emission HSS production methods.
With the rapid growth of the electric vehicle (EV) industry, companies such as BYD and CATL are increasingly in need of precision dies and cutting tools for battery casings and lightweight materials, applications where HSS remains critical. This demand is driving local producers to create more specialized grades of high-speed steel.
Japan's Precision Industries Fuel High-Speed Steel Demand
Japan is a key player in the global high-speed steel market, owing to its precision-oriented industrial sectors. The automotive, electronics, and metal tooling industries in the country all require high-quality cutting tools that are efficient and perform well. HSS remains a popular material due to its ability to maintain hardness at high temperatures, making it ideal for high-precision machining applications.
One of the main drivers is Japan's strong automotive manufacturing base. With brands such as Toyota, Honda, and Nissan maintaining global production standards, there is a steady demand for long-lasting cutting and drilling equipment. HSS tools are widely used in the manufacturing of engine and transmission parts, where wear resistance and dimensional accuracy are critical.
Increasing use of advanced coatings like TiAlN (Titanium Aluminium Nitride) on HSS tools to improve longevity and efficiency. Japanese manufacturers are investing in R&D to develop coated HSS variants that can compete with carbide tools, particularly in applications requiring flexibility and cost efficiency.
In terms of regulation, Japan adheres to strict industrial safety and quality standards (for example, JIS Japanese Industrial Standards), ensuring that HSS products used in the country meet high-performance and environmental compliance standards. These standards encourage domestic manufacturers to produce high-quality HSS products that compete globally.
Category-wise Analysis
Powder Metallurgy (PM) to Exhibit Leading by Production Method
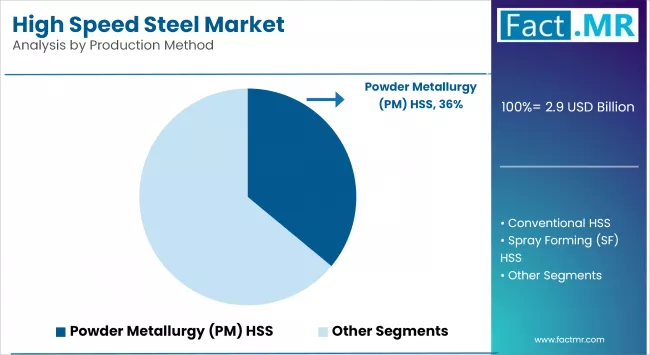
Powder Metallurgy (PM) HSS dominates the high-speed steel market. High-speed steel is made by compacting and sintering metal powders. This method controls alloy composition precisely, improving uniformity and alloying component addition. Powder-produced steel formation produces a homogeneous microstructure with finer, more uniform carbide dispersion, improving dimensional stability, grindability, and toughness.
This technology can also make highly alloyed grades that standard steelmaking cannot. It is increasingly used for mechanical and CNC tooling. Except for high-temperature alloys and exotics, it can be used for grinding.
Conventional HSS is the fastest-growing segment in the high-speed steel market, due to its use of a variety of cutting tools, drills, taps, and other applications that require both high-speed machining and durability. Traditional methods of producing conventional HSS include ingot casting and forging. The alloy is melted and cast, then hot worked into the desired shapes, such as bars, sheets, or billets.
For many years, conventional HSS manufacturing processes were widely used. The resulting material, like high-speed steels, has excellent hardness, wear, and heat resistance.
T-type to Exhibit Leading by Grade
T-type high-speed steels dominate the high-speed steel market. T-type high-speed steels, which contain tungsten, are well-known for their high hardness and heat resistance. These steels are widely used in applications requiring high operating temperatures.
Their ability to maintain hardness at high temperatures makes them ideal for heavy-duty cutting tools and applications requiring significant thermal stability. The growing demand for high-performance tools in industries like automotive and aerospace is driving the use of T-type high-speed steels.
M-type high-speed steels are the fastest-growing segment in the high speed steel market, as these molybdenum-based and have excellent wear resistance and toughness. These steels are commonly used in applications requiring high durability and longevity.
M-type high-speed steels are especially popular in manufacturing environments where wear and tear resistance is critical, such as the manufacture of high-precision cutting and drilling tools. The increased emphasis on efficiency and cost-effectiveness in manufacturing processes is driving up demand for M-type high-speed steels.
Cutting Tools to Exhibit Leading by Application
Cutting tools dominate the high-speed steel market, driven by the demand for high-precision and long-lasting tools in a variety of manufacturing processes. High-speed steels are required for the production of cutting tools that can maintain their sharpness and performance even at high speeds and temperatures. High-speed steel cutting tools are particularly important in the automotive and aerospace industries for producing complex components efficiently.
Milling tools are the fastest-growing segment in the high speed steel market, due to their ability to deliver high performance and precision. High-speed steel milling tools are used in a variety of machining processes to shape and form materials precisely. High-speed steel milling tools are particularly beneficial to the industrial machinery sector because they increase productivity and reduce downtime.
Continued advancements in milling technology, as well as the growing adoption of automation in manufacturing, are expected to drive up demand for high-speed steels in this application.
Automobile to Exhibit Leading by End-Use Industry
The automobile industry dominates the high-speed steel market, driven by the need for long-lasting, high-performance tools in the production of automotive components. High-speed steels are required for making cutting and drilling tools that can withstand the high-speed and high-temperature conditions found in automotive manufacturing. The increased production of vehicles, as well as the growing trend toward electric cars, is expected to drive demand for high-speed steels in the automotive sector.
High-speed steels are the fastest-growing segment, as these are used in the aerospace industry to make a variety of components with high strength and thermal stability. High-speed steels' ability to retain hardness and performance at high temperatures makes them ideal for aerospace applications.
The continued growth of air travel and advancements in aerospace technology are driving up demand for high-speed steels in this industry. The aerospace industry's emphasis on precision and dependability highlights the significance of high-speed steels in this market.
Competitive Analysis
The global High-Speed Steel (HSS) market is becoming increasingly competitive, distinguished by technological innovation, a diverse product offering, and a strong presence of both global and regional players. Manufacturers compete based on material performance, cost-efficiency, durability, and the ability to meet end-user-specific requirements.
Major players are constantly investing in R&D to improve the toughness, heat resistance, and wear resistance of their HSS products. This innovation is especially significant in industries like automotive, aerospace, and industrial machinery, where cutting precision and thermal stability are critical.
HSS manufacturers are increasingly focusing on tailored grades to serve specific applications. Due to its superior heat tolerance, cobalt-based HSS is increasingly being used in aerospace and heavy-duty machining. Manufacturers are also developing hybrid alloys and coating technologies (such as TiN or AlTiN coatings) to increase tool life and reduce downtime, improving overall market competitiveness. As end-user industries change, particularly with the shift toward lighter-weight and more difficult-to-machine materials such as titanium and composites, HSS manufacturers must adapt to the evolving needs and performance benchmarks.
Sustainability is also emerging as a competitive factor. To meet increasing environmental regulations, companies are incorporating eco-friendly production methods and recyclable steel content. The incorporation of AI and smart manufacturing processes into HSS production improves product quality while lowering manufacturing waste.
Key players in the high-speed steel industry include Erasteel, Kennametal, Voestalpine AG, Graphite India Ltd., NACHI-FUJIKOSHI CORP., Tiangong International Co., Ltd, ThyssenKrupp AG, Sandvik AB, Hitachi Metals Ltd., DAIDO STEEL, and other players.
Recent Development
- In December 2024, Sumitomo Electric Industries introduced the SumiDrill™ GDX series, an indexable insert drill. These drills are designed to be cost-effective, reduce carbide usage, and eliminate the need for regrinding, making them particularly suitable for industries such as automotive.
- In December 2023, Dormer Pramet, a leading global manufacturer and supplier of metal cutting tools and part of the Sandvik Group, launched an expanded product line specifically tailored for the Indian market. This introduction aimed to meet the increasing demand for enhanced productivity and cost-efficiency in India's evolving engineering landscape.
Segmentation of High Speed Steel Market
-
By Production Method :
- Conventional HSS
- Powder Metallurgy (PM) HSS
- Spray Forming (SF) HSS
-
By Grade :
- M Grade
- T Grade
- Advance Grade
-
By Application :
- Cutting Tools
- Drills
- Taps
- Milling Cutters
- Tools Bits
- Hobbing Cutters
- Saw Blades
- Router Bits
- Metal Cutting
- Milling
- Others
- Cutting Tools
-
By End-Use Industry :
- Automobiles
- Manufacturing
- Aerospace
- Mechanical Engineering
- Construction
- Others
-
By Region :
- North America
- Latin America
- Western Europe
- Eastern Europe
- East Asia
- South Asia & Pacific
- Middle East & Africa
Table of Content
- Executive Summary
- Global Market Outlook
- Demand-side Trends
- Supply-side Trends
- Technology Roadmap Analysis
- Analysis and Recommendations
- Market Overview
- Market Coverage / Taxonomy
- Market Definition / Scope / Limitations
- Market Background
- Market Dynamics
- Drivers
- Restraints
- Opportunity
- Trends
- Scenario Forecast
- Demand in Optimistic Scenario
- Demand in Likely Scenario
- Demand in Conservative Scenario
- Opportunity Map Analysis
- Product Life Cycle Analysis
- Supply Chain Analysis
- Supply Side Participants and their Roles
- Producers
- Mid-Level Participants (Traders/ Agents/ Brokers)
- Wholesalers and Distributors
- Value Added and Value Created at Node in the Supply Chain
- List of Raw Material Suppliers
- List of Existing and Potential Buyers
- Supply Side Participants and their Roles
- Investment Feasibility Matrix
- Value Chain Analysis
- Profit Margin Analysis
- Wholesalers and Distributors
- Retailers
- PESTLE and Porter’s Analysis
- Regulatory Landscape
- By Key Regions
- By Key Countries
- Production and Consumption Statistics
- Import and Export Statistics
- Market Dynamics
- Global Market Analysis 2020-2024 and Forecast, 2025-2035
- Historical Market Size Value (USD Bn) & Volume (Tons) Analysis, 2020-2024
- Current and Future Market Size Value (USD Bn) & Volume (Tons) Projections, 2025-2035
- Y-o-Y Growth Trend Analysis
- Absolute $ Opportunity Analysis
- Global Market Pricing Analysis 2020-2024 and Forecast 2025-2035
- Global Market Analysis 2020-2024 and Forecast 2025-2035, By Production Method
- Introduction / Key Findings
- Historical Market Size Value (USD Bn) & Volume (Tons) Analysis By Production Method, 2020-2024
- Current and Future Market Size Value (USD Bn) & Volume (Tons) Analysis and Forecast By Production Method, 2025-2035
- Conventional HSS
- Powder Metallurgy (PM) HSS
- Spray Forming (SF) HSS
- Y-o-Y Growth Trend Analysis By Production Method, 2020-2024
- Absolute $ Opportunity Analysis By Production Method, 2025-2035
- Global Market Analysis 2020-2024 and Forecast 2025-2035, By Grade
- Introduction / Key Findings
- Historical Market Size Value (USD Bn) & Volume (Tons) Analysis By Grade, 2020-2024
- Current and Future Market Size Value (USD Bn) & Volume (Tons) Analysis and Forecast By Grade, 2025-2035
- M Grade
- T Grade
- Advance Grade
- Y-o-Y Growth Trend Analysis By Grade, 2020-2024
- Absolute $ Opportunity Analysis By Grade, 2025-2035
- Global Market Analysis 2020-2024 and Forecast 2025-2035, By Application
- Introduction / Key Findings
- Historical Market Size Value (USD Bn) & Volume (Tons) Analysis By Application, 2020-2024
- Current and Future Market Size Value (USD Bn) & Volume (Tons) Analysis and Forecast By Application, 2025-2035
- Cutting Tools
- Metal Cutting
- Milling
- Others
- Y-o-Y Growth Trend Analysis By Application, 2020-2024
- Absolute $ Opportunity Analysis By Application, 2025-2035
- Global Market Analysis 2020-2024 and Forecast 2025-2035, By End-Use Industry
- Introduction / Key Findings
- Historical Market Size Value (USD Bn) & Volume (Tons) Analysis By End-Use Industry, 2020-2024
- Current and Future Market Size Value (USD Bn) & Volume (Tons) Analysis and Forecast By End-Use Industry, 2025-2035
- Automobiles
- Manufacturing
- Aerospace
- Mechanical Engineering
- Construction
- Others
- Y-o-Y Growth Trend Analysis By End-Use Industry, 2020-2024
- Absolute $ Opportunity Analysis By End-Use Industry, 2025-2035
- Global Market Analysis 2020-2024 and Forecast 2025-2035, By Region
- Introduction
- Historical Market Size Value (USD Bn) & Volume (Tons) Analysis By Region, 2020-2024
- Current Market Size Value (USD Bn) & Volume (Tons) Analysis and Forecast By Region, 2025-2035
- North America
- Latin America
- Western Europe
- East Asia
- South Asia Pacific
- Eastern Europe
- Middle East & Africa
- Market Attractiveness Analysis By Region
- North America Market Analysis 2020-2024 and Forecast 2025-2035, By Country
- Historical Market Size Value (USD Bn) & Volume (Tons) Trend Analysis By Market Taxonomy, 2020-2024
- Market Size Value (USD Bn) & Volume (Tons) Forecast By Market Taxonomy, 2025-2035
- By Country
- U.S.
- Canada
- Mexico
- By Production Method
- By Grade
- By Application
- By End-Use Industry
- By Country
- Market Attractiveness Analysis
- By Country
- By Production Method
- By Grade
- By Application
- By End-Use Industry
- Key Takeaways
- Latin America Market Analysis 2020-2024 and Forecast 2025-2035, By Country
- Historical Market Size Value (USD Bn) & Volume (Tons) Trend Analysis By Market Taxonomy, 2020-2024
- Market Size Value (USD Bn) & Volume (Tons) Forecast By Market Taxonomy, 2025-2035
- By Country
- Brazil
- Chile
- Rest of Latin America
- By Production Method
- By Grade
- By Application
- By End-Use Industry
- By Country
- Market Attractiveness Analysis
- By Country
- By Production Method
- By Grade
- By Application
- By End-Use Industry
- Key Takeaways
- Western Europe Market Analysis 2020-2024 and Forecast 2025-2035, By Country
- Historical Market Size Value (USD Bn) & Volume (Tons) Trend Analysis By Market Taxonomy, 2020-2024
- Market Size Value (USD Bn) & Volume (Tons) Forecast By Market Taxonomy, 2025-2035
- By Country
- Germany
- Italy
- France
- U.K.
- Spain
- Russia
- BENELUX
- Rest of Europe
- By Production Method
- By Grade
- By Application
- By End-Use Industry
- By Country
- Market Attractiveness Analysis
- By Country
- By Production Method
- By Grade
- By Application
- By End-Use Industry
- Key Takeaways
- East Asia Market Analysis 2020-2024 and Forecast 2025-2035, By Country
- Historical Market Size Value (USD Bn) & Volume (Tons) Trend Analysis By Market Taxonomy, 2020-2024
- Market Size Value (USD Bn) & Volume (Tons) Forecast By Market Taxonomy, 2025-2035
- By Country
- China
- Japan
- South Korea
- By Production Method
- By Grade
- By Application
- By End-Use Industry
- By Country
- Market Attractiveness Analysis
- By Country
- By Production Method
- By Grade
- By Application
- By End-Use Industry
- Key Takeaways
- South Asia Pacific Market Analysis 2020-2024 and Forecast 2025-2035, By Country
- Historical Market Size Value (USD Bn) & Volume (Tons) Trend Analysis By Market Taxonomy, 2020-2024
- Market Size Value (USD Bn) & Volume (Tons) Forecast By Market Taxonomy, 2025-2035
- By Country
- India
- ASEAN Countries
- Australia & New Zealand
- Rest of South Asia Pacific
- By Production Method
- By Grade
- By Application
- By End-Use Industry
- By Country
- Market Attractiveness Analysis
- By Country
- By Production Method
- By Grade
- By Application
- By End-Use Industry
- Key Takeaways
- Eastern Europe Market Analysis 2020-2024 and Forecast 2025-2035, By Country
- Historical Market Size Value (USD Bn) & Volume (Tons) Trend Analysis By Market Taxonomy, 2020-2024
- Market Size Value (USD Bn) & Volume (Tons) Forecast By Market Taxonomy, 2025-2035
- By Country
- Russia
- Poland
- Hungary
- Balkan & Baltics
- Rest of Eastern Europe
- By Production Method
- By Grade
- By Application
- By End-Use Industry
- By Country
- Market Attractiveness Analysis
- By Country
- By Production Method
- By Grade
- By Application
- By End-Use Industry
- Key Takeaways
- Middle East & Africa Market Analysis 2020-2024 and Forecast 2025-2035, By Country
- Historical Market Size Value (USD Bn) & Volume (Tons) Trend Analysis By Market Taxonomy, 2020-2024
- Market Size Value (USD Bn) & Volume (Tons) Forecast By Market Taxonomy, 2025-2035
- By Country
- KSA
- Other GCC Countries
- Turkiye
- South Africa
- Rest of MEA
- By Production Method
- By Grade
- By Application
- By End-Use Industry
- By Country
- Market Attractiveness Analysis
- By Country
- By Production Method
- By Grade
- By Application
- By End-Use Industry
- Key Takeaways
- Key Countries Market Analysis
- China
- Pricing Analysis
- Market Share Analysis, 2024
- By Production Method
- By Grade
- By Application
- By End-Use Industry
- U.S.
- Pricing Analysis
- Market Share Analysis, 2024
- By Production Method
- By Grade
- By Application
- By End-Use Industry
- Germany
- Pricing Analysis
- Market Share Analysis, 2024
- By Production Method
- By Grade
- By Application
- By End-Use Industry
- Japan
- Pricing Analysis
- Market Share Analysis, 2024
- By Production Method
- By Grade
- By Application
- By End-Use Industry
- India
- Pricing Analysis
- Market Share Analysis, 2024
- By Production Method
- By Grade
- By Application
- By End-Use Industry
- China
- Market Structure Analysis
- Competition Dashboard
- Competition Benchmarking
- Market Share Analysis of Top Players
- By Regional
- By Production Method
- By Grade
- By Application
- By End-Use Industry
- Competition Analysis
- Competition Deep Dive
- Graphite India Ltd.
- Overview
- Product Portfolio
- Profitability by Market Segments (Product/Age /Sales Channel/Region)
- Sales Footprint
- Strategy Overview
- Marketing Strategy
- Product Strategy
- Channel Strategy
- NACHI-FUJIKOSHI CORP.
- Overview
- Product Portfolio
- Profitability by Market Segments (Product/Age /Sales Channel/Region)
- Sales Footprint
- Strategy Overview
- Marketing Strategy
- Product Strategy
- Channel Strategy
- Tiangong International Co. Ltd
- Overview
- Product Portfolio
- Profitability by Market Segments (Product/Age /Sales Channel/Region)
- Sales Footprint
- Strategy Overview
- Marketing Strategy
- Product Strategy
- Channel Strategy
- ThyssenKrupp AG
- Overview
- Product Portfolio
- Profitability by Market Segments (Product/Age /Sales Channel/Region)
- Sales Footprint
- Strategy Overview
- Marketing Strategy
- Product Strategy
- Channel Strategy
- Sandvik AB
- Overview
- Product Portfolio
- Profitability by Market Segments (Product/Age /Sales Channel/Region)
- Sales Footprint
- Strategy Overview
- Marketing Strategy
- Product Strategy
- Channel Strategy
- Graphite India Ltd.
- Competition Deep Dive
- Assumptions & Acronyms Used
- Research Methodology
List Of Table
- Table 1: Global Market Value (USD Bn) Forecast by Region, 2020 to 2035
- Table 2: Global Market Volume (Tons) Forecast by Region, 2020 to 2035
- Table 3: Global Market Value (USD Bn) Forecast by Production Method, 2020 to 2035
- Table 4: Global Market Volume (Tons) Forecast by Production Method, 2020 to 2035
- Table 5: Global Market Value (USD Bn) Forecast by Grade, 2020 to 2035
- Table 6: Global Market Volume (Tons) Forecast by Grade, 2020 to 2035
- Table 7: Global Market Value (USD Bn) Forecast by Application, 2020 to 2035
- Table 8: Global Market Volume (Tons) Forecast by Application, 2020 to 2035
- Table 9: Global Market Value (USD Bn) Forecast by End-Use Industry, 2020 to 2035
- Table 10: Global Market Volume (Tons) Forecast by End-Use Industry, 2020 to 2035
- Table 11: North America Market Value (USD Bn) Forecast by Country, 2020 to 2035
- Table 12: North America Market Volume (Tons) Forecast by Country, 2020 to 2035
- Table 13: North America Market Value (USD Bn) Forecast by Production Method, 2020 to 2035
- Table 14: North America Market Volume (Tons) Forecast by Production Method, 2020 to 2035
- Table 15: North America Market Value (USD Bn) Forecast by Grade, 2020 to 2035
- Table 16: North America Market Volume (Tons) Forecast by Grade, 2020 to 2035
- Table 17: North America Market Value (USD Bn) Forecast by Application, 2020 to 2035
- Table 18: North America Market Volume (Tons) Forecast by Application, 2020 to 2035
- Table 19: North America Market Value (USD Bn) Forecast by End-Use Industry, 2020 to 2035
- Table 20: North America Market Volume (Tons) Forecast by End-Use Industry, 2020 to 2035
- Table 21: Latin America Market Value (USD Bn) Forecast by Country, 2020 to 2035
- Table 22: Latin America Market Volume (Tons) Forecast by Country, 2020 to 2035
- Table 23: Latin America Market Value (USD Bn) Forecast by Production Method, 2020 to 2035
- Table 24: Latin America Market Volume (Tons) Forecast by Production Method, 2020 to 2035
- Table 25: Latin America Market Value (USD Bn) Forecast by Grade, 2020 to 2035
- Table 26: Latin America Market Volume (Tons) Forecast by Grade, 2020 to 2035
- Table 27: Latin America Market Value (USD Bn) Forecast by Application, 2020 to 2035
- Table 28: Latin America Market Volume (Tons) Forecast by Application, 2020 to 2035
- Table 29: Latin America Market Value (USD Bn) Forecast by End-Use Industry, 2020 to 2035
- Table 30: Latin America Market Volume (Tons) Forecast by End-Use Industry, 2020 to 2035
- Table 31: Western Europe Market Value (USD Bn) Forecast by Country, 2020 to 2035
- Table 32: Western Europe Market Volume (Tons) Forecast by Country, 2020 to 2035
- Table 33: Western Europe Market Value (USD Bn) Forecast by Production Method, 2020 to 2035
- Table 34: Western Europe Market Volume (Tons) Forecast by Production Method, 2020 to 2035
- Table 35: Western Europe Market Value (USD Bn) Forecast by Grade, 2020 to 2035
- Table 36: Western Europe Market Volume (Tons) Forecast by Grade, 2020 to 2035
- Table 37: Western Europe Market Value (USD Bn) Forecast by Application, 2020 to 2035
- Table 38: Western Europe Market Volume (Tons) Forecast by Application, 2020 to 2035
- Table 39: Western Europe Market Value (USD Bn) Forecast by End-Use Industry, 2020 to 2035
- Table 40: Western Europe Market Volume (Tons) Forecast by End-Use Industry, 2020 to 2035
- Table 41: East Asia Market Value (USD Bn) Forecast by Country, 2020 to 2035
- Table 42: East Asia Market Volume (Tons) Forecast by Country, 2020 to 2035
- Table 43: East Asia Market Value (USD Bn) Forecast by Production Method, 2020 to 2035
- Table 44: East Asia Market Volume (Tons) Forecast by Production Method, 2020 to 2035
- Table 45: East Asia Market Value (USD Bn) Forecast by Grade, 2020 to 2035
- Table 46: East Asia Market Volume (Tons) Forecast by Grade, 2020 to 2035
- Table 47: East Asia Market Value (USD Bn) Forecast by Application, 2020 to 2035
- Table 48: East Asia Market Volume (Tons) Forecast by Application, 2020 to 2035
- Table 49: East Asia Market Value (USD Bn) Forecast by End-Use Industry, 2020 to 2035
- Table 50: East Asia Market Volume (Tons) Forecast by End-Use Industry, 2020 to 2035
- Table 51: South Asia Pacific Market Value (USD Bn) Forecast by Country, 2020 to 2035
- Table 52: South Asia Pacific Market Volume (Tons) Forecast by Country, 2020 to 2035
- Table 53: South Asia Pacific Market Value (USD Bn) Forecast by Production Method, 2020 to 2035
- Table 54: South Asia Pacific Market Volume (Tons) Forecast by Production Method, 2020 to 2035
- Table 55: South Asia Pacific Market Value (USD Bn) Forecast by Grade, 2020 to 2035
- Table 56: South Asia Pacific Market Volume (Tons) Forecast by Grade, 2020 to 2035
- Table 57: South Asia Pacific Market Value (USD Bn) Forecast by Application, 2020 to 2035
- Table 58: South Asia Pacific Market Volume (Tons) Forecast by Application, 2020 to 2035
- Table 59: South Asia Pacific Market Value (USD Bn) Forecast by End-Use Industry, 2020 to 2035
- Table 60: South Asia Pacific Market Volume (Tons) Forecast by End-Use Industry, 2020 to 2035
- Table 61: Eastern Europe Market Value (USD Bn) Forecast by Country, 2020 to 2035
- Table 62: Eastern Europe Market Volume (Tons) Forecast by Country, 2020 to 2035
- Table 63: Eastern Europe Market Value (USD Bn) Forecast by Production Method, 2020 to 2035
- Table 64: Eastern Europe Market Volume (Tons) Forecast by Production Method, 2020 to 2035
- Table 65: Eastern Europe Market Value (USD Bn) Forecast by Grade, 2020 to 2035
- Table 66: Eastern Europe Market Volume (Tons) Forecast by Grade, 2020 to 2035
- Table 67: Eastern Europe Market Value (USD Bn) Forecast by Application, 2020 to 2035
- Table 68: Eastern Europe Market Volume (Tons) Forecast by Application, 2020 to 2035
- Table 69: Eastern Europe Market Value (USD Bn) Forecast by End-Use Industry, 2020 to 2035
- Table 70: Eastern Europe Market Volume (Tons) Forecast by End-Use Industry, 2020 to 2035
- Table 71: Middle East & Africa Market Value (USD Bn) Forecast by Country, 2020 to 2035
- Table 72: Middle East & Africa Market Volume (Tons) Forecast by Country, 2020 to 2035
- Table 73: Middle East & Africa Market Value (USD Bn) Forecast by Production Method, 2020 to 2035
- Table 74: Middle East & Africa Market Volume (Tons) Forecast by Production Method, 2020 to 2035
- Table 75: Middle East & Africa Market Value (USD Bn) Forecast by Grade, 2020 to 2035
- Table 76: Middle East & Africa Market Volume (Tons) Forecast by Grade, 2020 to 2035
- Table 77: Middle East & Africa Market Value (USD Bn) Forecast by Application, 2020 to 2035
- Table 78: Middle East & Africa Market Volume (Tons) Forecast by Application, 2020 to 2035
- Table 79: Middle East & Africa Market Value (USD Bn) Forecast by End-Use Industry, 2020 to 2035
- Table 80: Middle East & Africa Market Volume (Tons) Forecast by End-Use Industry, 2020 to 2035
List Of Figures
- Figure 1: Global Market Volume (Tons) Forecast 2020 to 2035
- Figure 2: Global Market Pricing Analysis
- Figure 3: Global Market Value (USD Bn) Forecast 2020 to 2035
- Figure 4: Global Market Value Share and BPS Analysis by Production Method, 2025 to 2035
- Figure 5: Global Market Y-o-Y Growth Comparison by Production Method, 2025 to 2035
- Figure 6: Global Market Attractiveness Analysis by Production Method
- Figure 7: Global Market Value Share and BPS Analysis by Grade, 2025 to 2035
- Figure 8: Global Market Y-o-Y Growth Comparison by Grade, 2025 to 2035
- Figure 9: Global Market Attractiveness Analysis by Grade
- Figure 10: Global Market Value Share and BPS Analysis by Application, 2025 to 2035
- Figure 11: Global Market Y-o-Y Growth Comparison by Application, 2025 to 2035
- Figure 12: Global Market Attractiveness Analysis by Application
- Figure 13: Global Market Value Share and BPS Analysis by End-Use Industry, 2025 to 2035
- Figure 14: Global Market Y-o-Y Growth Comparison by End-Use Industry, 2025 to 2035
- Figure 15: Global Market Attractiveness Analysis by End-Use Industry
- Figure 16: Global Market Value (USD Bn) Share and BPS Analysis by Region, 2025 to 2035
- Figure 17: Global Market Y-o-Y Growth Comparison by Region, 2025 to 2035
- Figure 18: Global Market Attractiveness Analysis by Region
- Figure 19: North America Market Incremental $ Opportunity, 2025 to 2035
- Figure 20: Latin America Market Incremental $ Opportunity, 2025 to 2035
- Figure 21: Western Europe Market Incremental $ Opportunity, 2025 to 2035
- Figure 22: East Asia Market Incremental $ Opportunity, 2025 to 2035
- Figure 23: South Asia Pacific Market Incremental $ Opportunity, 2025 to 2035
- Figure 24: Eastern Europe Market Incremental $ Opportunity, 2025 to 2035
- Figure 25: Middle East & Africa Market Incremental $ Opportunity, 2025 to 2035
- Figure 26: North America Market Value Share and BPS Analysis by Country, 2025 to 2035
- Figure 27: North America Market Value Share and BPS Analysis by Production Method, 2025 to 2035
- Figure 28: North America Market Y-o-Y Growth Comparison by Production Method, 2025 to 2035
- Figure 29: North America Market Attractiveness Analysis by Production Method
- Figure 30: North America Market Value Share and BPS Analysis by Grade, 2025 to 2035
- Figure 31: North America Market Y-o-Y Growth Comparison by Grade, 2025 to 2035
- Figure 32: North America Market Attractiveness Analysis by Grade
- Figure 33: North America Market Value Share and BPS Analysis by Application, 2025 to 2035
- Figure 34: North America Market Y-o-Y Growth Comparison by Application, 2025 to 2035
- Figure 35: North America Market Attractiveness Analysis by Application
- Figure 36: North America Market Value Share and BPS Analysis by End-Use Industry, 2025 to 2035
- Figure 37: North America Market Y-o-Y Growth Comparison by End-Use Industry, 2025 to 2035
- Figure 38: North America Market Attractiveness Analysis by End-Use Industry
- Figure 39: Latin America Market Value Share and BPS Analysis by Country, 2025 to 2035
- Figure 40: Latin America Market Value Share and BPS Analysis by Production Method, 2025 to 2035
- Figure 41: Latin America Market Y-o-Y Growth Comparison by Production Method, 2025 to 2035
- Figure 42: Latin America Market Attractiveness Analysis by Production Method
- Figure 43: Latin America Market Value Share and BPS Analysis by Grade, 2025 to 2035
- Figure 44: Latin America Market Y-o-Y Growth Comparison by Grade, 2025 to 2035
- Figure 45: Latin America Market Attractiveness Analysis by Grade
- Figure 46: Latin America Market Value Share and BPS Analysis by Application, 2025 to 2035
- Figure 47: Latin America Market Y-o-Y Growth Comparison by Application, 2025 to 2035
- Figure 48: Latin America Market Attractiveness Analysis by Application
- Figure 49: Latin America Market Value Share and BPS Analysis by End-Use Industry, 2025 to 2035
- Figure 50: Latin America Market Y-o-Y Growth Comparison by End-Use Industry, 2025 to 2035
- Figure 51: Latin America Market Attractiveness Analysis by End-Use Industry
- Figure 52: Western Europe Market Value Share and BPS Analysis by Country, 2025 to 2035
- Figure 53: Western Europe Market Value Share and BPS Analysis by Production Method, 2025 to 2035
- Figure 54: Western Europe Market Y-o-Y Growth Comparison by Production Method, 2025 to 2035
- Figure 55: Western Europe Market Attractiveness Analysis by Production Method
- Figure 56: Western Europe Market Value Share and BPS Analysis by Grade, 2025 to 2035
- Figure 57: Western Europe Market Y-o-Y Growth Comparison by Grade, 2025 to 2035
- Figure 58: Western Europe Market Attractiveness Analysis by Grade
- Figure 59: Western Europe Market Value Share and BPS Analysis by Application, 2025 to 2035
- Figure 60: Western Europe Market Y-o-Y Growth Comparison by Application, 2025 to 2035
- Figure 61: Western Europe Market Attractiveness Analysis by Application
- Figure 62: Western Europe Market Value Share and BPS Analysis by End-Use Industry, 2025 to 2035
- Figure 63: Western Europe Market Y-o-Y Growth Comparison by End-Use Industry, 2025 to 2035
- Figure 64: Western Europe Market Attractiveness Analysis by End-Use Industry
- Figure 65: East Asia Market Value Share and BPS Analysis by Country, 2025 to 2035
- Figure 66: East Asia Market Value Share and BPS Analysis by Production Method, 2025 to 2035
- Figure 67: East Asia Market Y-o-Y Growth Comparison by Production Method, 2025 to 2035
- Figure 68: East Asia Market Attractiveness Analysis by Production Method
- Figure 69: East Asia Market Value Share and BPS Analysis by Grade, 2025 to 2035
- Figure 70: East Asia Market Y-o-Y Growth Comparison by Grade, 2025 to 2035
- Figure 71: East Asia Market Attractiveness Analysis by Grade
- Figure 72: East Asia Market Value Share and BPS Analysis by Application, 2025 to 2035
- Figure 73: East Asia Market Y-o-Y Growth Comparison by Application, 2025 to 2035
- Figure 74: East Asia Market Attractiveness Analysis by Application
- Figure 75: East Asia Market Value Share and BPS Analysis by End-Use Industry, 2025 to 2035
- Figure 76: East Asia Market Y-o-Y Growth Comparison by End-Use Industry, 2025 to 2035
- Figure 77: East Asia Market Attractiveness Analysis by End-Use Industry
- Figure 78: South Asia Pacific Market Value Share and BPS Analysis by Country, 2025 to 2035
- Figure 79: South Asia Pacific Market Value Share and BPS Analysis by Production Method, 2025 to 2035
- Figure 80: South Asia Pacific Market Y-o-Y Growth Comparison by Production Method, 2025 to 2035
- Figure 81: South Asia Pacific Market Attractiveness Analysis by Production Method
- Figure 82: South Asia Pacific Market Value Share and BPS Analysis by Grade, 2025 to 2035
- Figure 83: South Asia Pacific Market Y-o-Y Growth Comparison by Grade, 2025 to 2035
- Figure 84: South Asia Pacific Market Attractiveness Analysis by Grade
- Figure 85: South Asia Pacific Market Value Share and BPS Analysis by Application, 2025 to 2035
- Figure 86: South Asia Pacific Market Y-o-Y Growth Comparison by Application, 2025 to 2035
- Figure 87: South Asia Pacific Market Attractiveness Analysis by Application
- Figure 88: South Asia Pacific Market Value Share and BPS Analysis by End-Use Industry, 2025 to 2035
- Figure 89: South Asia Pacific Market Y-o-Y Growth Comparison by End-Use Industry, 2025 to 2035
- Figure 90: South Asia Pacific Market Attractiveness Analysis by End-Use Industry
- Figure 91: Eastern Europe Market Value Share and BPS Analysis by Country, 2025 to 2035
- Figure 92: Eastern Europe Market Value Share and BPS Analysis by Production Method, 2025 to 2035
- Figure 93: Eastern Europe Market Y-o-Y Growth Comparison by Production Method, 2025 to 2035
- Figure 94: Eastern Europe Market Attractiveness Analysis by Production Method
- Figure 95: Eastern Europe Market Value Share and BPS Analysis by Grade, 2025 to 2035
- Figure 96: Eastern Europe Market Y-o-Y Growth Comparison by Grade, 2025 to 2035
- Figure 97: Eastern Europe Market Attractiveness Analysis by Grade
- Figure 98: Eastern Europe Market Value Share and BPS Analysis by Application, 2025 to 2035
- Figure 99: Eastern Europe Market Y-o-Y Growth Comparison by Application, 2025 to 2035
- Figure 100: Eastern Europe Market Attractiveness Analysis by Application
- Figure 101: Eastern Europe Market Value Share and BPS Analysis by End-Use Industry, 2025 to 2035
- Figure 102: Eastern Europe Market Y-o-Y Growth Comparison by End-Use Industry, 2025 to 2035
- Figure 103: Eastern Europe Market Attractiveness Analysis by End-Use Industry
- Figure 104: Middle East & Africa Market Value Share and BPS Analysis by Country, 2025 to 2035
- Figure 105: Middle East & Africa Market Value Share and BPS Analysis by Production Method, 2025 to 2035
- Figure 106: Middle East & Africa Market Y-o-Y Growth Comparison by Production Method, 2025 to 2035
- Figure 107: Middle East & Africa Market Attractiveness Analysis by Production Method
- Figure 108: Middle East & Africa Market Value Share and BPS Analysis by Grade, 2025 to 2035
- Figure 109: Middle East & Africa Market Y-o-Y Growth Comparison by Grade, 2025 to 2035
- Figure 110: Middle East & Africa Market Attractiveness Analysis by Grade
- Figure 111: Middle East & Africa Market Value Share and BPS Analysis by Application, 2025 to 2035
- Figure 112: Middle East & Africa Market Y-o-Y Growth Comparison by Application, 2025 to 2035
- Figure 113: Middle East & Africa Market Attractiveness Analysis by Application
- Figure 114: Middle East & Africa Market Value Share and BPS Analysis by End-Use Industry, 2025 to 2035
- Figure 115: Middle East & Africa Market Y-o-Y Growth Comparison by End-Use Industry, 2025 to 2035
- Figure 116: Middle East & Africa Market Attractiveness Analysis by End-Use Industry
- Figure 117: Global Market - Tier Structure Analysis
- Figure 118: Global Market - Company Share Analysis
- FAQs -
What is the Global High Speed Steel Market size in 2025?
The high speed steel market is valued at USD 2.9 billion in 2025.
Who are the Major Players Operating in the High Speed Steel Market?
Prominent players in the market include Graphite India Ltd., NACHI-FUJIKOSHI CORP., Tiangong International Co. Ltd, and ThyssenKrupp AG, Sandvik AB.
What is the Estimated Valuation of the High Speed Steel Market by 2035?
The market is expected to reach a valuation of USD 5.5 billion by 2035.
What Value CAGR Did the High Speed Steel Market Exhibit ovee the Last Five Years?
The historic growth rate of the high speed steel market is 5.7% from 2020-2024.