- Market Value (2025): USD 3.5 Bn
- Estimated Value (2026): USD 4.2 Bn
- Forecast Value (2036): USD 25.8 Bn
- CAGR (2026-2036): 19.9%
What is the AI Inference Optimization Software Market forecast to be worth by 2036?
USD 4.2 Billion in 2026 to USD 25.8 Billion by 2036 at a 19.9% CAGR.
- The AI Inference Optimization Software Market reached USD 3.5 Billion in 2025.
- Demand is projected to increase from USD 4.2 Billion in 2026 to USD 25.8 Billion by 2036.
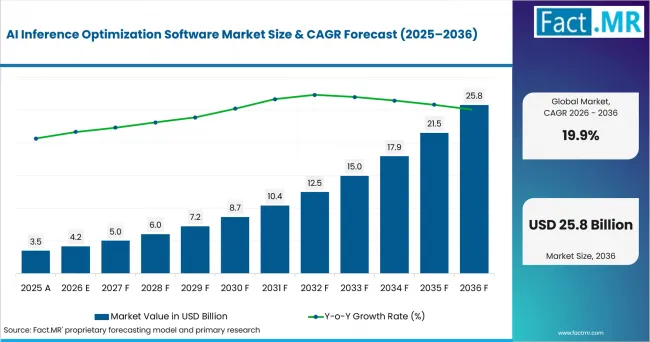
Ai Inference Optimization Software Market Value Analysis | Source: Fact.MR
What are the defining numbers behind AI Inference Optimization Software Market growth?
An absolute opportunity of USD 21.5 Billion is expected between 2026 and 2036.
- Demand Drivers in the Market
- Production AI creates a recurring inference cost every time a model serves a request. As usage scales, engineering teams have a direct incentive to reduce latency, memory consumption and accelerator time through compilation and quantization. Pruning and optimized serving provide further efficiency gains.
- Data center power constraints are increasing the value of software efficiency. The International Energy Agency projects electricity consumption from accelerated servers, which is mainly driven by AI adoption, to grow by around 30% annually from 2024 to 2030. Better accelerator utilization can therefore lower the infrastructure required for a given inference workload.
- Benchmark-based purchasing is making inference performance easier to compare. MLCommons maintains MLPerf Inference benchmarks for data center and edge systems, giving buyers common latency and throughput measures when evaluating hardware and software configurations.
- Public AI-compute programs are widening access to production infrastructure. Canada, the United Kingdom and Singapore are expanding national compute capacity or access programs, increasing the number of organizations that can move models from development into deployed inference workloads.
- Edge and on-device use cases create tighter memory, power and latency limits than centralized deployment. These constraints increase demand for hardware-aware optimizers and compressed models that can execute within fixed device resources without redesigning the full application stack.
- Key Segments Analyzed
- Model compilers & runtimes account for 30.0% of Solution Type in 2026 because they translate trained models into optimized execution paths for the target hardware and sit directly in the serving stack.
- Cloud accounts for 45.0% of Deployment in 2026, supported by concentrated accelerator capacity and managed inference environments that let organizations scale serving without owning the complete hardware stack.
- LLMs & generative account for 44.0% of Model Type in 2026 as token-based workloads make latency, memory use and serving cost visible at the application level.
- IT & telecom accounts for 28.0% of End-Use in 2026 because digital platforms and networked services run high-volume inference where small efficiency gains can reduce recurring infrastructure use.
- Large enterprises account for 63.0% of Organization Size in 2026, reflecting their production model estates, dedicated AI platform teams and ability to invest in workload-specific optimization.
- Analyst Opinion at Fact.MR
- Shambhu Nath Jha, Principal Consultant at Fact.MR, states, “Inference economics are becoming part of AI infrastructure purchasing. Enterprises are evaluating throughput, latency and memory use alongside model quality because serving costs recur with every request. Compilers and runtimes sit closest to that operating problem, while managed inference expands access for teams that do not want to maintain a specialized optimization stack.”
- Strategic Implications
- Vendors should connect compiler, runtime and serving telemetry so buyers can measure how optimization changes latency, throughput and infrastructure utilization in production.
- Quantization and pruning suppliers should document accuracy retention by model and task, since buyers need evidence that lower memory use does not weaken application performance beyond acceptable limits.
- Hardware-aware platforms should support more than one accelerator environment where practical, because enterprise inference estates increasingly span cloud GPUs, on-premise systems and edge hardware.
- Managed inference providers should make per-token economics and latency behavior transparent across workload sizes so customers can compare optimization gains against self-managed deployment.
How does the AI Inference Optimization Software Market break down by segment?
The market is segmented by Solution Type, Deployment, Model Type, End-Use and Organization Size.
Why do Model compilers & runtimes lead Solution Type?
Model compilers & runtimes lead Solution Type in 2026.
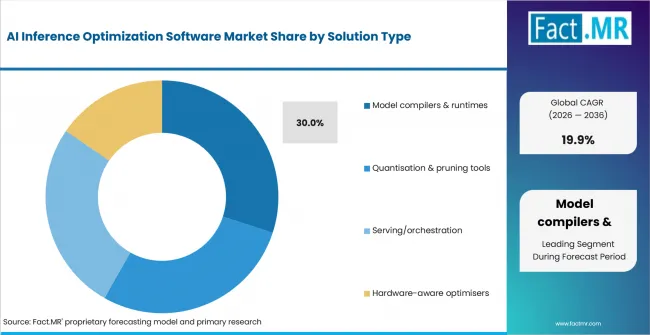
Ai Inference Optimization Software Market Analysis By Solution Type | Source: Fact.MR
Compilers and runtimes lead because they determine how a trained model is executed on the target processor. They can fuse operations and select kernels. They also manage precision and schedule work so the same model uses fewer compute resources or responds faster without changing the business application.
NVIDIA TensorRT illustrates this role by compiling trained models into optimized runtime engines and supporting multiple precision formats for GPU deployment. Because every production model requires an execution layer, compiler and runtime software can influence performance across generative AI, vision and other inference workloads.
Why does Cloud lead Deployment?
Cloud leads Deployment in 2026.
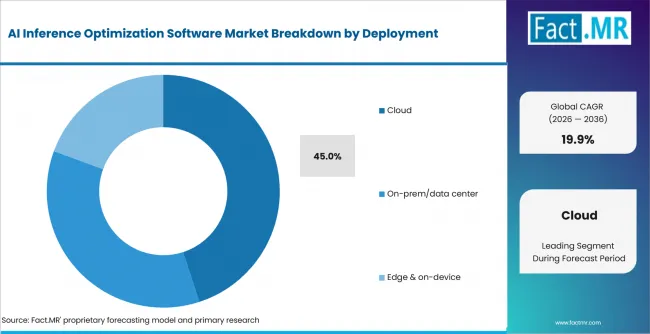
Ai Inference Optimization Software Market Analysis By Deployment | Source: Fact.MR
Cloud leads because organizations can access accelerator capacity without building a dedicated data center environment for every workload. This makes it practical to scale serving capacity with request volumes and to test different model or hardware configurations before committing to fixed infrastructure.
The IEA expects hyperscale, server-provider and enterprise data centers to contribute to rising electricity demand through 2030. As more inference remains concentrated in shared compute environments, cloud deployment gives optimization vendors a broad installed base in which better batching, memory management and runtime efficiency translate into measurable operating savings.
Why do LLMs & generative lead Model Type?
LLMs & generative lead Model Type in 2026.
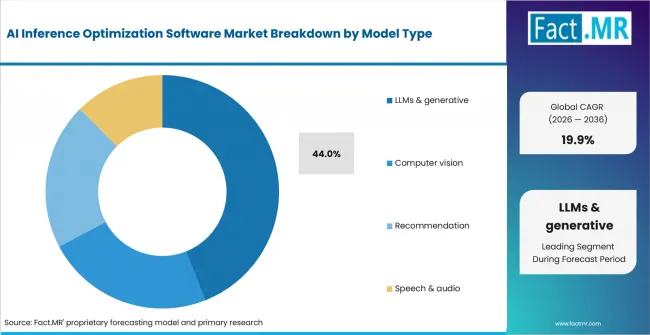
Ai Inference Optimization Software Market Analysis By Model Type | Source: Fact.MR
Generative workloads lead because each user interaction can trigger repeated token generation, making throughput and time to first token visible product metrics. Larger context windows and concurrent users also increase memory pressure, giving optimization software a direct role in determining how much accelerator capacity is needed.
MLCommons has expanded MLPerf Inference to include current generative AI workloads and reports results across different hardware and software configurations. The use of common inference benchmarks reinforces buyer attention to serving performance rather than model accuracy alone.
Why does IT & telecom lead End-Use?
IT & telecom leads End-Use in 2026.
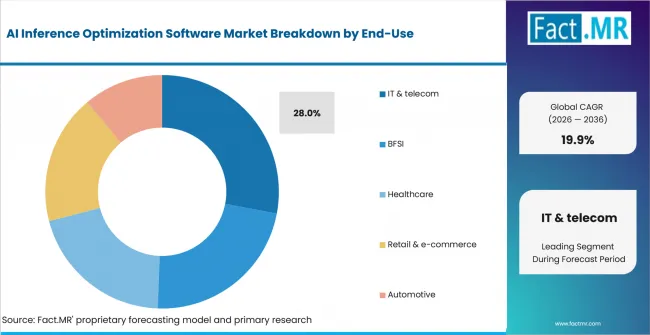
Ai Inference Optimization Software Market Analysis By End Use | Source: Fact.MR
IT and telecom organizations run digital services that must respond continuously across search and assistants. They also support network operations and customer-facing applications. Their inference workloads are often centralized in platform teams, which makes latency and accelerator utilization easier to measure and optimize at scale.
These buyers also operate mixed infrastructure across public cloud, private environments and edge locations. Software that can tune models across several hardware targets can therefore reduce duplicated engineering work while supporting consistent serving behavior across deployment environments.
Why do Large enterprises lead Organization Size?
Large enterprises lead Organization Size in 2026.
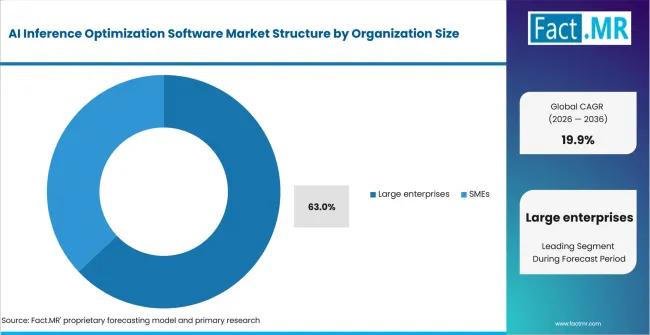
Ai Inference Optimization Software Market Analysis By Organization Size | Source: Fact.MR
Large enterprises lead because they are more likely to operate several production models across business units and maintain dedicated teams for ML platforms, infrastructure and governance. This creates a budget owner for optimization software and a measurable cost base against which efficiency improvements can be evaluated.
Smaller organizations can access optimization through managed inference services, but many do not maintain a separate internal compiler or serving stack. Their direct software spending is therefore lower even when optimized inference is delivered as part of a cloud service.
What is accelerating AI Inference Optimization Software Market adoption, and what is holding it back?
Drivers Impact Analysis
| Driver | (~) % Impact on CAGR | Geographic Relevance | Impact Timeline |
|---|---|---|---|
| Cost-per-token pressure in production LLM serving | +2.2% | Global | Near term |
| Data center power and energy-efficiency constraints | +1.6% | North America; Europe; East Asia | Mid term |
| Data-locality and edge-inference requirements | +1.3% | Europe; North America | Mid term |
| Benchmark-driven procurement through MLPerf-style comparisons | +0.9% | Global | Long term |
Source: Fact.MR analysis. Updated Aug 18, 2026
Opportunity Impact Analysis
| Opportunity | (~) % Impact on CAGR | Geographic Relevance | Impact Timeline |
|---|---|---|---|
| Managed inference optimization and serverless serving for SMEs | +1.4% | Global | Mid term |
| Edge and on-device optimization for automotive, retail and telecom | +1.1% | North America; East Asia | Long term |
| Quantization-aware tooling that preserves model accuracy | +0.8% | Global | Near term |
Source: Fact.MR analysis. Updated Aug 18, 2026
Restraints Impact Analysis
| Restraint | (~) % Impact on CAGR | Geographic Relevance | Impact Timeline |
|---|---|---|---|
| Fragmentation of model formats and accelerator targets | -0.7% | Global | Near term |
| Accuracy-loss risk in aggressive quantization | -0.5% | Europe; North America | Mid term |
| Limited optimization-engineering skills outside specialist teams | -0.4% | Global | Long term |
Source: Fact.MR analysis. Updated Aug 18, 2026
Which countries are scaling the AI Inference Optimization Software Market through 2036?
- United States: Rising AI data center load gives platform teams a financial reason to reduce compute used per request. U.S. Department of Energy reporting shows rapid growth in data center electricity demand, increasing the value of software that raises accelerator utilization and reduces serving overhead.
- Canada: The Canadian Sovereign AI Compute Strategy and AI Compute Access Fund are expanding access to domestic AI compute for businesses and innovators. As more organizations gain accelerator access, inference optimization becomes relevant for keeping recurring serving costs within operating budgets.
- United Kingdom: The AI Opportunities Action Plan calls for a major expansion of public AI compute capacity. A broader compute base supports more model deployment, which increases demand for runtimes and serving tools that manage throughput, memory and infrastructure use.
- Singapore: The National AI Strategy and Green Data Centre Roadmap combine AI deployment goals with energy-efficiency requirements. This creates a clear use case for inference software that increases work completed per unit of compute in a power-constrained data center market.
- Germany: AI Factory projects linked to JUPITER and Stuttgart are expanding access to high-performance AI infrastructure. Industrial users can apply optimization software when moving models from centralized compute into manufacturing and automotive edge environments.
- Japan: METI has supported plans to secure GPU cloud computational resources for AI. Greater domestic access to accelerated computing supports demand for compilers and runtime tools that improve model-serving efficiency across cloud and enterprise deployments.
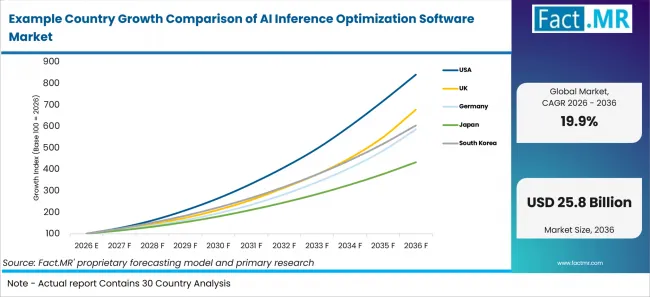
Example Country Growth Comparison Of Ai Inference Optimization Software Market | Source: Fact.MR
Country CAGR (2026-2036)
| Country | CAGR (2026-2036) |
|---|---|
| United States | 20.6% |
| Canada | 21.0% |
| United Kingdom | 20.4% |
| Singapore | 21.7% |
| Germany | 20.5% |
| Japan | 19.5% |
Source: Fact.MR analysis. Updated Aug 18, 2026
What is driving the United States' growth through 2036?
The United States is forecast to expand at a 20.6% CAGR from 2026 to 2036.
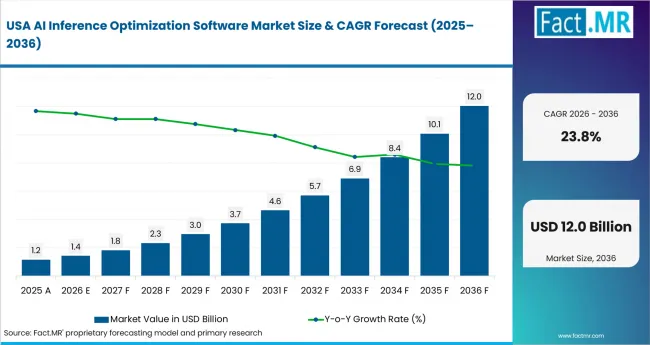
Ai Inference Optimization Software Market Country Value Analysis | Source: Fact.MR
The IEA projects U.S. data center electricity consumption to rise substantially through 2030 as accelerated servers absorb more power for AI workloads. This raises the operating value of inference optimization because lower memory use, better batching and higher accelerator utilization can reduce the infrastructure required to serve the same application demand.
What is driving Canada's growth through 2036?
Canada is forecast to expand at a 21.0% CAGR from 2026 to 2036.
Canada is lowering access barriers to advanced compute through the AI Compute Access Fund and related sovereign-compute programs. The fund is designed to help Canadian businesses obtain high-performance computing resources, which can move more applications into production and increase demand for managed optimization that controls the cost of serving models after deployment.
What is driving the United Kingdom's growth through 2036?
The United Kingdom is forecast to expand at a 20.4% CAGR from 2026 to 2036.
The UK government reported a material increase in national AI compute capacity during 2025 as the AI Research Resource came online. More accessible compute supports model development, but production use shifts attention toward throughput and runtime economics, creating demand for software that optimizes serving once models move beyond research workloads.
What is driving Singapore's growth through 2036?
Singapore is forecast to expand at a 21.7% CAGR from 2026 to 2036.
Singapore has paired AI expansion with data center efficiency measures. IMDA introduced an IT energy-efficiency standard for data centers in 2025, reinforcing the need to use compute resources more efficiently. Inference software can support that objective by reducing memory overhead and improving the useful work obtained from accelerator capacity.
What is driving Germany's growth through 2036?
Germany is forecast to expand at a 20.5% CAGR from 2026 to 2036.
Germany is expanding high-performance AI infrastructure through AI Factory initiatives and national plans for additional computing capacity. This creates a path from research models into industrial deployment, where optimization software is needed to adapt models to specific accelerators and to edge hardware used in factories or vehicles.
What is driving Japan's growth through 2036?
Japan is forecast to expand at a 19.5% CAGR from 2026 to 2036.
Japan is building domestic AI compute availability through METI-backed GPU cloud programs. The IEA also expects data center electricity demand in Japan to increase through 2030. Together, these factors raise the value of inference software that improves hardware utilization while allowing enterprises to run production workloads within power and capacity limits.
Who leads the AI Inference Optimization Software Market?
NVIDIA Corporation is an active provider through TensorRT and TensorRT-LLM. Triton Inference Server connects model optimization with production execution across NVIDIA GPU environments. Its position is reinforced by direct integration between compiler tooling, runtime software and accelerator platforms.
Red Hat, Inc. now carries Neural Magic's inference-optimization capabilities through Red Hat AI Inference Server after completing the Neural Magic acquisition in January 2025. The platform uses vLLM with model-compression tooling, giving enterprise buyers an open-source-based route to optimized inference across supported accelerators.
Together Computer, Inc. operates Together AI with serverless and dedicated inference services, while Fireworks AI, Inc. provides managed inference with workload-level optimization. Groq, Inc. competes through its LPU-based inference architecture and associated cloud service, linking software optimization with purpose-built inference hardware.
Deci AI is treated within NVIDIA rather than as a separate current provider because NVIDIA acquired Deci in May 2024 and the company was dissolved as an independent corporate entity. Competition therefore centers on compiler depth and model compression. Serving efficiency and hardware portability also matter, together with evidence of repeatable latency and throughput improvements.
Which companies are the key providers?
Key companies include NVIDIA Corporation (including Deci AI); Red Hat, Inc. (Neural Magic); Together Computer, Inc. (Together AI); Fireworks AI, Inc.; and Groq, Inc.
- NVIDIA Corporation (including Deci AI)
- Red Hat, Inc. (Neural Magic)
- Together Computer, Inc. (Together AI)
- Fireworks AI, Inc.
- Groq, Inc.
Research Sources and Bibliography
- MLCommons. (2025). MLPerf Inference v5.0 Results. MLCommons.
- International Energy Agency. (2025). Energy and AI. IEA.
- U.S. Department of Energy. (2024). DOE Releases New Report Evaluating Increase in Electricity Demand from Data Centers. U.S. Department of Energy.
- Innovation, Science and Economic Development Canada. (2026). Canadian Sovereign AI Compute Strategy. Government of Canada.
- Innovation, Science and Economic Development Canada. (2026). AI Compute Access Fund. Government of Canada.
- Department for Science, Innovation and Technology. (2025). AI Opportunities Action Plan. UK Government.
- Department for Science, Innovation and Technology. (2026). AI Opportunities Action Plan: One Year On. UK Government.
- Smart Nation Singapore. (2026). National AI Strategy. Government of Singapore.
- Infocomm Media Development Authority. (2024). Green Data Centre Roadmap. Government of Singapore.
- Infocomm Media Development Authority. (2025). Singapore IT Energy Efficiency Standard for Data Centres. Government of Singapore.
- Federal Ministry of Education and Research, Germany. (2025). AI Factory at Juelich and Stuttgart. Federal Government of Germany.
- Ministry of Economy, Trade and Industry, Japan. (2024). Approval of Plans for Ensuring a Stable Supply of Cloud Programs. Government of Japan.
- NVIDIA. (2026). TensorRT Documentation. NVIDIA Corporation.
- NVIDIA. (2026). Deci is Now a Part of NVIDIA. NVIDIA Corporation.
- Red Hat. (2025). Red Hat Completes Acquisition of Neural Magic. Red Hat, Inc.
- Red Hat. (2025). Red Hat AI Inference Server Technical Deep Dive. Red Hat, Inc.
- Together AI. (2026). Inference Overview. Together Computer, Inc.
- Fireworks AI. (2026). Inference. Fireworks AI, Inc.
- Groq. (2026). LPU Architecture. Groq, Inc.
This Report Answers
- The report explains where inference optimization software is used across solution type and deployment environment. It also covers model type and end use, together with organization size.
- Segment analysis identifies the leading subsegments and the operational reasons buyers prioritize them.
- Country analysis examines the listed markets and the infrastructure or policy mechanisms supporting inference deployment.
- Competitive analysis reviews current providers across compiler and compression. It also covers managed serving and specialized inference approaches.
- Application analysis assesses how latency and memory use influence purchase decisions. It also considers hardware portability and serving economics.
What does the AI Inference Optimization Software Market cover?
The AI Inference Optimization Software Market covers software that improves the efficiency of running trained machine-learning models in production.
It includes tools that compile model graphs, reduce numerical precision, remove unnecessary parameters, manage serving and tune execution for specific hardware.The assessment covers cloud, on-prem/data center and edge or on-device deployment across LLMs and generative AI, computer vision, recommendation, speech and audio workloads. Demand is assessed across the end-use and organization-size segmentation.
What is included in the scope?
The scope includes licensed or subscription inference-optimization software, commercial platforms built on open-source inference engines, managed serving platforms where optimization is a core function, and model-compression tooling used before or during deployment.
It includes compiler and runtime software, quantisation and pruning tools, serving/orchestration platforms and hardware-aware optimisers used by IT and telecom, BFSI, healthcare, retail and e-commerce, and automotive organizations.
What is excluded from the scope?
The scope excludes AI training software, base-model development, general fine-tuning frameworks, raw accelerator hardware, cloud-compute infrastructure and semiconductor design when sold without inference-optimization software.
General DevOps or MLOps platforms are excluded when they do not provide inference optimization. Managed model APIs are also excluded when the service does not expose or bundle optimization as part of the serving proposition.
How Was the Analysis Built?
Fact.MR is of the opinion that this assessment combines primary research with a structured review of public information and industry evidence relevant to the market.
- Primary Research: Interviews with AI infrastructure buyers, ML platform leaders, inference engineers, cloud architects and procurement teams examine workload economics, deployment constraints, model-serving priorities and vendor selection.
- Desk Research: The review covers MLPerf benchmark documentation, official AI-compute programs, data center energy analysis, technical standards, academic inference research and current provider documentation.
- Market Sizing and Forecasting: Estimates combine inference-optimization software revenue, production workload growth, deployment mix, model-serving intensity, pricing and country-level adoption. The forecast also considers the movement of workloads between cloud, on-premise and edge environments.
- Data Validation and Update Cycle: Evidence is reviewed against the defined market scope, segment boundaries and forecast period. The assessment is updated when source data, technology conditions, regulation or supplier activity materially changes the outlook.
Segmentation
Research Scope and Coverage
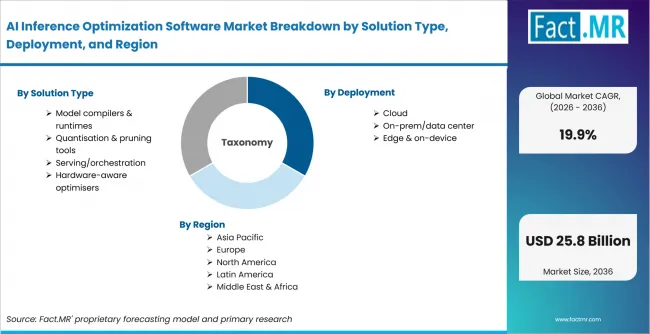
Ai Inference Optimization Software Market Breakdown By Solution Type Deployment And Region | Source: Fact.MR
| Attribute | Details |
|---|---|
| Quantitative Units | USD million |
| Market Definition | Software used to improve the latency, throughput, memory efficiency and operating cost of running trained AI models in production. The scope includes model compilers and runtimes, quantisation and pruning tools, serving/orchestration software and hardware-aware optimisers. |
| Segments Covered | Solution Type; Deployment; Model Type; End-Use; Organization Size |
| Regions Covered | North America; Latin America; Western Europe; Eastern Europe; East Asia; South Asia & Pacific; Middle East & Africa |
| Countries Covered | United States; Canada; United Kingdom; Singapore; Germany; Japan |
| Key Companies Profiled | NVIDIA Corporation; Red Hat, Inc.; Together Computer, Inc.; Fireworks AI, Inc.; Groq, Inc. |
| Forecast Period | 2026 to 2036 |
| Approach | Hybrid top-down and bottom-up approach using production inference workloads, software revenue by solution type, deployment mix, model-serving intensity, country adoption and provider portfolio review. |
Source: Fact.MR analysis. Updated Aug 18, 2026
Market Breakdown by Segments
-
By Solution Type
- Model compilers & runtimes
- Quantisation & pruning tools
- Serving/orchestration
- Hardware-aware optimisers
-
By Deployment
- Cloud
- On-prem/data center
- Edge & on-device
-
By Model Type
- LLMs & generative
- Computer vision
- Recommendation
- Speech & audio
-
By End-Use
- IT & telecom
- BFSI
- Healthcare
- Retail & e-commerce
- Automotive
-
By Organization Size
- Large enterprises
- SMEs
-
By Region
- North America
- Latin America
- Western Europe
- Eastern Europe
- East Asia
- South Asia & Pacific
- Middle East & Africa
Frequently Asked Questions
What is the AI Inference Optimization Software Market value in 2026?
At what CAGR is the market projected to grow?
What is the projected market value by 2036?
Which Solution Type leads the market?
Which Deployment leads the market?
Which Model Type leads the market?
Which End-Use leads the market?
Which Organization Size leads the market?
Which listed country is projected at a 21.7% CAGR?
What is the primary driver in this market?
What is the main restraint?
Which companies are included in the market assessment?
Who worked on this report


Preview the report firsthand - request a free sample
Free SampleGet the brochure for pricing and purchase details
Download PDF