- Market Value (2025): USD 1.7 Bn
- Estimated Value (2026): USD 2.1 Bn
- Forecast Value (2036): USD 12.9 Bn
- CAGR (2026-2036): 20.2%
What is the AI-Powered Procurement Operations Services Market forecast to be worth by 2036?
USD 2.1 billion in 2026 to USD 12.9 billion by 2036 at 20.2% CAGR.
- The AI-powered procurement operations services market crossed a valuation of USD 1.7 billion in 2025, with managed sourcing and contract-support expansion included among the demand indicators.
- Demand is projected to increase from USD 2.1 billion in 2026 to USD 12.9 billion by 2036.
- The market is forecast to record 20.2% CAGR from 2026 to 2036 owing to source-to-contract automation and AI-assisted supplier workflows.
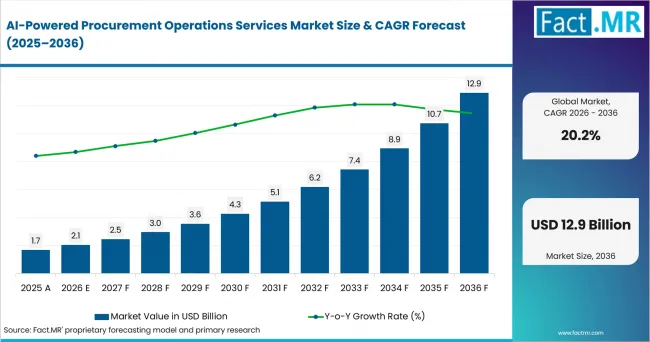
Ai Powered Procurement Operations Services Market Value Analysis | Source: Fact.MR
What are the defining numbers behind AI-Powered Procurement Operations Services Market growth?
USD 10.86 billion absolute opportunity by 2036, led by Source-to-contract, Offshore delivery and Manufacturing accounts.
- Demand Drivers in the Market
- Procurement leaders need automated source-to-contract support because category teams must move from sourcing events to signed agreements with fewer manual checks.
- Finance teams need spend analytics that connect supplier records with contract and invoice data before payment exceptions reach monthly close.
- Compliance teams require supplier risk files where documentation, ownership and renewal dates remain visible across business units.
- Enterprise operations teams are expected to use AI-assisted procurement workflows as manual sourcing backlogs become harder to manage. The Office for National Statistics reported in July 2026 that AI use by UK businesses with 10 or more employees rose to around 35%.
- Key Segments Analyzed
- By Function: Source-to-contract is expected to hold 32.0% share in 2026 because sourcing, negotiation and contracting sit closest to executive savings targets.
- By Delivery Model: Offshore is projected to account for 44.0% share in 2026 owing to its fit with repeatable category research and supplier-data work.
- By End-Use: Manufacturing is anticipated to capture 27.0% share in 2026 since complex supplier networks create more category and risk files.
- Analyst Opinion at Fact.MR
- Shambhu Nath Jha, Principal Consultant at Fact.MR, states, “Procurement operations services are moving from task support to evidence-led operating control. Buyers are expected to ask whether providers can explain each supplier recommendation and connect it to contract history. Providers that combine clean spend data, category judgment and clear approval trails are likely to win longer programs.”
- Strategic Implications
- Procurement heads should separate tactical buying from source-to-contract decisions before moving workflows into managed services.
- Service providers should invest in reusable supplier-risk playbooks that show how AI outputs are reviewed by category specialists.
- Public-sector advisors should link contract transparency work to analytics readiness. The Australian Department of Finance reported in August 2026 that 86,926 AusTender contracts worth AUD 104.90 billion were published in 2024-25.
- Investors should distinguish procurement-specific managed services from broad IT outsourcing where supplier, sourcing and contract expertise is not visible.
Australia is projected to post 22.7% CAGR through 2036 supported by AI use and federal procurement visibility. Canada is expected to record 22.0% CAGR through service-delivery depth and business AI adoption. The United States is forecast to advance at 21.9% CAGR as large enterprises scale procurement automation. France is estimated to reach 20.2% CAGR due to enterprise AI use and public-contract documentation. The United Kingdom is anticipated to record 19.9% CAGR as procurement reform changes operating models. Germany is projected to post 19.8% CAGR as manufacturing procurement teams prioritize supplier documentation.
How does the AI-Powered Procurement Operations Services Market break down by segment?
Source-to-contract leads Function at 32.0%; Offshore leads Delivery Model at 44.0%.
Which function dominates?
Source-to-contract is projected to account for 32.0% share in 2026.
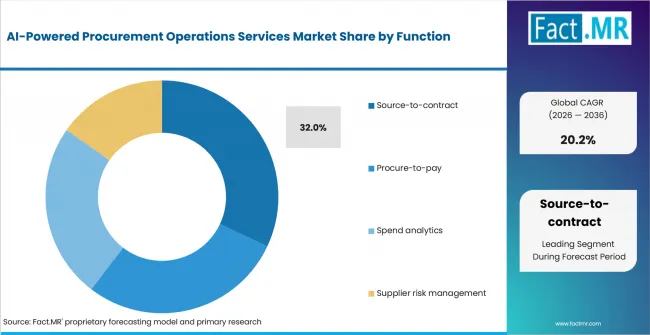
Ai Powered Procurement Operations Services Market Analysis By Function | Source: Fact.MR
Source-to-contract is expected to lead Function with 32.0% share in 2026 because it covers high-value managed procurement activities, including category research, sourcing support, negotiation preparation and contract handover. Enterprises are expected to prioritize these workflows where structured supplier evaluation and stronger commercial decision support can improve procurement outcomes.
What leads the Delivery Model segment?
Offshore holds 44.0% share in 2026.
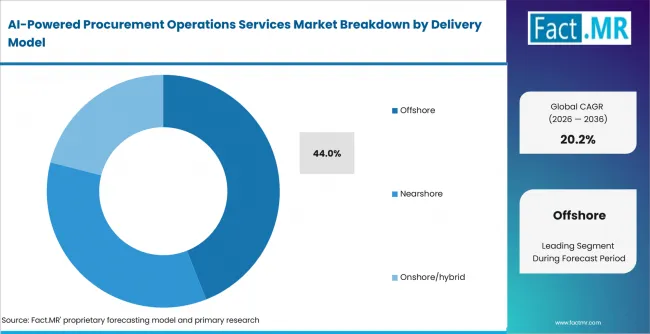
Ai Powered Procurement Operations Services Market Analysis By Delivery Model | Source: Fact.MR
Offshore delivery is anticipated to lead Delivery Model with 44.0% share in 2026 because repeatable supplier-data work can be centralized in scaled operating centers. Statistics Canada reported in June 2026 that 40.4% of finance and insurance businesses used AI, supporting broader adoption of technology-enabled outsourced workflows.
How does End-Use shape demand?
Manufacturing is anticipated to lead with 27.0% share in 2026.
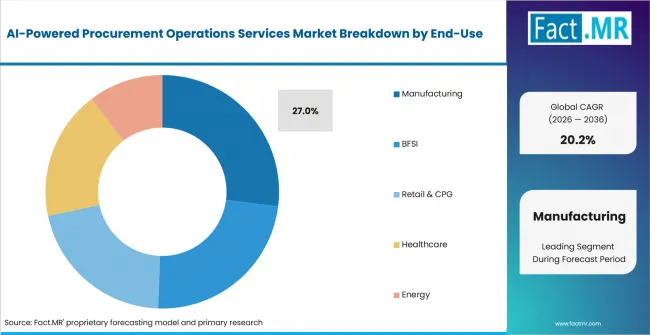
Ai Powered Procurement Operations Services Market Analysis By End Use | Source: Fact.MR
Manufacturing is forecast to lead End-Use with 27.0% share in 2026 because supplier qualification, material planning and production schedules place significant emphasis on procurement controls. Managed procurement services can support sourcing discipline, supplier records and contract coordination where manufacturers need stronger visibility across complex purchasing and production networks.
What is accelerating AI-Powered Procurement Operations Services Market adoption, and what is holding it back?
Source-to-contract automation drives it; sensitive supplier-data access restrains it.
Drivers Impact Analysis
| DRIVER | (~) % IMPACT ON CAGR | GEOGRAPHIC RELEVANCE | IMPACT TIMELINE |
|---|---|---|---|
| Source-to-contract automation | +4.5% | United States, Canada, United Kingdom | Short term (<= 2 years) |
| Spend analytics and category visibility | +3.8% | United States and Germany | Short term (<= 2 years) |
| Supplier risk and contract controls | +3.1% | France, Germany, Canada | Medium term (2-4 years) |
| Offshore delivery scale | +2.4% | United States, United Kingdom, Australia | Medium term (2-4 years) |
| AI-assisted workflow adoption | +1.8% | Australia and Western Europe | Long term (>= 4 years) |
Source: Fact.MR analysis. Updated Aug 18, 2026
- Source-to-contract automation: Managed service demand is expected to rise where enterprises need sourcing calendars, supplier comparisons and draft contract files prepared faster. The mechanism is strongest when internal category teams keep approval authority while providers handle data preparation and workflow administration.
- Spend analytics and category visibility: Procurement teams are projected to increase outsourcing where spend data is scattered across ERP and payment systems. Better visibility is expected to give service providers a clearer entry point before wider supplier and contract work begins.
- Supplier risk and contract controls: Outsourced procurement programs are anticipated to gain share when clients need consistent supplier records for audits. The value is highest where ownership, renewal dates and compliance evidence are checked before approvals move forward.
- Offshore delivery scale: Offshore teams are estimated to retain a large role because catalog cleanup, supplier onboarding support and event preparation remain labor-intensive. Clients are expected to keep strategic negotiation and sensitive supplier decisions closer to internal teams.
- AI-assisted workflow adoption: AI tools are expected to improve service economics when recommendations remain explainable. The U.S. Census Bureau reported on 26 May 2026 that 37% of firms with at least 250 employees used AI in business operations.
Opportunity Impact Analysis
| OPPORTUNITY | (~) % IMPACT ON CAGR | GEOGRAPHIC RELEVANCE | IMPACT TIMELINE |
|---|---|---|---|
| S2P platform integration | +1.6% | United States, Canada, United Kingdom | Medium term (2-4 years) |
| Contract intelligence support | +1.2% | BFSI and public-sector accounts | Medium term (2-4 years) |
| BFSI procurement controls | +1.0% | Canada, United States, United Kingdom | Long term (>= 4 years) |
| Manufacturing supplier files | +0.8% | Germany, France, Australia | Long term (>= 4 years) |
Source: Fact.MR analysis. Updated Aug 18, 2026
- S2P platform integration: The primary opportunity is concentrated in programs that connect sourcing, contract and purchase-order activity. Providers are expected to benefit when clients want one operating model instead of separate tools and service teams.
- Contract intelligence support: Contract review and renewal tracking are projected to create add-on service demand. Enterprises need clauses, dates and supplier obligations organized before AI tools can support approval recommendations.
- BFSI procurement controls: Financial-services clients are anticipated to use managed services where procurement decisions must carry clear evidence. This is expected to favor providers that combine platform configuration with audit-ready process documentation.
- Manufacturing supplier files: Manufacturers are forecast to create service opportunity where supplier qualification affects production continuity. Providers that maintain clean part, supplier and contract records are likely to improve account retention.
Restraint Impact Analysis
| RESTRAINT | (~) % IMPACT ON CAGR | GEOGRAPHIC RELEVANCE | IMPACT TIMELINE |
|---|---|---|---|
| Sensitive supplier data access | -1.4% | Global | Short term (<= 2 years) |
| ERP fragmentation | -1.1% | United States and Germany | Short term (<= 2 years) |
| Model governance uncertainty | -0.8% | BFSI and healthcare accounts | Medium term (2-4 years) |
| Change-management load | -0.6% | Mid-market clients | Long term (>= 4 years) |
Source: Fact.MR analysis. Updated Aug 18, 2026
- Sensitive supplier data access: Some enterprises are expected to limit provider access to banking details, supplier identities and negotiated rates. This restraint slows offshore transition when approval rights and audit logs are not already defined.
- ERP fragmentation: Fragmented systems are anticipated to reduce the value of AI recommendations because supplier names and category codes do not match across business units. Cleanup work can delay savings evidence during the early contract period.
- Model governance uncertainty: Regulated clients are projected to question automated supplier scoring when explanation trails are weak. Providers need human review checkpoints so procurement teams can defend why a supplier was approved or rejected.
- Change-management load: Category managers are expected to resist service migration when roles are unclear. Adoption improves when providers show which work moves outside the client team and which decisions remain internal.
Which countries are scaling AI-Powered Procurement Operations Services Market fastest?
- The country comparison spans 2.90 percentage points across the forecast period.
- Australia remains 0.68 percentage point above Canada through AI use and public-contract visibility.
- Canada stays 0.05 point above the United States as enterprise AI use supports managed sourcing and contract work.
- The United States remains 1.70 points above France through large-enterprise AI deployment and outsourcing depth.
- France stays 0.30 point above the United Kingdom through enterprise AI adoption and public-data rules.
- The United Kingdom remains 0.17 point above Germany as procurement reform pushes operating-model review.
- Germany closes the displayed range through manufacturing procurement needs and AI use in larger enterprises.
Comparable CAGRs create different service entry conditions due to outsourcing maturity, data access rules and local procurement reform. Full report coverage includes North America, Latin America, Europe, East Asia, South Asia and Pacific, Middle East and Africa.
| Country | CAGR (2026-2036) |
|---|---|
| Australia | 22.7% |
| Canada | 22.0% |
| United States | 21.9% |
| France | 20.2% |
| United Kingdom | 19.9% |
| Germany | 19.8% |
Source: Fact.MR analysis. Updated Aug 18, 2026
What supports Australia adoption?
22.7% CAGR, supported by AI use and public-contract visibility.
Australia’s procurement teams are expected to use managed services where sourcing workload and supplier documentation grow together. The market is projected to record 22.7% CAGR through 2036 as public-contract transparency makes analytics and workflow discipline more useful. Federal procurement visibility supports demand for offshore and hybrid service models where repeatable supplier-data tasks can be separated from strategic approvals.
How is Canada scaling service demand?
22.0% CAGR, driven by business AI use and bilingual service delivery.
Canadian enterprise accounts are expected to increase demand where sourcing documentation must support English and French workflows. The market is forecast to record 22.0% CAGR through 2036 as bilingual procurement support and supplier controls raise managed-service value. Nearshore and offshore delivery are expected to work best when supplier files, contract templates and approval records stay consistent across provinces.
What supports United States growth?
21.9% CAGR, backed by large-enterprise AI deployment and outsourcing depth.
Demand is anticipated to record 21.9% CAGR through 2036 as large enterprises combine AI tools with process outsourcing for sourcing and contract administration. Service providers are expected to win where they can connect supplier records, purchase controls and approval evidence across complex accounts.
What underpins France outlook?
20.2% CAGR, shaped by enterprise AI use and procurement-data rules.
France is estimated to reach 20.2% CAGR through 2036 as enterprise AI use broadens the base for procurement workflow automation. Insee reported on 21 July 2026 that 18% of businesses settled in France used at least one AI technology in 2025. French-language documentation and public-procurement data rules are expected to keep nearshore service design relevant for complex accounts.
How is the United Kingdom developing demand?
19.9% CAGR, supported by procurement reform and managed-service maturity.
The United Kingdom is projected to record 19.9% CAGR through 2036 as public and private buyers review sourcing controls. GOV.UK stated in February 2025 that the Procurement Act 2023 came into force with access to nearly GBP 400 billion of yearly public spend.
What supports Germany adoption?
19.8% CAGR, led by manufacturing procurement and enterprise AI use.
Germany’s manufacturing base is expected to support procurement operations services where supplier files affect production continuity. Destatis reported in November 2025 that 26% of German enterprises used AI technologies in 2025. Demand is forecast to post 19.8% CAGR through 2036 as manufacturers seek cleaner supplier records, spend visibility and contract discipline across regional operations.
Who leads the AI-Powered Procurement Operations Services Market?
GEP and Accenture lead direct service coverage, while Genpact and Infosys BPM strengthen managed procurement operations.
GEP has direct relevance through procurement software and managed services used across source-to-pay and contract management programs. Accenture contributes large-scale procurement transformation, consulting and managed operations capability for enterprise accounts. Genpact strengthens the field with procurement workflow knowledge and agentic AI tools that support sourcing, spend visibility and tactical purchasing tasks.
Infosys BPM, TATA CONSULTANCY SERVICES (TCS) and Capgemini complete the provider set through business-process delivery, analytics support and procurement transformation experience. Competition is expected to depend on explainable AI outputs, category knowledge and the ability to maintain supplier records across client systems.
Which companies are the key providers?
Key companies include GEP; Accenture; Genpact; Infosys BPM; TATA CONSULTANCY SERVICES (TCS); and Capgemini.
- GEP
- Accenture
- Genpact
- Infosys BPM
- TATA CONSULTANCY SERVICES (TCS)
- Capgemini
Bibliography
- Department of Finance. (2026, March 26). Procurement. Australian Government.
- GEP. (2026, February 2). GEP SOFTWARE selected by Canada’s Central 1 Credit Union to transform procurement operations.
- Office for National Statistics. (2026, July 20). Artificial intelligence in UK businesses: 2023 to 2026.
- Cabinet Office. (2025, February 25). New public procurement rules to drive growth, opportunities for small businesses and exclude suppliers that fail to deliver. GOV.UK.
- Federal Statistical Office (Destatis). (2025, November 24). Enterprises using artificial intelligence (AI) technologies, by employment size class, 2025.
This Report Answers
- The report provides strategic intelligence on the AI-Powered Procurement Operations Services Market across sourcing, supplier and contract workflows.
- Segment analysis covers source-to-contract and offshore delivery alongside adjacent supply chain management BPO service models.
- Country outlook evaluates Australia, Canada and the United States while Europe links procurement reform to business process outsourcing demand.
- Competitive analysis reviews GEP, Accenture, Genpact and Infosys BPM together with cloud-based business process as a service models.
- Scope analysis distinguishes direct procurement operations work from broad analytics and financial back-office tools.
What does the AI-Powered Procurement Operations Services Market cover?
AI-powered procurement operations services cover managed work across sourcing, supplier files and contract administration.
Coverage includes supplier management activities when the provider maintains supplier records or supports onboarding decisions. It also includes supplier quality management applications where supplier evidence is tied to purchasing and contract workflows.
What is included in the scope?
The scope includes source-to-contract, procure-to-pay, spend analytics and supplier-risk work delivered as managed services.
It covers self-service analytics only when analytics support procurement users and category teams. It also includes data catalog activity when data access is part of sourcing or supplier governance.
What is excluded from the scope?
General finance transformation, standalone dashboards and broad shared-services programs remain outside the scope unless they directly manage procurement operations.
Pure financial analytics software is excluded when it is not tied to supplier or sourcing decisions. Standalone office of the CFO software is excluded unless procurement workflows are the primary service boundary.
How Was the Analysis Built?
The analysis draws on 120+ sources, 35+ company portfolios, 25+ countries, and more than 20 industry interviews.
- Primary Research: Primary research includes discussions with service providers, technology developers, procurement teams, sourcing advisors, finance leaders and subject-matter experts. These conversations examine purchasing priorities, approval requirements, data-access limits, competitive positioning and the factors that influence wider market acceptance.
- Desk Research: Desk research covers government statistics, regulatory publications, company filings, official company announcements, procurement data, public policy and other authoritative sources. Every third-party evidence source retained in the published analysis is documented in the bibliography.
- Market Sizing and Forecasting: Market estimates combine historical performance, demand indicators, pricing and service mix, segment shares, company participation, country-level growth, adoption patterns and barriers to market expansion.
- Data Validation and Update Cycle: Findings are validated by comparing primary interviews with public data, company activity, regulatory changes, procurement trends and shifts in commercial adoption. Regular updates review new product launches, partnerships, platform changes, outsourcing models and procurement policy shifts.
Segmentation
What is the report’s scope and coverage?
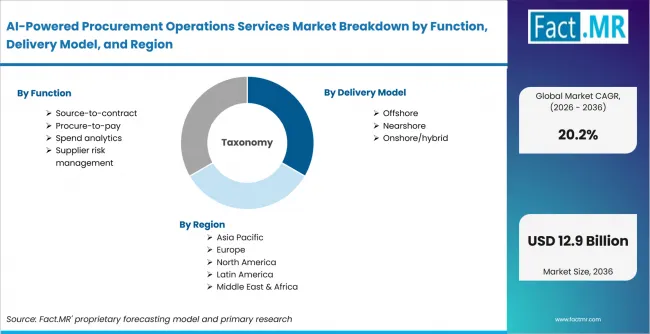
Ai Powered Procurement Operations Services Market Breakdown By Function, Delivery Model, And Region | Source: Fact.MR
| Attribute | Details |
|---|---|
| Quantitative Units | USD billion |
| Market Definition | Managed procurement operations services that combine AI-assisted workflow support with sourcing, contract, supplier and procure-to-pay operations |
| Function | Source-to-contract; Procure-to-pay; Spend analytics; Supplier risk management |
| Delivery Model | Offshore; Nearshore; Onshore/hybrid |
| End-Use | Manufacturing; BFSI; Retail and CPG; Healthcare; Energy |
| Regions Covered | North America; Latin America; Europe; East Asia; South Asia and Pacific; Middle East and Africa |
| Countries Covered | Australia; Canada; United States; France; United Kingdom; Germany |
| Key Companies Profiled | GEP; Accenture; Genpact; Infosys BPM; TATA CONSULTANCY SERVICES (TCS); Capgemini |
| Forecast Period | 2026 to 2036 |
| Approach | Hybrid top-down and bottom-up approach using procurement workload; enterprise AI adoption; public contracting data; sourcing and contract activity; supplier risk requirements; delivery model economics; country adoption patterns and company portfolio review |
Source: Fact.MR analysis. Updated Aug 18, 2026
How is the market segmented?
-
By Function:
- Source-to-contract
- Procure-to-pay
- Spend analytics
- Supplier risk management
-
By Delivery Model:
- Offshore
- Nearshore
- Onshore/hybrid
-
By End-Use:
- Manufacturing
- BFSI
- Retail and CPG
- Healthcare
- Energy
-
By Region:
- North America
- Latin America
- Europe
- East Asia
- South Asia and Oceania
- Middle East and Africa
Frequently Asked Questions
How big is the AI-powered procurement operations services market in 2026?
What is the CAGR of the AI-powered procurement operations services market from 2026 to 2036?
Which function leads the AI-powered procurement operations services market?
Which delivery model leads the AI-powered procurement operations services market?
Who are the leading companies in the AI-powered procurement operations services market?
Who worked on this report


Preview the report firsthand - request a free sample
Free SampleGet the brochure for pricing and purchase details
Download PDF