- Market Value (2025): USD 2.6 Bn
- Estimated Value (2026): USD 3.2 Bn
- Forecast Value (2036): USD 22.8 Bn
- CAGR (2026-2036): 21.7%
What is the AI-Powered Finance Operations Services Market forecast to be worth by 2036?
USD 3.2 billion in 2026 to USD 22.8 billion by 2036, at 21.7% CAGR.
- The AI-Powered Finance Operations Services Market was valued at USD 2.6 billion in 2025.
- Demand is projected to increase from USD 3.2 billion in 2026 to USD 22.8 billion by 2036.
- The market is forecast to record 21.7% CAGR from 2026 to 2036 as finance teams automate AP, close support, and reporting controls.
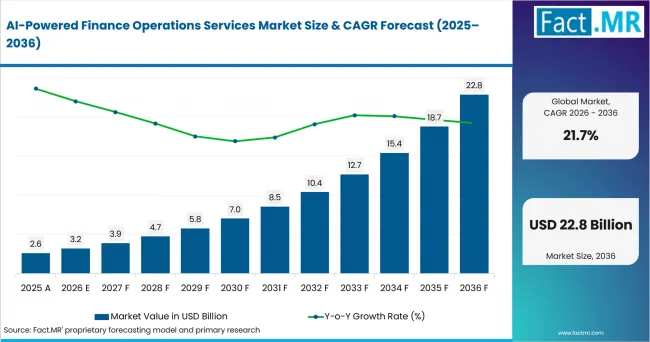
Ai Powered Finance Operations Services Market Value Analysis | Source: Fact.MR
What are the defining numbers behind AI-Powered Finance Operations Services Market growth?
USD 19.6 billion absolute opportunity by 2036, led by accounts payable/receivable, offshore delivery, and BFSI accounts.
- Demand Drivers in the Market
- CFO teams need auditable AI workflows because invoice exceptions and close adjustments still require clear ownership.
- Shared-service centers need faster triage tools supported by standardized finance processes and service-level tracking.
- Outsourcing providers need reusable automation layers so delivery teams handle higher transaction volumes without losing control evidence.
- Enterprise controllers need cleaner finance data owing to board scrutiny around forecast changes, cash application, and working-capital reporting.
- Key Segments Analyzed
- By Function: Accounts payable/receivable is expected to hold 30.0% share in 2026 because transaction matching creates the clearest automation case.
- By Delivery Model: Offshore is projected to account for 42.0% share in 2026 due to established process centers and deeper delivery benches.
- By End-Use: BFSI is anticipated to capture 28.0% share in 2026 owing to high control requirements and recurring finance workloads.
- By Organization Size: Large enterprises are estimated to represent 71.0% share in 2026 as multi-ERP estates need process governance before automation.
- Analyst Opinion at Fact.MR
- Shambhu Nath Jha, Principal Consultant at Fact.MR, states, “Finance AI services draw attention when automation creates evidence that controllers and auditors trust. Adoption is expected to depend on reusable controls, trained finance agents, and ERP integration. Providers should combine process ownership, model governance, and exception evidence.”
- Strategic Implications
- CFOs should treat AP automation as a control redesign project, not only a labor-saving exercise.
- Service providers should package model monitoring with finance-domain playbooks so clients understand escalation paths.
- Procurement teams should compare delivery partners on exception evidence, ERP fit, and data-protection practices.
- Investors should separate direct finance operations exposure from broad IT automation revenue.
Canada is projected to record 23.6% CAGR through 2036. Australia is anticipated to post 22.8% CAGR as business AI use broadens. The United States is forecast to advance at 22.3% CAGR due to large enterprise adoption. The United Kingdom is estimated to reach 21.7% CAGR through financial-services AI use. Germany is expected to hold 21.5% CAGR, while France is projected to record 21.0% CAGR.
How does the AI-Powered Finance Operations Services Market break down by segment?
Accounts payable/receivable leads Function at 30.0%; offshore leads Delivery Model at 42.0%.
Which function dominates?
Accounts payable/receivable holds 30.0% share in 2026.
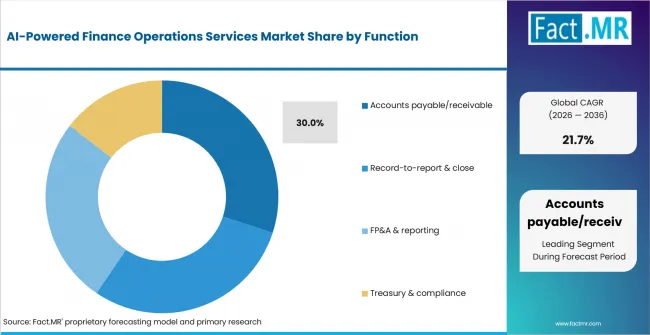
Ai Powered Finance Operations Services Market Analysis By Function | Source: Fact.MR
Accounts payable/receivable is expected to lead Function with 30.0% share in 2026 because invoice capture, matching and cash application create repeatable finance workflows. Standardized transaction processes make these activities suitable for AI-enabled automation while allowing finance teams to retain controls around exceptions, approvals and payment accuracy.
What leads the Delivery Model segment?
Offshore holds 42.0% share in 2026.
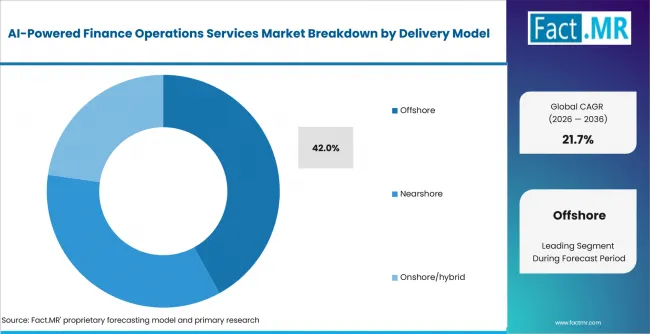
Ai Powered Finance Operations Services Market Analysis By Delivery Model | Source: Fact.MR
Offshore delivery is projected to lead Delivery Model with 42.0% share in 2026 because finance operations outsourcing already depends on scaled process centers. Established offshore teams can handle high transaction volumes, standardized workflows and continuous process support while allowing enterprises to centralize controls and reduce internal operational workloads.
How does End-Use shape demand?
BFSI leads with 28.0% share in 2026.
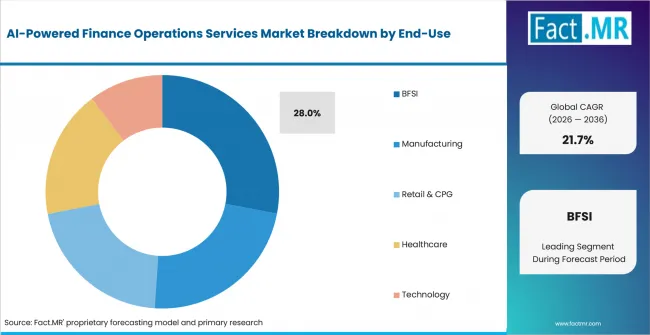
Ai Powered Finance Operations Services Market Analysis By End Use | Source: Fact.MR
BFSI is anticipated to lead End-Use with 28.0% share in 2026 because financial institutions process large recurring transaction volumes and operate under strict documentation requirements. AI-enabled finance services can support invoice processing, reconciliation and reporting while maintaining audit trails and standardized controls across complex financial operations.
What supports large enterprises within Organization Size?
Large enterprises hold 71.0% share in 2026.
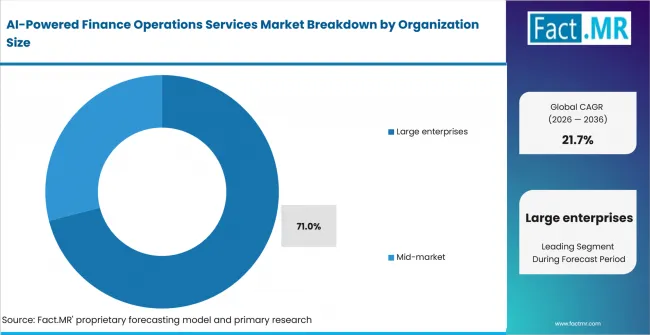
Ai Powered Finance Operations Services Market Analysis By Organization Size | Source: Fact.MR
Large enterprises are forecast to lead Organization Size with 71.0% share in 2026 because multi-country finance teams require standardized controls before AI handles repetitive work. These organizations often operate multiple ERP environments, increasing demand for coordinated automation, governance and process integration across accounts payable, reporting and other finance functions.
What is accelerating AI-Powered Finance Operations Services Market adoption, and what is holding it back?
AP exception automation drives it; data privacy and model governance restrain it.
Drivers Impact Analysis
| DRIVER | (~) % IMPACT ON CAGR | GEOGRAPHIC RELEVANCE | IMPACT TIMELINE |
|---|---|---|---|
| AP exception automation | +3.5% | Global enterprise accounts | Short term (<= 2 years) |
| AI-assisted close controls | +2.9% | United States, United Kingdom, Canada | Short term (<= 2 years) |
| FP&A data ingestion | +2.4% | BFSI and manufacturing accounts | Medium term (2-4 years) |
| Offshore delivery automation | +1.7% | Australia, Canada, United Kingdom | Medium term (2-4 years) |
| Finance compliance documentation | +1.2% | Regulated service markets | Long term (>= 4 years) |
Source: Fact.MR analysis. Updated Aug 18, 2026
- AP exception automation: Invoice matching and dispute workflows give providers a practical starting point. Adoption is expected to expand where clients demand faster cycle time with evidence trails.
- AI-assisted close controls: Month-end close work needs repeatable reconciliations and clear sign-off records. AI support is projected to raise value when each proposed adjustment is documented.
- FP&A data ingestion: Forecasting teams need clean operational feeds before they trust AI variance explanations. Source-data checking is anticipated to gain budget access.
- Offshore delivery automation: Global delivery centers already handle AP, AR, and R2R work at scale. AI workflow layers are estimated to lift productivity where tasks are standardized.
- Finance compliance documentation: Regulated clients expect explanations for ledger, accrual, and cash-position changes. Providers are expected to add stronger audit packets.
Opportunity Impact Analysis
| OPPORTUNITY | (~) % IMPACT ON CAGR | GEOGRAPHIC RELEVANCE | IMPACT TIMELINE |
|---|---|---|---|
| Agentic AP suites | +1.6% | United States, Canada, United Kingdom | Medium term (2-4 years) |
| Finance data hubs | +1.3% | Large enterprise accounts | Medium term (2-4 years) |
| Nearshore controller support | +1.0% | Europe and North America | Long term (>= 4 years) |
| AI governance services | +0.8% | Regulated service markets | Long term (>= 4 years) |
Source: Fact.MR analysis. Updated Aug 18, 2026
- Agentic AP suites: AP agents screen invoices and prepare exception files for reviewer approval. Finance teams are expected to favor suites that plug into existing ERPs.
- Finance data hubs: AI services need normalized finance data before models explain variances. Providers with data-engineering depth are projected to move closer to the CFO agenda.
- Nearshore controller support: Nearshore delivery pairs process automation with closer language and time-zone coverage. It is anticipated to suit clients needing finance judgment near business units.
- AI governance services: Finance teams need policies for prompt use, model access, and approval rights. Managed governance services are estimated to gain value as AI enters recurring operations.
Restraints Impact Analysis
| RESTRAINT | (~) % IMPACT ON CAGR | GEOGRAPHIC RELEVANCE | IMPACT TIMELINE |
|---|---|---|---|
| Data privacy and model governance | -1.4% | North America and Europe | Short term (<= 2 years) |
| ERP process fragmentation | -1.1% | Large enterprise accounts | Short term (<= 2 years) |
| Skills and change resistance | -0.9% | Mid-market accounts | Medium term (2-4 years) |
| Auditability of autonomous workflows | -0.7% | BFSI and healthcare | Long term (>= 4 years) |
Source: Fact.MR analysis. Updated Aug 18, 2026
- Data privacy and model governance: Finance data includes bank details, supplier records, and sensitive account notes. Clients are expected to slow adoption when model access rules are unclear.
- ERP process fragmentation: Many finance organizations run separate ERP and subledger systems after acquisitions. Fragmentation raises implementation effort before AI workflows operate consistently.
- Skills and change resistance: Finance teams need training before they trust AI-assisted posting and reporting. Adoption is anticipated to improve when providers bundle change support with operations.
- Auditability of autonomous workflows: Autonomous routing creates risk when auditors cannot see why a task moved. Providers are forecast to invest in evidence packs and reviewer logs.
Which countries are scaling AI-Powered Finance Operations Services Market fastest?
- The country comparison spans 2.60 percentage points across the forecast period.
- Canada remains 0.79 percentage point above Australia through finance-sector AI use and service delivery depth.
- Australia remains 0.51 percentage point above the United States as business AI use broadens from pilots into operations.
- The United States remains 0.65 percentage point above the United Kingdom through enterprise scale and accounting-service capacity.
- The United Kingdom remains 0.18 percentage point above Germany through financial-services AI adoption and regulatory attention.
- Germany remains 0.47 percentage point above France through large-enterprise AI use and cloud adoption.
AI-Powered Finance Operations Services Market is segmented into North America, Europe, East Asia, South Asia and Pacific, Latin America, and Middle East and Africa.
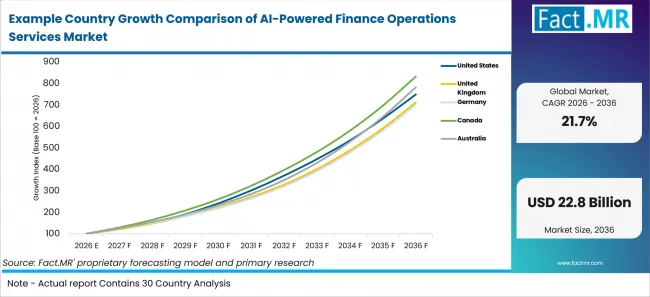
Example Country Growth Comparison Of Ai Powered Finance Operations Services Market | Source: Fact.MR
| Country | CAGR (2026-2036) |
|---|---|
| Canada | 23.6% |
| Australia | 22.8% |
| United States | 22.3% |
| United Kingdom | 21.7% |
| Germany | 21.5% |
| France | 21.0% |
Source: Fact.MR analysis. Updated Aug 18, 2026
What supports Canada adoption?
23.6% CAGR, supported by finance-sector AI use and service delivery depth.
Canada’s growth reflects strong AI adoption across finance and insurance. Statistics Canada reported that 40.4% of businesses in the finance and insurance sector used AI to produce goods or deliver services over the previous 12 months in Q2 2026. Managed finance services benefit from demand for documented workflows and privacy-aware automation, although compliance costs, bilingual delivery requirements and unclear mid-market savings may restrain adoption.
How is Australia scaling demand?
22.8% CAGR through 2036, driven by business AI adoption and finance transformation work.
Australia’s growth is supported by expanding enterprise and SME AI adoption. ABS reported that 12% of Australian businesses used AI in 2024–25, while the National AI Centre reported that 45% of Australian SMEs showed some level of AI adoption during September–November 2025. Finance teams increasingly need invoice and reporting automation, although cybersecurity exposure, unclear exception ownership and uncertain savings may delay projects.
What underpins United States growth?
22.3% CAGR through 2036, supported by large-firm AI use and accounting-service capacity.
United States growth reflects strong enterprise AI adoption and deep accounting-service capacity. The Census Bureau reported that 37% of firms with at least 250 employees used AI, while BLS reported 1.1266 million seasonally adjusted employees in accounting, tax preparation, bookkeeping, and payroll services in June 2026. Cybercrime exposure, data-access concerns and human-review requirements may slow regulated finance deployments.
What supports the United Kingdom outlook?
21.7% CAGR through 2036, shaped by financial-services AI use and controlled operations.
United Kingdom growth is supported by widespread AI adoption across businesses and financial services. ONS reported 29% of businesses used AI in June 2026, while 75% of surveyed financial-services firms were already using AI. Cybersecurity risks, documentation demands and data-residency reviews may lengthen decisions for sensitive finance workflows.
How is Germany developing demand?
21.5% CAGR through 2036, supported by enterprise AI adoption and cloud migration.
Germany’s growth reflects expanding enterprise AI adoption and measurable productivity gains. Destatis reported that 26% of enterprises used AI technologies in 2025, while the Deutsche Bundesbank found that around 46% of firms that increased their use of generative AI in 2025 reported labour-productivity growth of at least 1%. DORA requirements, works-council concerns and complex multi-ERP environments may raise implementation costs and extend finance-automation timelines.
What supports France growth?
21.0% CAGR through 2036, driven by larger enterprise AI use and finance modernization.
France’s growth is supported by rising business AI adoption and strong generative-AI use among larger firms. Insee reported that 18% of French enterprises with at least 10 employees used AI technologies in 2025, while Bpifrance Le Lab found that 77% of surveyed ETI executives said that they and/or their employees used generative AI for professional purposes. Privacy requirements, approval complexity and cross-border delivery needs may constrain expansion.
Who leads the AI-Powered Finance Operations Services Market?
Genpact and Accenture lead direct finance operations AI coverage, while TCS and Cognizant strengthen scaled delivery capability.
Genpact and Accenture have direct positioning in AI-powered finance operations services. Genpact’s work covers managed AP, record-to-report, data foundations, and agentic finance tools. Accenture connects AI Refinery assets with invoice reconciliation and accounts receivable support.
TCS and Cognizant extend the field through finance and accounting operations services supported by automation and enterprise technology depth. WNS and Infosys BPM complete the provider set. Competition is expected to center on audit evidence, ERP integration, and finance-domain delivery depth.
Which companies are the key providers?
Key companies include Genpact; Accenture; TCS; Cognizant; WNS; and Infosys BPM .
- Genpact
- Accenture
- TCS
- Cognizant
- WNS
- Infosys BPM
Bibliography
- Accenture. (2025, March 18). Accenture expands AI Refinery and launches new industry agent solutions to accelerate agentic AI adoption.
- Australian Bureau of Statistics. (2026, June 25). Characteristics of Australian Business, 2024–25 financial year.
- Australian Signals Directorate. (2025, October 14). Annual Cyber Threat Report 2024–2025.
- Bundesanstalt für Finanzdienstleistungsaufsicht. (2026, January 28). Risks in BaFin’s focus 2026.
- Department of Industry, Science and Resources. (2025, December 2). National AI Plan.
- Eurostat. (2025, December 11). 20% of EU enterprises use AI technologies.
- Federal Bureau of Investigation. (2026, April 6). Cryptocurrency and AI scams bilk Americans of billions.
- Office for National Statistics. (2026, July 2). Business insights and impact on the UK economy: 2 July 2026.
- Phoenix Strategic Perspectives Inc. (2026, March). 2025–2026 Survey of Canadian businesses on privacy-related issues. Office of the Privacy Commissioner of Canada.
- Department for Science, Innovation and Technology. (2026, April 30). Cyber security breaches survey 2025/2026.
- House of Commons Treasury Committee. (2026, January 22). Artificial intelligence in financial services.
- U.S. Bureau of Labor Statistics. (2026, July 2). Table B-1. Employees on nonfarm payrolls by industry sector and selected industry detail. In The Employment Situation – June 2026.
This Report Answers
- The report provides strategic intelligence on the AI-Powered Finance Operations Services Market across Function and Delivery Model choices that shape CFO-office outsourcing programs.
- Segment analysis covers accounts payable/receivable and offshore delivery as the 2026 share leaders.
- Country outlook evaluates Canada and Australia alongside the United States and the United Kingdom. Germany and France complete the growth comparison across the profiled markets.
- Competitive analysis profiles Genpact and Accenture alongside TCS and Cognizant. WNS and Infosys BPM complete the provider set.
- Service-model assessment covers AI-supported AP, AR and close. Coverage extends to FP&A, treasury and compliance. Finance workflow governance completes the service view.
What does the AI-Powered Finance Operations Services Market cover?
The market covers managed finance workflows where AI assists transaction processing, exception routing, and evidence preparation.
Business process outsourcing, BPaaS delivery, and generative AI in financial services where managed operations overlap with finance automation.
What is included in the scope?
The scope includes AI-enabled services from outsourcing and managed-services providers for recurring finance operations.
Related control layers are included when they support managed service delivery, including Office of the CFO software, agentic workforce operations, and ModelOps controls for enterprise AI workflow governance.
What is excluded from the scope?
The scope excludes separate finance software sold without managed operations responsibility.
Adjacent categories such as reconciliation software, AI FinOps services, AI agentic platforms, and revenue operations platforms remain outside scope unless embedded inside finance operations service delivery.
How Was the Analysis Built?
The analysis draws on 120+ sources and 35+ company portfolios. It also covers 25+ countries and more than 20 industry interviews.
- Primary Research: Primary research includes discussions with finance operations providers and CFO-office leaders. Shared-service managers, procurement teams and subject-matter experts add process detail. These conversations examine process ownership, approval needs and delivery expectations.
- Desk Research: Desk research covers government statistics, regulatory publications and company announcements. AI adoption surveys, business technology surveys and public policy complete the desk evidence. Every third-party evidence source retained in the published analysis appears in the bibliography.
- Market Sizing and Forecasting: Market estimates combine historical performance and market values. Country-level CAGRs, segment shares and delivery-model economics are included. Provider participation, AI adoption indicators and finance workload intensity complete the sizing base.
- Data Validation and Update Cycle: Findings are validated by comparing interviews with public data and company activity. Regulatory changes and procurement behavior are reviewed. Updates cover service launches, controls and adoption shifts.
Segmentation
What is the report’s scope and coverage?
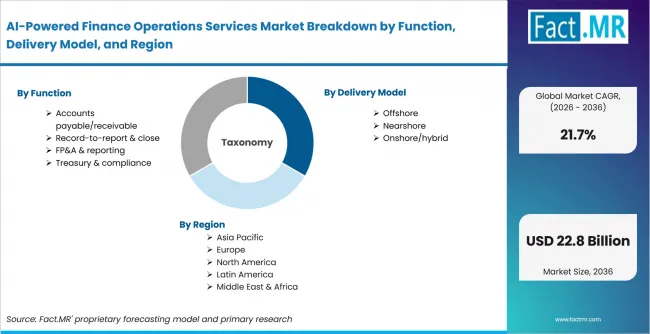
Ai Powered Finance Operations Services Market Breakdown By Function, Delivery Model, And Region | Source: Fact.MR
| Attribute | Details |
|---|---|
| Quantitative Units | USD billion |
| Market Definition | Managed finance operations services that use AI, automation, workflow orchestration, and finance-domain delivery teams to support AP, AR, record-to-report, FP&A, treasury, compliance, and related CFO-office processes |
| Function | Accounts payable/receivable; Record-to-report and close; FP&A and reporting; Treasury and compliance |
| Delivery Model | Offshore; Nearshore; Onshore/hybrid |
| End-Use | BFSI; Manufacturing; Retail and CPG; Healthcare; Technology |
| Organization Size | Large enterprises; Mid-market |
| Regions Covered | North America; Europe; East Asia; South Asia and Pacific; Latin America; Middle East and Africa |
| Countries Covered | Canada; Australia; United States; United Kingdom; Germany; France |
| Key Companies Profiled | Genpact; Accenture; TCS; Cognizant; WNS; Infosys BPM |
| Forecast Period | 2026 to 2036 |
| Approach | Hybrid top-down and bottom-up approach using finance outsourcing adoption, enterprise AI usage, AP and AR workload intensity, record-to-report requirements, delivery-model economics, country-level AI adoption, service provider participation, and operational-control barriers |
Source: Fact.MR analysis. Updated Aug 18, 2026
How is the market segmented?
-
By Function:
- Accounts payable/receivable
- Record-to-report and close
- FP&A and reporting
- Treasury and compliance
-
By Delivery Model:
- Offshore
- Nearshore
- Onshore/hybrid
-
By End-Use:
- BFSI
- Manufacturing
- Retail and CPG
- Healthcare
- Technology
-
By Organization Size:
- Large enterprises
- Mid-market
-
By Region:
- North America
- Latin America
- Europe
- East Asia
- South Asia and Oceania
- Middle East and Africa
Frequently Asked Questions
How big is the AI-powered finance operations services market in 2026?
What is the CAGR of the AI-powered finance operations services market from 2026 to 2036?
Which function leads the AI-powered finance operations services market?
Which delivery model leads the AI-powered finance operations services market?
Who are the leading companies in the AI-powered finance operations services market?
Who worked on this report


Preview the report firsthand - request a free sample
Free SampleGet the brochure for pricing and purchase details
Download PDF