- Market Value (2025): USD 1789.0 Mn
- Estimated Value (2026): USD 2007.3 Mn
- Forecast Value (2036): USD 6346.5 Mn
- CAGR (2026-2036): 12.2%
What is the Battery Electrolyte Additives Market forecast to be worth by 2036?
USD 2,007.3 million in 2026 to USD 6,346.5 million by 2036, at 12.2% CAGR.
- The Battery Electrolyte Additives Market crossed a valuation of USD 1,789.0 million in 2025 as cell output and formulation complexity increased.
- Demand is projected to increase from USD 2,007.3 million in 2026 toward USD 6,346.5 million by 2036 across qualified battery programs.
- The market is forecast to record a 12.2% CAGR from 2026 to 2036 as cell manufacturers and electrolyte formulators expand chemistry-specific qualification work.
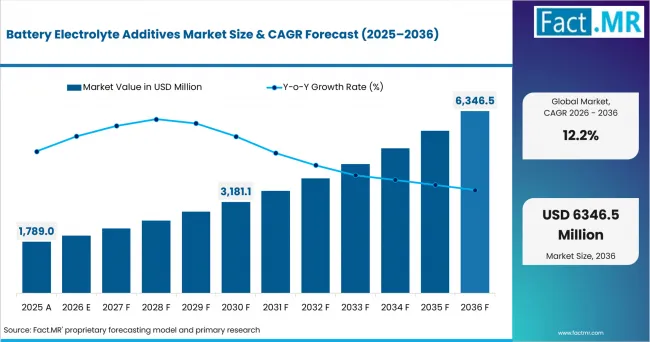
Battery Electrolyte Additives Market Market Value Analysis | Source: Fact.MR
What are the defining numbers behind Battery Electrolyte Additives Market growth?
USD 4,339.2 million absolute opportunity by 2036 is led by VC (Vinylene Carbonate) with lithium-ion batteries and Electric Vehicles
- Demand Drivers in the Market
- Cell manufacturers need stable interphase formation supported by additive packages that reduce early electrolyte breakdown during formation cycling and repeated charging.
- Electrolyte formulators require high-purity additives shaped by strict moisture control and repeatable impurity profiles across every qualified production batch.
- Automotive battery engineers need fast-charge durability reinforced by additives that protect electrode interfaces during higher current density and elevated voltage operation.
- Stationary storage developers need long calendar life due to daily cycling profiles and prolonged residence at high states of charge.
- Key Segments Analyzed
- By Type: VC (Vinylene Carbonate) is expected to account for 31.0% share in 2026, supported by broad use in interphase-forming electrolyte packages.
- By Battery Type: Lithium-ion is projected to represent 72.0% share in 2026, owing to large EV and energy-storage battery volumes.
- By Function: SEI Formation is anticipated to capture 34.0% share in 2026, shaped by recurring electrode-interface protection requirements.
- By End Use: Electric Vehicles are estimated to represent 47.0% share in 2026, attributable to high cell output and repeated electrolyte qualification cycles.
- Analyst Opinion at Fact.MR
- Shambhu Nath Jha, Senior Analyst at Fact.MR, states, “The commercial bottleneck is not additive availability alone because each blend must survive cell-specific qualification. Procurement is expected to favor suppliers that maintain stable impurity control across production scale-up and repeat customer qualification batches. Suppliers need to combine synthesis control and application testing while maintaining responsive technical support across regional battery manufacturing clusters.”
- Strategic Implications
- Additive producers should document impurity ranges and moisture controls before seeking qualification across automotive or grid-storage electrolyte programs.
- Electrolyte formulators should test additive interactions under actual formation protocols before transferring laboratory blends into commercial cell production.
- Cell manufacturers should qualify secondary additive sources early enough to protect production continuity without restarting urgent validation work during shortages.
- Materials procurement teams should map regional purification capacity and transport constraints before locking long-term supply commitments for moisture-sensitive additives.
Growing battery production capacity in Europe is driving demand for electrolyte materials suppliers with strong regional manufacturing and application-support capabilities. Capchem expanded its European battery chemical presence in June 2026 by presenting functional additives and new lithium salts. Its exhibit also covered a Polish electrolyte plant operating at 60,000 tons of annual capacity. The move reflects a wider shift toward regional formulation support because additive suppliers increasingly compete on qualification response time and supply continuity alongside chemical purity.
India is expected to record 14.0% CAGR between 2026 and 2036, supported by local cell manufacturing programs and expanding electric mobility demand. China is projected to post 13.3% CAGR during the forecast period, owing to large battery clusters and dense electrolyte supply networks. Australia is anticipated to advance at 12.0% CAGR over the assessment period, propelled by residential and grid-scale storage installations. The United Kingdom is estimated to record 11.7% CAGR by 2036, attributable to zero-emission vehicle registrations and battery investment. The United States is forecast to post 11.5% CAGR from 2026 to 2036, shaped by utility storage additions and domestic battery-material projects. Germany is projected to record 11.2% CAGR during the forecast period, supported by battery-cell investment and automotive qualification demand. Japan is anticipated to post 10.9% CAGR over the assessment period, driven by domestic battery strategy and next-generation cell development.
How does the Battery Electrolyte Additives Market break down by segment?
VC (Vinylene Carbonate) accounts for 31.0%; lithium-ion batteries represent 72.0%.
Which Type is expected to lead?
VC (Vinylene Carbonate) is forecast to hold 31.0% share in 2026.
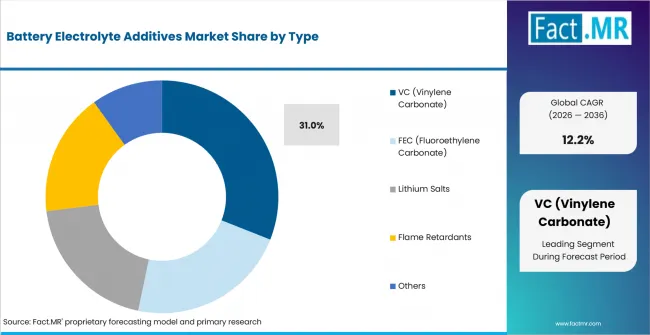
Battery Electrolyte Additives Market Analysis By Type | Source: Fact.MR
VC (Vinylene Carbonate) is expected to account for 31.0% share in 2026 due to broad use in interphase-forming electrolyte packages. FEC (Fluoroethylene Carbonate) supports formulations requiring stronger interface stability across demanding charge cycles. Lithium Salts support ion transport and formulation balance across chemistry-specific electrolyte systems. Flame Retardants address thermal safety requirements in battery programs with stricter abuse-tolerance targets. Other additive types serve specialized formulations that require narrower performance adjustments.
Which Battery Type accounts for the largest share?
Lithium-ion batteries represent 72.0% share in 2026.
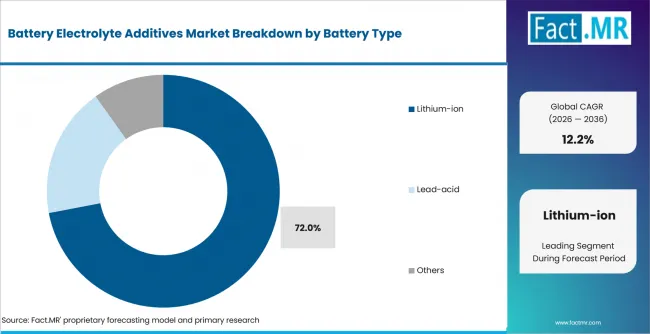
Battery Electrolyte Additives Market Analysis By Battery Type | Source: Fact.MR
Lithium-ion batteries are projected to represent 72.0% share in 2026 due to EV and storage deployment. Lead-acid batteries continue to use additives for charge acceptance and service-life control across industrial applications. Other battery types create smaller demand pools for chemistry-specific electrolyte stabilization and performance adjustment.
Which Function is expected to hold the top share?
SEI Formation records 34.0% share in 2026.
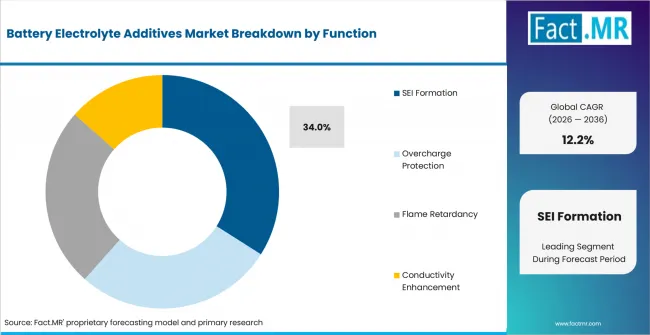
Battery Electrolyte Additives Market Analysis By Function | Source: Fact.MR
SEI Formation is estimated to record 34.0% share in 2026 because stable electrode interfaces support cycle life and charging durability. Overcharge Protection additives support formulations designed for voltage excursions and demanding safety qualification. Flame Retardancy additives help reduce electrolyte flammability risks within targeted battery designs. Conductivity Enhancement additives support ion transport where power delivery and low-temperature performance require formulation adjustments.
What supports Electric Vehicles within End Use?
Electric Vehicles represent 47.0% share in 2026.
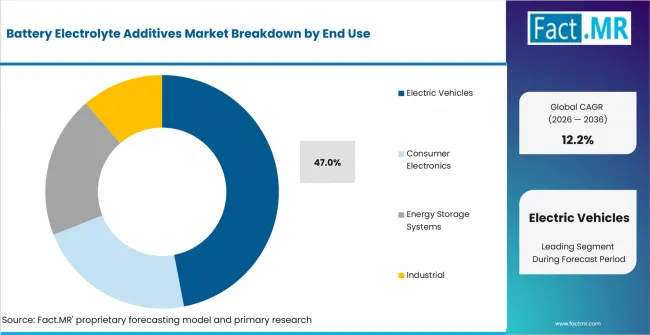
Battery Electrolyte Additives Market Analysis By End Use | Source: Fact.MR
Electric Vehicles are forecast to represent 47.0% share in 2026 due to high cell volumes and repeated electrolyte qualification cycles. Consumer Electronics demand focuses on compact cells that require swelling control and stable repeated charging. Energy Storage Systems need additive packages that support long calendar life and frequent cycling. Industrial applications require electrolyte performance across repeated load cycles and varied operating conditions.
What is accelerating Battery Electrolyte Additives Market adoption, and what is holding it back?
Cell-performance qualification drives industry growth; long validation cycles restrain it.
Drivers Impact Analysis
| DRIVER | (~) % IMPACT ON CAGR | GEOGRAPHIC RELEVANCE | IMPACT TIMELINE |
|---|---|---|---|
| EV battery deployment and cell output scale | +1.4% | China, India and Europe | Medium term (2-4 years) |
| Fast-charge and higher-voltage cell requirements | +1.1% | China, United States and Europe | Medium term (2-4 years) |
| Stationary storage deployment | +0.9% | Australia, United States and India | Long term (>= 4 years) |
| Regional battery-material supply buildout | +0.7% | North America, Europe and India | Medium term (2-4 years) |
| Silicon-rich and next-generation anode programs | +0.5% | United States, China and Japan | Long term (>= 4 years) |
Source: Fact.MR analysis. Updated Jul 9, 2026
- EV battery deployment: Vehicle battery output increases additive qualification volume because each chemistry and electrode pairing needs a stable formulation window. In May 2026, the IEA reported that global electric-vehicle battery deployment reached about 1.2 TWh during 2025 across major manufacturing regions. Additive producers are expected to gain from recurring scale-up programs that convert cell expansion into formulation and supply contracts.
- Fast-charge and higher-voltage requirements: Shorter charging targets raise interfacial stress and increase the value of additives that control side reactions. Formulators test additive packages across temperature ranges and cycling protocols before approving commercial production for specific cell platforms and factories. Demand is projected to favor suppliers that combine synthesis purity with cell-level application support and traceable batch data.
- Stationary storage deployment: Large storage projects create long-duration qualification work around cycle life and high-state-of-charge exposure across extensive cell populations. In February 2026, the IEA reported around 63 GW of new utility-scale battery capacity added globally during 2024. Formulation activity is anticipated to expand as storage cell makers seek additive packages suited to daily cycling and long service periods.
- Regional supply buildout: Battery manufacturers increasingly value local response times for moisture-sensitive chemicals and formulation troubleshooting during ramp-up. Government programs are financing component and material capacity across major battery regions while cell manufacturers expand local qualification networks. Supply agreements are estimated to shift toward producers that pair regional inventory with consistent purification records and technical support.
- Silicon-rich anode programs: Higher silicon content increases expansion stress and raises demands on the solid-electrolyte interphase during repeated charge cycles. Additive screening therefore moves earlier into cell design because swelling control and cycle retention depend on interface chemistry. Qualification spending is forecast to rise where battery developers move silicon-containing designs from pilot lines into higher-volume programs.
Opportunity Impact Analysis
| OPPORTUNITY | (~) % IMPACT ON CAGR | GEOGRAPHIC RELEVANCE | IMPACT TIMELINE |
|---|---|---|---|
| LiFSI scale-up for mixed-salt formulations | +0.8% | China, Japan and Europe | Medium term (2-4 years) |
| LFP formulation refinement outside China | +0.6% | United States, Europe and India | Long term (>= 4 years) |
| Residential and grid-storage electrolyte packages | +0.5% | Australia, United States and Europe | Medium term (2-4 years) |
| Sodium-ion and solid-state formulation programs | +0.4% | China, Japan and Europe | Long term (>= 4 years) |
Source: Fact.MR analysis. Updated Jul 9, 2026
- LiFSI scale-up: LiFSI is entering broader mixed-salt and functional-additive programs where formulators seek conductivity and low-temperature performance gains. Nippon Shokubai announced a 10,000 metric ton annual expansion at its China joint venture in April 2026. Commercial opportunity is expected to concentrate around purity assurance and cost reduction across larger qualified volumes.
- LFP formulation refinement: LFP expansion outside its original production clusters creates work on low-temperature behavior and fast-charge performance. In May 2026, the IEA reported that more than 50 GWh of United States manufacturing capacity was redirected toward LFP production during 2025. Additive suppliers are projected to gain where they help new cell lines shorten chemistry-specific formulation learning cycles.
- Storage-specific electrolyte packages: Home and grid batteries place different stress on calendar life and cycling compared with passenger vehicles. DCCEEW reported in January 2026 that 200,000 household batteries were installed during the national program’s first six months. Formulators are anticipated to develop storage-oriented additive packages that support long residence times and repeated daily cycling.
- Sodium-ion and solid-state programs: Emerging battery designs require new electrolyte interfaces and impurity controls that differ from conventional liquid lithium-ion systems. In January 2025, the U.S. Department of Energy published its Battery R&D review covering liquid-electrolyte development and solid-state battery interfaces. Opportunity is estimated to favor producers that maintain flexible synthesis lines and application laboratories for early qualification work.
Restraints Impact Analysis
| RESTRAINT | (~) % IMPACT ON CAGR | GEOGRAPHIC RELEVANCE | IMPACT TIMELINE |
|---|---|---|---|
| Long automotive qualification cycles | -0.8% | Global automotive programs | Medium term (2-4 years) |
| Moisture and impurity control burden | -0.6% | Global manufacturing hubs | Short term (<= 2 years) |
| Feedstock and lithium-salt cost volatility | -0.5% | China, Europe and North America | Medium term (2-4 years) |
| Policy and localization uncertainty | -0.3% | United States and Europe | Medium term (2-4 years) |
Source: Fact.MR analysis. Updated Jul 9, 2026
- Long qualification cycles: Automotive cell programs require repeated cycling and abuse testing before a new additive package enters mass production. A supplier change often triggers comparison work across formation and storage conditions before commercial cell programs accept equivalent production materials. Adoption is expected to remain selective where qualification capacity is limited and cell makers prioritize proven formulations during production ramps.
- Moisture and impurity burden: Trace contamination affects electrolyte stability and forces producers to invest in purification and controlled handling. Tight specifications raise operating costs before a material reaches customer validation lines and continues through repeated cell qualification testing cycles. Expansion is projected to favor producers that keep impurity profiles consistent across batches and document handling controls from synthesis through shipment.
- Feedstock and salt volatility: Additive economics remain exposed to fluorine chemistry inputs and lithium-salt supply conditions across regional chains. Price shifts complicate long-term quotations for compounds used at low dosage but high qualification cost. Procurement teams are anticipated to diversify qualified sources where technical equivalence is demonstrated without destabilizing cell performance.
- Policy and localization uncertainty: Battery investment plans change when incentives or sourcing rules shift across major production regions and project pipelines. In May 2026, the IEA reported that United States EV battery deployment held about 10% of the global total during 2025. Supplier expansion is estimated to proceed cautiously where project timing and cell chemistry plans remain exposed to policy changes.
Which countries are scaling Battery Electrolyte Additives Market fastest?
India 14.0%; China 13.3%; Australia 12.0%; United Kingdom 11.7%; United States 11.5%; Germany 11.2%; Japan 10.9%.
Battery Electrolyte Additives Market analysis is segmented into North America and Europe alongside Asia Pacific. Latin America and the Middle East & Africa complete the regional coverage framework used for country and demand comparisons.
| COUNTRY | CAGR |
|---|---|
| India | 14.0% |
| China | 13.3% |
| Australia | 12.0% |
| United Kingdom | 11.7% |
| United States | 11.5% |
| Germany | 11.2% |
| Japan | 10.9% |
Source: Fact.MR analysis. Updated Jul 9, 2026
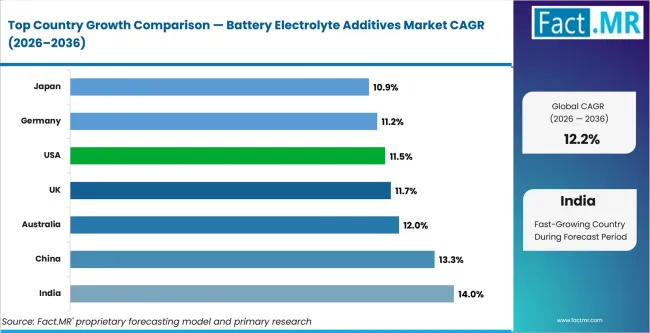
Battery Electrolyte Additives Market Cagr Analysis By Country | Source: Fact.MR
What is powering India's lead?
14.0% CAGR, driven by domestic cell manufacturing and electric mobility programs.
India is building cell-production capability through the Ministry of Heavy Industries and its ACC battery manufacturing program. The market is expected to record 14.0% CAGR during the forecast period, as local cell projects deepen formulation and qualification work. PIB reported in February 2026 that the national ACC program targets 50 GWh of manufacturing capacity, giving additive suppliers a clearer route into local qualification pipelines.
How is China scaling Battery Electrolyte Additives demand?
13.3% CAGR, supported by dense battery clusters and integrated electrolyte supply chains.
China combines large cell plants with nearby additive and electrolyte producers across established battery clusters. In February 2026, the National Bureau of Statistics reported that China produced 16.524 million new energy vehicles during 2025. The market is projected to post 13.3% CAGR between 2026 and 2036, as local technical teams shorten trial cycles between additive suppliers and cell factories.
What supports the Australia outlook?
12.0% CAGR, propelled by home battery uptake and utility storage development.
Australia is expanding battery deployment through household incentives and larger grid-support projects that create long calendar-life requirements. The market is anticipated to advance at 12.0% CAGR over the assessment period, as storage integrators demand chemistry packages suited to repeated cycling. DCCEEW reported in January 2026 that around 4.7 GWh of home battery capacity had been installed since the national program began.
What underpins the United Kingdom growth?
11.7% CAGR, attributable to zero-emission vehicle registrations and battery manufacturing investment.
United Kingdom demand is tied to vehicle electrification and efforts to build more local battery production capacity. The Department for Transport reported in April 2026 that 473,000 zero-emission cars were first registered during 2025. Demand is estimated to record 11.7% CAGR by 2036, as automotive programs generate more cell validation and regional electrolyte sourcing work.
How is the United States developing additive demand?
11.5% CAGR, shaped by utility storage additions and domestic battery-material investment.
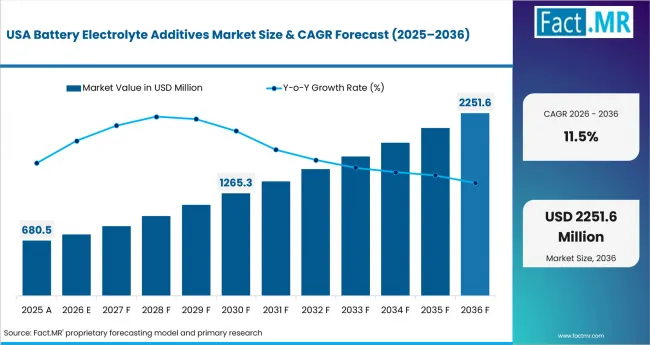
Battery Electrolyte Additives Market Country Value Analysis | Source: Fact.MR
United States additive demand draws from stationary storage projects and new cell manufacturing lines across several states. The market is forecast to post 11.5% CAGR from 2026 to 2036, as cell makers localize more material qualification and technical sourcing. The Energy Information Administration reported in February 2026 that developers added a record 15 GW of utility-scale battery storage during 2025.
What supports Germany's market outlook?
11.2% CAGR, supported by battery-cell investment and automotive qualification demand.
Germany is expanding battery-cell and material programs within a large automotive manufacturing base. The market is projected to record 11.2% CAGR during the forecast period as regional cell projects increase electrolyte qualification demand. The Federal Ministry for Economic Affairs and Climate Action reported in February 2025 that the government continues targeted investment in battery-cell manufacturing and other key technologies.
What is shaping Japan's market expansion?
10.9% CAGR, driven by domestic battery strategy and next-generation cell development.
Japan combines established battery materials expertise with renewed manufacturing and next-generation technology goals. The market is anticipated to post 10.9% CAGR over the assessment period as local programs expand qualification activity for advanced electrolyte systems. METI revised its Battery and Power Industry Strategy in June 2026 with a domestic manufacturing target of 150 GWh per year for the 2030s.
Who leads the Battery Electrolyte Additives Market?
Tinci Materials Technology and BASF SE compete alongside Shanshan Technology plus Daikin Industries.
Tinci Materials Technology competes through electrolyte and additive product lines across lithium-ion battery formulations. BASF SE participates through battery materials and additive technologies that support cell manufacturing requirements. Shanshan Technology competes across battery-material and electrolyte supply programs for vehicle and storage applications.
Daikin Industries develops fluorochemical battery materials that include electrolyte additives and solvents. Competition is shaped by product purity and formulation support because customer qualification links additive packages to specific battery programs. Regional supply depth also matters where cell makers require repeatable batches and responsive technical assistance.
Which companies are the key providers?
Capchem Technology, Tinci Materials Technology, BASF SE, Shanshan Technology, Daikin Industries
- Capchem Technology
- Tinci Materials Technology
- BASF SE
- Shanshan Technology
- Daikin Industries
Bibliography
- Shenzhen Capchem Technology Co., Ltd. (2026). Battery chemicals. Capchem.
- Central Glass Co., Ltd. (2026). Electrolytes. Central Glass Co., Ltd.
- Daikin Industries, Ltd. (2026). Battery materials. Daikin Chemicals.
- Department of Climate Change, Energy, the Environment and Water. (2026, January 17). 200,000 bill-busting batteries installed in just six months. Australian Government.
- Department for Transport. (2026, April 29). Vehicle licensing statistics, United Kingdom: 2025. GOV.UK.
- International Energy Agency. (2026, May 20). Electric vehicle batteries: Global EV Outlook 2026. International Energy Agency.
- Ministry of Economy, Trade and Industry. (2026, June 2). Battery Industry Strategy revised as the Battery and Power Industry Strategy. Government of Japan.
- Ministry of Heavy Industries. (2026, February 10). PLI Scheme for Advanced Chemistry Cells. Press Information Bureau, Government of India.
- National Bureau of Statistics of China. (2026, February 28). Statistical communiqué of the People’s Republic of China on the 2025 national economic and social development. National Bureau of Statistics of China.
- Nippon Shokubai Co., Ltd. (2026, April 28). Nippon Shokubai to Expand LiFSI Capacity at China JV. Nippon Shokubai Co., Ltd.
- Soulbrain Co., Ltd. (2026). Secondary Battery Materials. Soulbrain Co., Ltd.
- Tinci Materials. (2026). Annual Report 2024. Guangzhou Tinci Materials Technology Co., Ltd.
- U.S. Department of Energy. (2025, January). 2024 VTO Annual Merit Review Results Report – Battery R&D. U.S. Department of Energy.
- U.S. Energy Information Administration. (2026, February 20). New U.S. electric generating capacity expected to reach a record high in 2026. U.S. Energy Information Administration.
- Federal Ministry for Economic Affairs and Climate Action. (2025, February 4). Annual Economic Report 2025. Federal Government of Germany.
This Report Addresses
- The report provides strategic intelligence on the Battery Electrolyte Additives market across additive types, battery chemistries, functions, and end-use applications that influence battery performance and commercialization strategies.
- Segment analysis covers Vinylene Carbonate (VC) and Fluoroethylene Carbonate (FEC) as the leading additive categories supporting enhanced battery efficiency, safety, and cycle life.
- Regional outlook evaluates China and Japan alongside South Korea. The comparison also covers the United States and Germany alongside India and other key battery manufacturing hubs.
- Competitive analysis profiles Capchem Technology and Tinci Materials Technology alongside BASF SE. The provider landscape also covers Shanshan Technology, Soulbrain Co., Ltd., Daikin Industries, and Central Glass Co., Ltd.
- Type assessment covers VC (Vinylene Carbonate) and FEC (Fluoroethylene Carbonate) alongside Lithium Salts, Flame Retardants, and Other Electrolyte Additives.
- Function assessment covers SEI Formation and Conductivity Enhancement alongside Flame Retardancy, Overcharge Protection, Thermal Stability Improvement, and Gas Suppression.
- Battery Type assessment covers Lithium-Ion Batteries and Lithium Iron Phosphate (LFP) Batteries alongside Solid-State Batteries, Nickel Manganese Cobalt (NMC) Batteries, and other advanced battery chemistries.
- End Use assessment covers Electric Vehicles and Energy Storage Systems alongside Consumer Electronics, Industrial Equipment, and Emerging Mobility Applications.
- Market dynamics analysis evaluates EV adoption trends, battery safety requirements, energy storage deployment, technological innovations, raw material availability, and regulatory developments influencing market growth.
- The report examines emerging opportunities in high-energy-density batteries, fast-charging technologies, next-generation electrolyte formulations, and advanced battery systems supporting global electrification initiatives.
What does the Battery Electrolyte Additives Market cover?
VC and FEC alongside lithium salts and flame retardants are used to support battery electrolyte performance.
The Battery Electrolyte Additives Market covers specialty compounds added to electrolyte formulations to manage interface formation and cell stability. Coverage includes VC and FEC alongside lithium salts, flame retardants and other additive types used across rechargeable battery programs.
The market differs from the broader electrolyte category because commercial value comes from low-dose functional chemicals and their qualification support. Base solvents and bulk electrolyte salts remain outside the boundary unless they are sold specifically as functional additives inside a qualified formulation package.
What is included in the scope?
Battery electrolyte additives support electric vehicles and consumer electronics alongside energy storage systems and industrial battery applications.
The scope includes VC and FEC alongside lithium salts and flame retardants plus other additive types used across qualified battery formulations. Battery Type coverage spans lithium-ion and lead-acid systems along with other battery categories. Function analysis covers SEI Formation and Overcharge Protection. It also covers Flame Retardancy and Conductivity Enhancement. End Use coverage includes Electric Vehicles and Consumer Electronics. It also includes Energy Storage Systems and Industrial applications. Adjacent battery electrolyte solvents provide upstream formulation context while lithium-ion electrolyte systems frame the broader blend boundary.
What is excluded from the scope?
Base electrolyte solvents and complete battery packs are outside the scope.
The scope excludes bulk carbonate solvents sold without additive functionality and finished battery packs sold as complete energy-storage products. Cathode materials and anode powders remain outside the boundary unless their discussion is required to explain a specific electrolyte-additive qualification mechanism.
How was the analysis built?
120+ sources, 40+ company portfolios, 25+ countries, 20+ interviews.
- Primary Research:
- Primary research includes interviews with battery electrolyte additive manufacturers, battery cell producers, material scientists and battery technology developers. It also includes input from electric vehicle battery suppliers, energy storage system providers, procurement managers and research institutions involved in battery performance enhancement and commercialization.
- Desk Research:
- Desk research reviews battery industry statistics, electric vehicle production trends, energy storage deployment data, electrolyte additive product portfolios and company announcements. Technical publications, regulatory developments, patent filings, battery chemistry studies and supplier catalogs are also assessed to evaluate market trends and competitive positioning.
- Market-Sizing and Forecasting:
- Forecasting uses battery production activity, electric vehicle adoption, energy storage investments, electrolyte additive loading rates and battery material pricing across major regions. Models consider demand for lithium-ion batteries, battery safety requirements, cycle-life enhancement technologies, fast-charging developments and evolving battery chemistry preferences influencing additive consumption.
- Data Validation and Update Cycle:
- Forecasts are validated through supplier checks and industry interviews that test assumptions on additive adoption, battery manufacturing trends and technology deployment patterns. Portfolio mapping, battery value-chain assessment and stakeholder feedback help confirm market direction, while ongoing reviews of product launches, regulatory developments and battery industry investments support forecast updates.
Segmentation
What is the report’s scope and coverage?
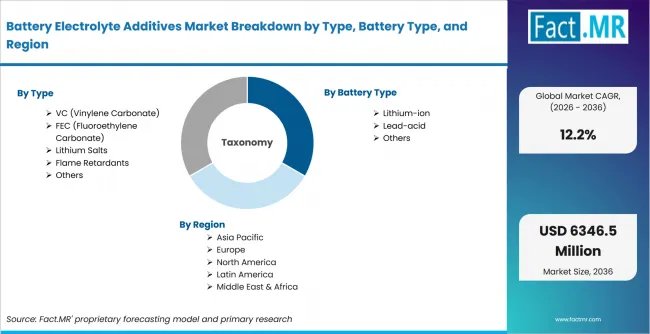
Battery Electrolyte Additives Market Breakdown By Type, Battery Type, And Region | Source: Fact.MR
| Attribute | Details |
|---|---|
| Quantitative Units | USD million |
| Market Definition | Specialty functional compounds added to battery electrolytes to support SEI formation, overcharge protection, flame retardancy and conductivity enhancement across rechargeable battery applications |
| Type | VC (Vinylene Carbonate); FEC (Fluoroethylene Carbonate); Lithium Salts; Flame Retardants; Others |
| Battery Type | Lithium-ion; Lead-acid; Others |
| Function | SEI Formation; Overcharge Protection; Flame Retardancy; Conductivity Enhancement |
| End Use | Electric Vehicles; Consumer Electronics; Energy Storage Systems; Industrial |
| Regions Covered | North America; Europe; Asia Pacific; Latin America; Middle East & Africa |
| Countries Covered | India; China; Australia; United Kingdom; United States; Germany; Japan |
| Key Companies Profiled | Capchem Technology; Tinci Materials Technology; BASF SE; Shanshan Technology; Daikin Industries |
| Forecast Period | 2026 to 2036 |
| Approach | Hybrid top-down and bottom-up approach using battery production; battery-type mix; additive-type demand; functional attachment rates; end-use demand; qualification cycles; regional supply capacity and supplier portfolio validation |
Source: Fact.MR analysis. Updated Jul 9, 2026
How is the market segmented?
-
By Type:
- VC (Vinylene Carbonate)
- FEC (Fluoroethylene Carbonate)
- Lithium Salts
- Flame Retardants
- Others
-
By Battery Type:
- Lithium-ion
- Lead-acid
- Others
-
By Function:
- SEI Formation
- Overcharge Protection
- Flame Retardancy
- Conductivity Enhancement
-
By End Use:
- Electric Vehicles
- Consumer Electronics
- Energy Storage Systems
- Industrial
-
By Region:
- North America
- United States
- Europe
- United Kingdom
- Germany
- Asia Pacific
- India
- China
- Australia
- Japan
- Latin America
- Middle East & Africa
- North America
Frequently Asked Questions
How is VC (Vinylene Carbonate) positioned within the Battery Electrolyte Additives Market?
What role does Lithium-ion play in the Battery Electrolyte Additives Market?
How prominent is SEI formation in the Battery Electrolyte Additives Market?
What contribution do electric vehicles make to Battery Electrolyte Additives Market demand?
Which country shows notable growth potential in the Battery Electrolyte Additives Market?
How is the Battery Electrolyte Additives Market expected to develop in China?
What outlook is anticipated for Australia in the Battery Electrolyte Additives Market?
How is demand projected to evolve in the United Kingdom?
What trend characterizes the United States Battery Electrolyte Additives Market?
How does Germany perform in the Battery Electrolyte Additives Market?
What is Japan’s growth outlook in the Battery Electrolyte Additives Market?
What factor primarily supports market expansion?
Which challenge continues to influence additive adoption?
Why does VC (Vinylene Carbonate) remain important in the Battery Electrolyte Additives Market?
What supports Electric Vehicle demand for battery electrolyte additives?
Who worked on this report


Preview the report firsthand - request a free sample
Free SampleGet the brochure for pricing and purchase details
Download PDF