- Market Value (2025): USD 55.6 Mn
- Estimated Value (2026): USD 67 Mn
- Forecast Value (2036): USD 430 Mn
- CAGR (2026-2036): 20.4%
What is the Chamber Matching Software Market forecast to be worth by 2036?
USD 67 million in 2026 to USD 430 million by 2036 at 20.4% CAGR.
- The chamber matching software market crossed a valuation of USD 55.6 million in 2025 as fabs added tighter release checks around chamber drift.
- Demand is projected to increase from USD 67 million in 2026 to USD 430 million by 2036.
- The market is forecast to record 20.4% CAGR from 2026 to 2036 owing to foundry fleets and memory lines needing repeatable chamber fingerprints.
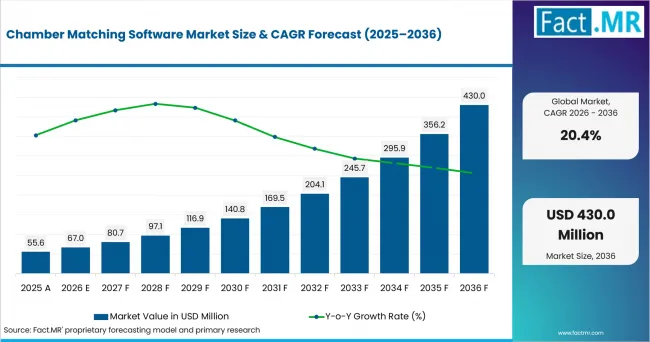
Chamber Matching Software Market Value Analysis | Source: Fact.MR
What are the defining numbers behind Chamber Matching Software Market growth?
USD 363 million absolute opportunity by 2036, led by Sensor-signature matching, Etch and Foundries.
- Demand Drivers in the Market
- Fab engineers need sensor fingerprints so drift is found before a released recipe loses process margin.
- Process owners require virtual-metrology matching because wafers cannot wait for every offline measurement step.
- Equipment teams need golden-tool references to keep production chambers aligned with the approved process baseline.
- Foundry account teams are expected to prioritize software that proves chamber consistency across customer recipes.
- Key Segments Analyzed
- By Matching Method: Sensor-signature matching is expected to hold 40.0% share in 2026 due to its direct use of chamber data streams.
- By Process Area: Etch is projected to account for 31.0% share in 2026 because small plasma shifts can move profile results outside release limits.
- By Deployment: On-prem is anticipated to capture 54.0% share in 2026 owing to process-recipe security and low-latency tool data handling.
- By End User: Foundries are estimated to represent 46.0% share in 2026 as multi-customer fabs need repeatable transfer across chambers and sites.
- Analyst Opinion at Fact.MR
- Shambhu Nath Jha, Principal Consultant at Fact.MR, states, "Chamber matching software is drawing attention because fabs need proof that a process chamber still behaves like the qualified tool. Production release is expected to depend on sensor evidence, model governance and recipe-transfer discipline. Suppliers should combine equipment fingerprints, virtual-metrology models and service support that fab engineers can audit quickly."
- Strategic Implications
- Fab operations teams should define fingerprint thresholds before transferring recipes across tool groups.
- Software vendors should make model drift visible after maintenance events.
- Equipment OEMs should connect matching functions with field service records.
- Investors should separate direct chamber-control exposure from broad fab analytics software.
Taiwan is expected to post 22.25% CAGR through 2036 due to foundry concentration and cross-site recipe movement. The USA is projected to record 22.20% CAGR owing to digital-twin research and local fab investment. South Korea is anticipated to advance at 22.03% CAGR as memory production requires repeatable chamber control. China is estimated to hold 22.02% CAGR led by integrated-circuit output and local engineering depth. Japan is forecast to reach 21.97% CAGR supported by process-control expertise and equipment spending.
How does the Chamber Matching Software Market break down by segment?
Sensor-signature matching accounts for 40.0%; Etch accounts for 31.0%.
Which matching method dominates?
Sensor-signature matching is projected to hold 40.0% share in 2026.
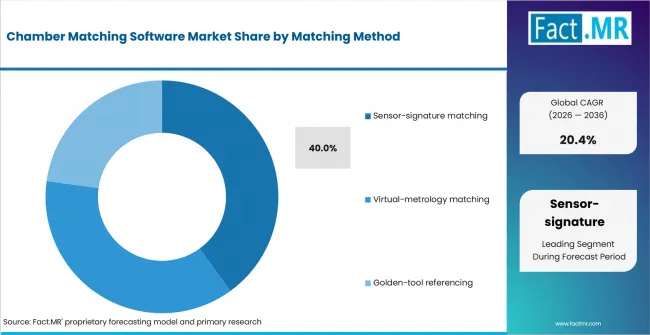
Chamber Matching Software Market Analysis By Matching Method | Source: Fact.MR
Sensor-signature matching is expected to lead Matching Method with 40.0% share in 2026 because it uses live equipment signals to compare chamber behavior across tools. Fabs can use these signatures to identify drift, support matching decisions and maintain more consistent process conditions before equipment is released for production.
What leads the Process Area segment?
Etch is anticipated to account for 31.0% share in 2026.
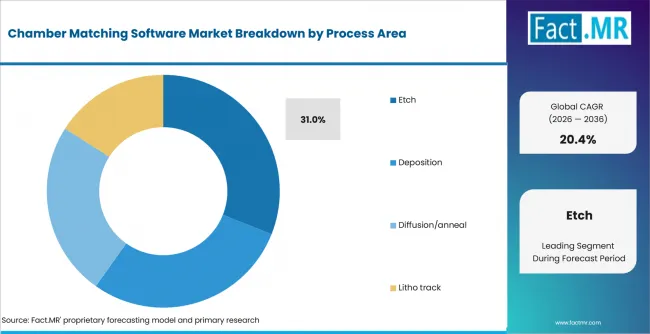
Chamber Matching Software Market Analysis By Process Area | Source: Fact.MR
Etch is projected to lead Process Area with 31.0% share in 2026 because plasma behavior and profile control require tight chamber consistency. SEMI reported in April 2026 that worldwide semiconductor equipment sales reached USD 135.1 billion in 2025, up 15.0% from 2024, supporting broader tool-management demand.
How does Deployment shape demand?
On-prem is expected to capture 54.0% share in 2026.
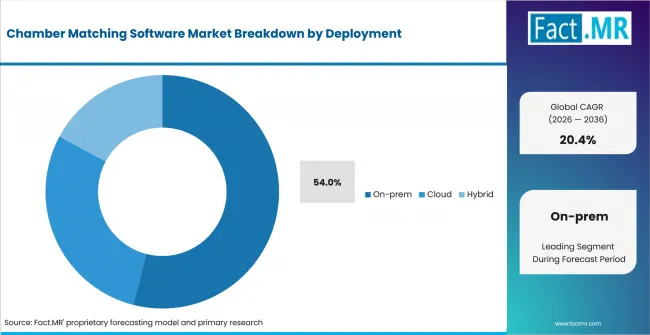
Chamber Matching Software Market Analysis By Deployment | Source: Fact.MR
On-prem deployment is anticipated to lead Deployment with 54.0% share in 2026 because fabs prioritize recipe security and direct access to tool data. Keeping matching software within controlled environments supports faster integration with equipment signals while limiting exposure of sensitive process information and production recipes.
What supports Foundries within End User?
Foundries are forecast to represent 46.0% share in 2026.
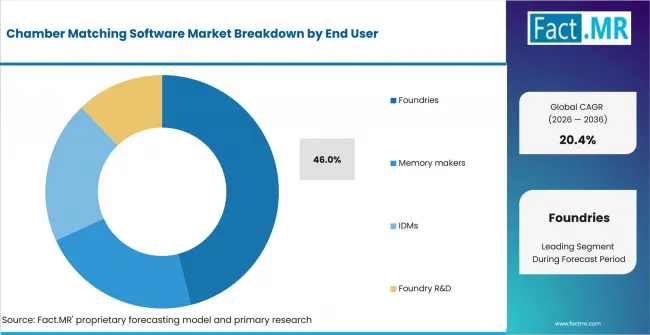
Chamber Matching Software Market Analysis By End User | Source: Fact.MR
Foundries are forecast to lead End User with 46.0% share in 2026 because multi-customer fabs require repeatable equipment behavior across diverse process recipes. Chamber-matching software can help maintain tool consistency, support qualification work and reduce process variation where high utilization and frequent recipe changes increase operational complexity.
What is accelerating Chamber Matching Software Market adoption, and what is holding it back?
Fleet fingerprinting drives it; data integration and model drift restrain it.
Drivers Impact Analysis
| DRIVER | (~) % IMPACT ON CAGR | GEOGRAPHIC RELEVANCE | IMPACT TIMELINE |
|---|---|---|---|
| Sensor fingerprinting of chamber fleets | +4.1% | Taiwan, USA, South Korea | Short term (<= 2 years) |
| Recipe transfer across fabs | +3.4% | Taiwan, USA, China | Short term (<= 2 years) |
| Virtual-metrology expansion | +2.8% | USA, Japan, South Korea | Medium term (2-4 years) |
| Etch and deposition fleet density | +2.4% | Taiwan, South Korea, China | Medium term (2-4 years) |
| Edge and cloud analytics integration | +1.5% | Global | Long term (>= 4 years) |
- Sensor fingerprinting of chamber fleets: Fabs compare pressure, RF and endpoint traces against qualified baselines before fleet release.
- Recipe transfer across fabs: Process owners need a software trail when a recipe moves from pilot tools to production chambers.
- Virtual-metrology expansion: Modeled wafer results help engineers react before every physical measurement returns.
- Etch and deposition fleet density: Dense tool groups create more comparison points and more drift risk.
- Edge and cloud analytics integration: Edge tools keep time-sensitive alerts near the chamber while cloud use waits for security approval.
Opportunity Impact Analysis
| OPPORTUNITY | (~) % IMPACT ON CAGR | GEOGRAPHIC RELEVANCE | IMPACT TIMELINE |
|---|---|---|---|
| Cross-fab golden-tool libraries | +1.6% | Taiwan and USA | Medium term (2-4 years) |
| AI model lifecycle operations | +1.3% | USA and Japan | Medium term (2-4 years) |
| Integrated FDC and virtual metrology | +1.1% | South Korea and Taiwan | Medium term (2-4 years) |
| Equipment-OEM software partnerships | +0.9% | Global | Long term (>= 4 years) |
- Cross-fab golden-tool libraries: Multi-site fabs need a shared benchmark when the same process runs in separate locations.
- AI model lifecycle operations: Matching models need version control after maintenance and recipe changes.
- Integrated FDC and virtual metrology: Fault detection data becomes more useful when it predicts wafer-level results.
- Equipment-OEM software partnerships: OEM knowledge of chamber hardware can improve alert accuracy and reduce false drift alarms.
Restraints Impact Analysis
| RESTRAINT | (~) % IMPACT ON CAGR | GEOGRAPHIC RELEVANCE | IMPACT TIMELINE |
|---|---|---|---|
| Sensitive process data governance | -1.6% | Global fabs | Short term (<= 2 years) |
| Legacy tool integration | -1.2% | Older 200 mm and 300 mm fabs | Medium term (2-4 years) |
| Model drift after maintenance | -0.9% | Foundry and memory fabs | Short term (<= 2 years) |
| Export-control compliance | -0.7% | USA, China, South Korea | Long term (>= 4 years) |
- Sensitive process data governance: Chamber data can expose recipe details and tool health patterns.
- Legacy tool integration: Older chambers may lack clean data tags or consistent sensor histories.
- Model drift after maintenance: A chamber can behave differently after cleaning or part replacement.
- Export-control compliance: Software tied to process know-how can face review when deployed across borders.
Which countries are scaling Chamber Matching Software Market fastest?
- The country comparison spans 0.28 percentage point and forms a tight growth band across the forecast period.
- Taiwan remains 0.05 percentage point above the USA as foundry scale supports cross-chamber matching work.
- The USA remains 0.17 percentage point above South Korea through digital-twin funding and new memory investment.
- South Korea remains 0.01 percentage point above China as memory fabs require repeatable tool behavior.
- China remains 0.05 percentage point above Japan due to high integrated-circuit output and domestic fab expansion.
- Japan closes the displayed range through process-control expertise and equipment production depth.
Comparable CAGRs create different entry conditions because fab scale, tool data rules and local engineering depth vary by country. Chamber Matching Software Market is segmented into North America, Latin America, Europe, East Asia, South Asia and Pacific, Middle East and Africa.
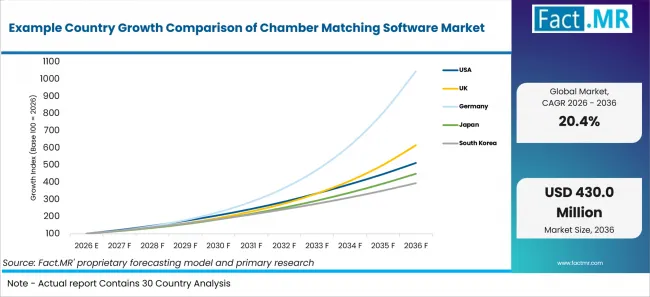
Example Country Growth Comparison Of Chamber Matching Software Market | Source: Fact.MR
| Country | CAGR (2026-2036) |
|---|---|
| Taiwan | 22.25% |
| USA | 22.20% |
| South Korea | 22.03% |
| China | 22.02% |
| Japan | 21.97% |
What supports Taiwan adoption?
22.25% CAGR, supported by foundry scale and pilot-line activity.
Taiwan’s growth reflects dense foundry operations and expanding pilot-line investment. SEMI reported that Taiwan’s semiconductor equipment spending reached a record USD 31.5 billion in 2025, while Taiwan’s MOEA announced in February 2026 the groundbreaking of a 12-inch advanced semiconductor pilot line representing an investment of NT$3.77 billion. Recipe-security requirements, trade exposure and high-mix tool configurations may slow broader chamber-matching deployment.
How is the USA scaling demand?
22.20% CAGR, driven by digital twins and local fab investment.
USA growth is supported by major semiconductor investment and greater use of digital production models. NIST reported in July 2026 that TSMC’s planned U.S. investment had reached USD 265 billion, while Micron announced in July 2026 that its planned U.S. fab and technology investments had increased to more than USD 250 billion through 2035. Tool-data inconsistency, security reviews and weaker equipment spending may constrain software deployment.
What supports South Korea growth?
22.03% CAGR, supported by memory output and tool matching.
South Korea’s growth reflects its large memory manufacturing base and need for repeatable chamber performance. MOTIR reported that South Korea’s semiconductor exports reached USD 173.4 billion in 2025, up 22.2%, while Ministry of Data and Statistics data showed that equipment investment increased 9.7% year over year in May 2026. Validation requirements and site-level data separation may slow deployment.
How is China building demand?
22.02% CAGR, backed by integrated-circuit output and local engineering.
China’s growth is supported by expanding integrated-circuit production and substantial equipment investment. China’s integrated-circuit output increased 24.3% year over year in Q1 2026, while SEMI reported that semiconductor equipment spending in China reached USD 49.3 billion in 2025. Export controls, inconsistent tool data and baseline-approval requirements may restrain chamber-matching software adoption.
What underpins Japan performance?
21.97% CAGR, led by process-control expertise and equipment depth.
Japan’s growth reflects established semiconductor equipment expertise and careful process-control practices. SEAJ projected sales of Japanese-made semiconductor manufacturing equipment at JPY 6.55 trillion in fiscal 2026, while government and private-sector funding for Rapidus totaled JPY 267.6 billion as of February 2026. Conservative qualification cycles and custom connector requirements may lengthen chamber-matching software pilots.
Who leads the Chamber Matching Software Market?
Applied Materials and Lam Research provide strong direct public evidence of chamber- and fleet-level process-control capabilities, while Cohu’s Tignis/PAICe software and PDF Solutions add process-control and analytics depth.
Applied Materials’ current AIx platform provides real-time chamber analytics, recipe fingerprinting and AppliedPRO process-recipe optimization. Lam Research contributes direct automated fingerprinting and system matching through Equipment Intelligence. These capabilities are closely aligned with chamber comparison and recipe-transfer workflows.
Cohu’s Tignis/PAICe software supports physics-driven AI process control, virtual metrology and process-drift/recipe tuning. PDF Solutions provides semiconductor process-control analytics and explicitly describes tool/chamber matching workflows. Synopsys incorporates semiconductor process-control solutions acquired from BISTel, while Onto Innovation provides FDC and process-control analytics. Competition is expected to depend on sensor-data access, model governance and fab security approval.
Which companies are the key providers?
Key companies include Applied Materials, Inc., Lam Research Corporation, Cohu, Inc. (Tignis/PAICe), PDF Solutions, Inc., Synopsys, Inc. (BISTel semiconductor solutions), Onto Innovation Inc.
- Applied Materials, Inc.
- Lam Research Corporation
- Cohu, Inc. (Tignis/PAICe)
- PDF Solutions, Inc.
- Synopsys, Inc. (BISTel semiconductor solutions)
- Onto Innovation Inc.
What is the report’s scope and coverage?
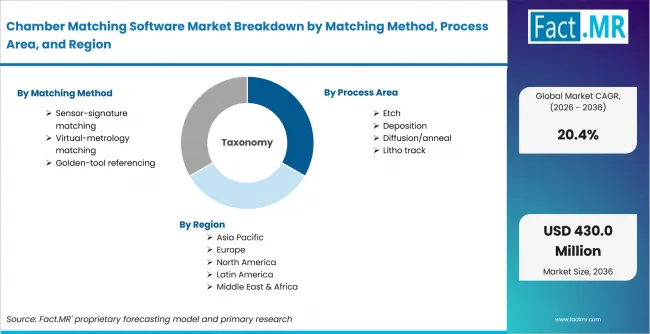
Chamber Matching Software Market Breakdown By Matching Method, Process Area, And Region | Source: Fact.MR
| Attribute | Details |
|---|---|
| Quantitative Units | USD million in 2026 to USD million by 2036 at CAGR |
| Market Definition | Software used to compare semiconductor process chamber behavior where sensor signatures, modeled wafer outcomes and golden-tool references determine process release |
| Matching Method | Sensor-signature matching; Virtual-metrology matching; Golden-tool referencing |
| Process Area | Etch; Deposition; Diffusion/anneal; Litho track |
| Deployment | On-prem; Cloud; Hybrid |
| End User | Foundries; Memory makers; IDMs; Foundry R&D |
| Regions Covered | North America; Latin America; Europe; East Asia; South Asia and Pacific; Middle East and Africa |
| Countries Covered | Taiwan; USA; South Korea; China; Japan |
| Key Companies Profiled | Applied Materials, Inc.; Lam Research Corporation; Cohu, Inc. (Tignis/PAICe); PDF Solutions, Inc.; Synopsys, Inc. (BISTel semiconductor solutions); Onto Innovation Inc. |
| Forecast Period | 2026 to 2036 |
| Approach | Hybrid top-down and bottom-up approach using semiconductor equipment demand; chamber-sensor data; virtual-metrology workflows; recipe-transfer activity; deployment mode; country adoption patterns and company portfolio review |
Bibliography
- Easterday, D. (2026, May 19). What is Equipment Intelligence®? (Semi 101). Lam Research.
- Ministry of Data and Statistics. (2026, June 30). Monthly Industrial Statistics, May 2026.
- Ministry of Economy, Trade and Industry. (2025, October 24). OT Security Guidelines for Semiconductor Device Factories Compiled in Japanese and English Versions.
- Ministry of Economy, Trade and Industry. (2026, February 27). Press Conference by Minister Akazawa (Excerpt).
- Ministry of Economic Affairs. (2026, February 11). MOEA breaks ground on Advanced Semiconductor R&D Center: Taiwan's first 12-inch pilot line to target AI, silicon photonics, and quantum technology.
- Ministry of Finance and Economy. (2026, May 15). Current Economic Situation, May 2026.
- Ministry of Trade, Industry and Resources. (2026, January 2). Korea's Annual Exports Reach New Highs in 2025.
- National Institute of Standards and Technology. (2026, July 16). Trump Administration Secures an Additional $100 Billion U.S. Semiconductor Manufacturing Investment for a Total of $265 Billion from TSMC.
- National Institute of Standards and Technology. (2025, June 12). President Trump Secures $200B Investment from Micron Technology for Memory Chip Manufacturing in the United States.
- SEMI. (2026, April 7). SEMI Reports Global Semiconductor Equipment Billings Reached $135 Billion in 2025, Up 15% Year-on-Year.
- State Council Information Office of the People's Republic of China. (2026, April 21). SCIO briefing on development of industry and information technology in the first quarter of 2026.
- General Administration of Customs of the People's Republic of China. (2026, January 8). China's Major Imports by Quantity and Value, Dec 2025 (in USD).
This Report Answers
- The report provides strategic intelligence on Chamber Matching Software Market adoption across Matching Method and Process Area decisions.
- Segment analysis covers Sensor-signature matching and Etch as the main share categories within the 2026 market.
- Country outlook evaluates Taiwan and the USA alongside South Korea, China and Japan.
- Competitive analysis profiles Applied Materials, Lam Research, Cohu (Tignis/PAICe), PDF Solutions, Synopsys and Onto Innovation without company share disclosure.
- Technology assessment covers Sensor-signature matching, Virtual-metrology matching and Golden-tool referencing.
- Process-area assessment covers Etch and Deposition. Diffusion/anneal and Litho track complete the process view.
- The forecast draws on provider checks, official semiconductor data, company developments and process-control evidence.
What does the Chamber Matching Software Market cover?
Sensor-signature matching, virtual-metrology matching and golden-tool referencing used for chamber behavior comparison.
The Chamber Matching Software Market covers software that compares process chamber behavior across semiconductor tools. Coverage includes matching functions used in etch, deposition, diffusion and litho-track environments where chamber drift can alter release outcomes.
The scope is narrower than general fab analytics because the software must support chamber-to-chamber comparison or recipe transfer. Adjacent semiconductor dry etch systems are included only when their data feeds a matching workflow. The same boundary applies to semiconductor diffusion equipment when anneal or diffusion chambers require fingerprint checks.
What is included in the scope?
Chamber matching software used across semiconductor process chambers and fab fleets.
The scope includes sensor-signature matching, virtual-metrology matching and golden-tool referencing. It covers etch chambers, deposition chambers, diffusion and anneal systems, and litho track modules when software compares chamber behavior. The included software can run on-prem, in cloud environments or in hybrid setups. Adjacent semiconductor chemical vapor deposition equipment is included only when deposition chamber data supports matching. Fabs may connect semiconductor defect inspection equipment outputs or e-beam wafer inspection systems results if those measurements train matching models.
What is excluded from the scope?
General fab analytics and standalone metrology tools are outside the scope.
General manufacturing execution software, yield dashboards and recipe-management tools are excluded unless they compare chamber behavior. HBM stack inspection, backside via inspection and panel warpage metrology remain outside the scope unless their outputs support a chamber matching model. Hardware-only remote plasma sources and cryogenic NAND etchers are also excluded unless the commercial package includes matching software tied to chamber behavior.
How Was the Analysis Built?
120+ sources, 35+ company portfolios, 25+ countries and more than 20 industry interviews.
- Primary Research: Primary research covers fab engineers, service teams, software architects, procurement teams and operations managers. Interviews examine selection rules and release-gate use.
- Desk Research: Desk research covers government statistics, equipment data, company pages, investor releases, technical notes and public policy. Evidence-bearing sources are documented in the bibliography.
- Market Sizing and Forecasting: Market estimates combine software adoption, installed equipment bases, process exposure, deployment choices, country fab activity and deployment barriers.
- Data Validation and Update Cycle: Findings are validated against public data, company activity, equipment spending, semiconductor output and portfolio mapping. Updates review product and software releases.
What does the Chamber Matching Software Market cover?
Sensor-signature matching, virtual-metrology matching and golden-tool referencing used for chamber behavior comparison.
The Chamber Matching Software Market covers software that compares process chamber behavior across semiconductor tools. Coverage includes matching functions used in etch, deposition, diffusion and litho-track environments where chamber drift can alter release outcomes.
The scope is narrower than general fab analytics because the software must support chamber-to-chamber comparison or recipe transfer. Adjacent semiconductor dry etch systems are included only when their data feeds a matching workflow. The same boundary applies to semiconductor diffusion equipment when anneal or diffusion chambers require fingerprint checks.
What is included in the scope?
Chamber matching software used across semiconductor process chambers and fab fleets.
The scope includes sensor-signature matching, virtual-metrology matching and golden-tool referencing. It covers etch chambers, deposition chambers, diffusion and anneal systems, and litho track modules when software compares chamber behavior. The included software can run on-prem, in cloud environments or in hybrid setups. Adjacent semiconductor chemical vapor deposition equipment is included only when deposition chamber data supports matching. Fabs may connect semiconductor defect inspection equipment outputs or e-beam wafer inspection systems results if those measurements train matching models.
What is excluded from the scope?
General fab analytics and standalone metrology tools are outside the scope.
General manufacturing execution software, yield dashboards and recipe-management tools are excluded unless they compare chamber behavior. HBM stack inspection, backside via inspection and panel warpage metrology remain outside the scope unless their outputs support a chamber matching model. Hardware-only remote plasma sources and cryogenic NAND etchers are also excluded unless the commercial package includes matching software tied to chamber behavior.
How Was the Analysis Built?
120+ sources, 35+ company portfolios, 25+ countries and more than 20 industry interviews.
- Primary Research: Primary research covers fab engineers, service teams, software architects, procurement teams and operations managers. Interviews examine selection rules and release-gate use.
- Desk Research: Desk research covers government statistics, equipment data, company pages, investor releases, technical notes and public policy. Evidence-bearing sources are documented in the bibliography.
- Market Sizing and Forecasting: Market estimates combine software adoption, installed equipment bases, process exposure, deployment choices, country fab activity and deployment barriers.
- Data Validation and Update Cycle: Findings are validated against public data, company activity, equipment spending, semiconductor output and portfolio mapping. Updates review product and software releases.
How is the market segmented?
-
By Matching Method
- Sensor-signature matching
- Virtual-metrology matching
- Golden-tool referencing
-
By Process Area
- Etch
- Deposition
- Diffusion/anneal
- Litho track
-
By Deployment
- On-prem
- Cloud
- Hybrid
-
By End User
- Foundries
- Memory makers
- IDMs
- Foundry R&D
-
By Region
- North America
- Latin America
- Europe
- East Asia
- South Asia and Oceania
- Middle East and Africa