- Market Value (2025): USD 14.6 Bn
- Estimated Value (2026): USD 15.8 Bn
- Forecast Value (2036): USD 34.1 Bn
- CAGR (2026-2036): 8.0%
What is the Circular Economy in Mining Market forecast to be worth by 2036?
USD 15.8 billion in 2026 to USD 34.1 billion by 2036, at an 8.0% CAGR.
- The Circular Economy in Mining Market crossed a valuation of USD 14.6 billion in 2025 as recovery projects moved closer to operating budgets.
- The industry is estimated to reach USD 15.8 billion in 2026, driven by rising recovery of valuable metals from electronic waste.
- Demand is projected to reach USD 34.1 billion by 2036 across mining and secondary material recovery value chains.
- The market is forecast to record an 8.0% CAGR from 2026 to 2036, as mine operators and processors expand recovery from existing material streams.
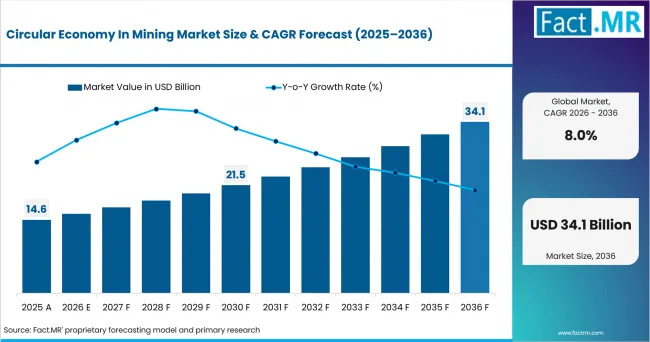
Circular Economy In Mining Market Market Value Analysis | Source: Fact.MR
What are the defining numbers behind Circular Economy in Mining Market growth?
USD 18.3 billion absolute opportunity by 2036.
Which demand drivers shape the market?
- Mine operators need higher recovery from tailings and waste rock because critical-mineral projects face long development cycles and tighter supply planning.
- Processing managers require closed-loop water systems supported by treatment steps that keep recycled water within plant-quality limits during repeated use cycles.
- Secondary metal processors need reliable collection and sorting routes that separate valuable metals from complex e-waste streams before refining.
- Smelter and refinery teams require consistent secondary feed specifications shaped by metal purity limits and contamination controls across downstream processing routes.
Which segments lead the market structure?
- By Mining Type: Surface Mining is expected to account for 57.0% share in 2026 because large material flows create more recovery points across waste streams.
- By End Use: Metal Producers are forecast to represent 45.0% share in 2026 as secondary feed qualification becomes central to circular metal supply.
- By Mineral: Base Metals are projected to capture 34.0% share in 2026 because established recycling routes support repeat downstream use.
- By Solution: Tailings Reprocessing is estimated to account for 32.0% share in 2026 as stored residues provide accessible feed for recovery testing.
What is the analyst opinion?
- Shambhu Nath Jha, Senior Analyst at Fact.MR, states, “Mining circularity is drawing attention because recovered material must meet a real processing specification before value is created. Adoption is expected to favor projects that connect waste characterization with proven separation and a clear downstream outlet. Suppliers should combine process engineering with mineral testing and operating support under one documented qualification path.”
What are the strategic implications?
- Mine owners should map tailings chemistry before committing capital so recovery projects begin with a realistic product specification and downstream route.
- Processing teams should track fresh-water intake and recycled-water quality together so water reuse does not reduce flotation or leaching performance.
- Recovery teams should define e-waste sorting criteria early so complex secondary feed enters refining with traceable material composition.
- Metal processors should define contaminant limits early and build sampling protocols that make secondary feeds easier to approve across contracted supply routes.
Mining companies are increasingly adopting ore-sorting solutions to enhance resource efficiency and support circular resource management strategies. TOMRA Mining reported in August 2025 that the Pilgangoora lithium sorting plant in Western Australia had capacity above 1,000 tonnes per hour. Sensor sorting rejects waste before downstream processing and raises resource use efficiency at operating scale. The development fits the wider shift toward circular mine design that treats early waste rejection as part of resource recovery planning.
India is expected to record a 9.8% CAGR during the forecast period as recycling incentives support secondary resource recovery. China is projected to post a 9.1% CAGR through 2036 as industrial recovery infrastructure expands. Australia is anticipated to advance at a 7.8% CAGR over the assessment period owing to mining-byproduct reprocessing. The United Kingdom is estimated to record a 7.5% CAGR through 2036 as domestic mineral recycling targets support processing investment. The United States is forecast to post a 7.3% CAGR across the forecast horizon due to mine-waste mapping and byproduct recovery support. Germany is projected to expand at a 7.0% CAGR because secondary raw-material recovery supports industrial circularity. Japan is estimated to record a 6.7% CAGR as metal recycling systems support resource security priorities.
How does the Circular Economy in Mining Market break down by segment?
Surface Mining leads with 57.0% share. Metal Producers follow with 45.0% share.
Which solution leads the market?
Tailings Reprocessing accounts for 32.0% share in 2026.
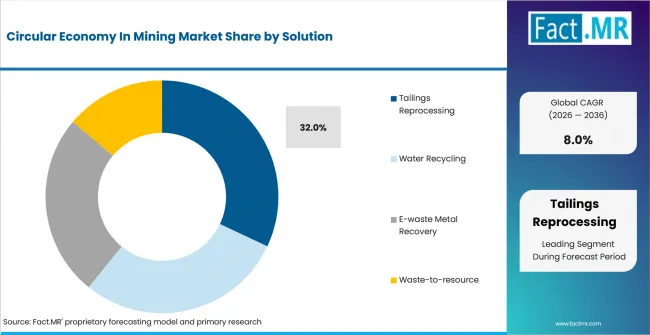
Circular Economy In Mining Market Analysis By Solution | Source: Fact.MR
Tailings Reprocessing is expected to account for 32.0% share in 2026 because stored residues provide accessible feed for recovery testing. Water Recycling supports operations that need repeated water use across grinding and separation circuits. E-waste Metal Recovery connects secondary metal streams with refiners that can qualify recovered feed. Waste-to-resource projects convert selected residues into usable mineral or material outputs after technical validation.
Which mineral category leads demand?
Base Metals are projected to represent 34.0% share in 2026.
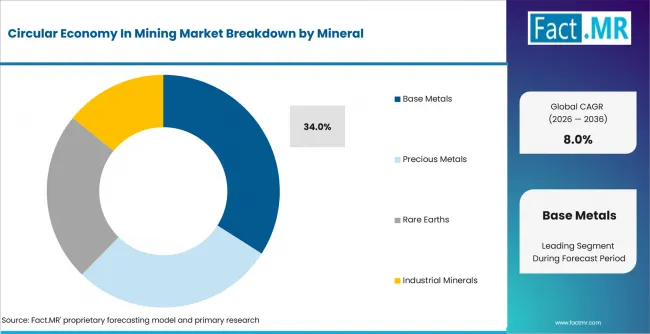
Circular Economy In Mining Market Analysis By Mineral | Source: Fact.MR
Base Metals are projected to represent 34.0% share in 2026 because copper and aluminum recovery routes have established downstream outlets. Precious Metals support selective recovery where small material volumes can justify intensive separation steps. Rare Earths require stricter feed characterization because separation complexity affects commercial recovery yields. Industrial Minerals depend on residue quality and customer specifications before recovered material enters repeat supply.
How does Mining Type shape demand?
Surface Mining records 57.0% share in 2026.
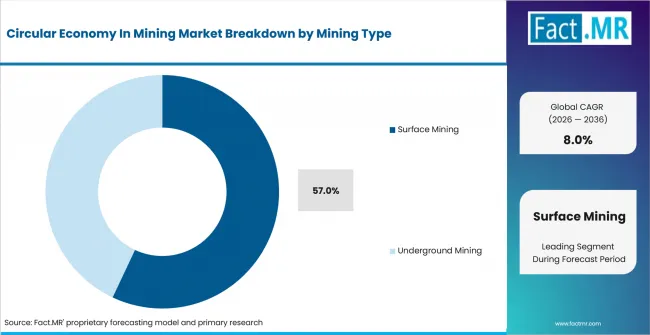
Circular Economy In Mining Market Analysis By Mining Type | Source: Fact.MR
Surface Mining is expected to hold 57.0% share in 2026 because open material movement creates more recovery points across tailings and waste streams. Underground Mining supports water recycling and material recovery where transport constraints increase the value of closed operational loops.
Which End Use segment leads demand?
Metal Producers account for 45.0% share in 2026.
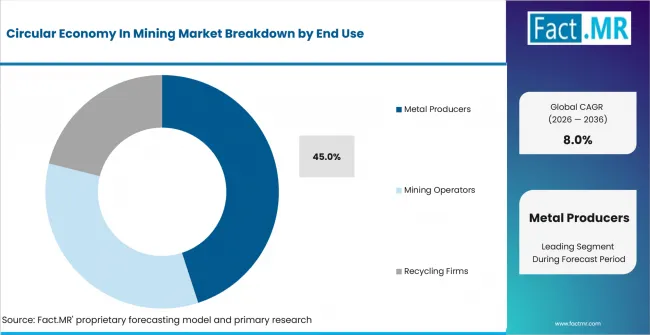
Circular Economy In Mining Market Analysis By End Use | Source: Fact.MR
Metal Producers are forecast to account for 45.0% share in 2026 as secondary feed qualification becomes central to circular metal supply. Mining Operators invest in recovery projects that improve waste utilization and reduce fresh resource inputs across production sites. Recycling Firms connect collection with sorting and downstream specification control for e-waste plus industrial mineral residues.
What is accelerating Circular Economy in Mining Market adoption, and what is holding it back?
Critical-mineral recovery supports demand. Variable waste mineralogy restrains project conversion.
Drivers Impact Analysis
| DRIVER | (~) % IMPACT ON CAGR | GEOGRAPHIC RELEVANCE | IMPACT TIMELINE |
|---|---|---|---|
| Critical-mineral supply security | +1.1% | India, United States and United Kingdom | Medium term (2–4 years) |
| Tailings valorization and byproduct recovery | +0.9% | Australia, China and North America | Medium term (2–4 years) |
| Closed-loop water management | +0.7% | Arid mining regions | Long term (4+ years) |
| E-waste metal recovery expansion | +0.5% | Europe and Asia Pacific | Long term (4+ years) |
| Public funding and recycling targets | +0.4% | India, United States and United Kingdom | Short term (≤2 years) |
Source: Fact.MR analysis. Updated Jul 9, 2026
- Critical-mineral supply security: Mine operators are reviewing tailings and process residues as above-ground mineral sources instead of treating every stream as disposal material. UNEP reported in March 2024 that global resource extraction is expected to rise 60% from 2020 levels by 2060 without stronger action. Recovery projects are expected to receive more screening attention where supply exposure justifies detailed characterization and pilot work.
- Tailings valorization and byproduct recovery: Industrial facilities already handle material that contains saleable minerals but lacks an approved recovery route. The U.S. Department of Energy announced up to USD 275 million in November 2025 for facilities recovering valuable minerals from industrial and coal byproducts. Project activity is projected to expand around sites where existing material handling lowers the cost of feed access.
- Closed-loop water management: Water reuse links circularity spending directly to plant continuity because recovered water returns to grinding and flotation circuits. Operators need treatment designs that control dissolved salts and suspended solids across repeated water cycles inside mineral processing circuits. Deployment is anticipated to favor integrated tailings and water systems that protect metallurgical performance while reducing dependence on fresh intake.
- E-waste metal recovery expansion: Complex electronics waste contains metals that require controlled collection and sorting before downstream refining. Recovery networks depend on feed identification and contamination control across variable device streams. Adoption is expected to broaden where recyclers can deliver repeatable secondary feed specifications to metal processors.
- Public funding and recycling targets: Policy programs are moving secondary material recovery closer to investment plans for critical minerals. India’s Ministry of Mines reviewed implementation progress in November 2025 for a critical-mineral recycling incentive scheme which is forecast to support projects that prove feed availability and recovery performance before full commercial expansion.
Opportunity Impact Analysis
| OPPORTUNITY | (~) % IMPACT ON CAGR | GEOGRAPHIC RELEVANCE | IMPACT TIMELINE |
|---|---|---|---|
| Critical minerals from legacy mine waste | +0.7% | United States and Australia | Medium term (2–4 years) |
| Sensor-based early waste rejection | +0.5% | Australia and China | Medium term (2–4 years) |
| Process-water recovery systems | +0.4% | Arid mining regions | Long term (4+ years) |
| E-waste and secondary metal loops | +0.3% | Europe and North America | Long term (4+ years) |
Source: Fact.MR analysis. Updated Jul 9, 2026
- Critical minerals from legacy mine waste: Historic mine sites offer material already extracted and placed at surface. This changes the early economics of resource access. In January 2026, the U.S. Geological Survey National Mine Waste Inventory listed first-version mine-waste features across 11 states. Opportunity is expected to widen as inventory programs separate technically suitable deposits from low-value waste before pilot campaigns begin.
- Sensor-based early waste rejection: Ore sorting creates a circularity route by keeping low-value material away from energy-intensive downstream circuits while protecting saleable mineral recovery. TOMRA Mining reported in June 2025 that CONTAIN field trials at Wolfram Bergbau reduced ore mineral losses by 33%. Adoption is projected to broaden where ore variability is measured reliably and rejected material has a defined handling plan.
- Process-water recovery systems: Tailings thickening and filtration create opportunities to recover water close to the plant instead of relying on distant return-water systems. The commercial route depends on balancing recovery rates with water chemistry and residue handling across the selected processing flowsheet. Projects are anticipated to favor suppliers that combine separation equipment with water-quality testing and operating support during ramp-up.
- E-waste and secondary metal loops: Smelters and recycling networks provide routes for complex secondary feed that meets controlled material specifications. In March 2025, Glencore reported that the Portovesme CRM Hub was selected among the first 47 Strategic Projects under the EU Critical Raw Materials Act. Opportunity is estimated to concentrate where collection contracts and material standards support repeatable feed quality across multiple sites.
Restraints Impact Analysis
| RESTRAINT | (~) % IMPACT ON CAGR | GEOGRAPHIC RELEVANCE | IMPACT TIMELINE |
|---|---|---|---|
| Variable waste mineralogy and grade | -0.6% | Global mine-waste projects | Medium term (2–4 years) |
| Capital and qualification costs | -0.5% | Mid-sized and junior operators | Medium term (2–4 years) |
| Legacy waste liability and ownership | -0.4% | North America, Australia and Europe | Long term (4+ years) |
| Secondary feed specification gaps | -0.3% | Global metals value chains | Medium term (2–4 years) |
Source: Fact.MR analysis. Updated Jul 9, 2026
- Variable waste mineralogy and grade: Tailings and waste rock differ by deposit type and by the processing methods used when the material was first produced. That variation requires representative sampling and mineral testing before a recovery route receives technical approval or pilot funding. Adoption is expected to remain selective where mineral grades or deleterious elements make product quality difficult to control across a full campaign.
- Capital and qualification costs: Circular projects still compete with core mine investments for engineering time and capital approval. Characterization and pilot testing add costs before downstream qualification produces a dependable revenue route for recovered material. Deployment is projected to move slowly where smaller operators lack shared testing facilities or a contracted outlet for the recovered product.
- Legacy waste liability and ownership: Older deposits often carry uncertain records on ownership and closure obligations that affect project structure before processing begins. EPA reported in June 2026 that more than 100,000 abandoned hardrock mines remain across the western states. Commercial recovery is anticipated to progress more smoothly where legal access and remediation duties are defined before technical development starts.
- Secondary feed specification gaps: Recovered material needs a customer specification that covers purity and harmful contaminants before it becomes a dependable saleable input. Inconsistent acceptance rules increase testing cycles across smelters and refiners that receive secondary mineral and metal feed streams. Adoption is forecast to remain slower where project teams identify a recoverable mineral but cannot secure a repeatable downstream qualification route.
Which countries are scaling Circular Economy in Mining Market fastest?
India 9.8%, China 9.1%, Australia 7.8%, The United Kingdom 7.5%, United States 7.3%, Germany 7.0%, Japan 6.7%.
Regional analysis covers North America and Europe alongside Asia Pacific, Central and South America plus the Middle East and Africa.
| COUNTRY | CAGR |
|---|---|
| India | 9.8% |
| China | 9.1% |
| Australia | 7.8% |
| United Kingdom | 7.5% |
| United States | 7.3% |
| Germany | 7.0% |
| Japan | 6.7% |
Source: Fact.MR analysis. Updated Jul 9, 2026
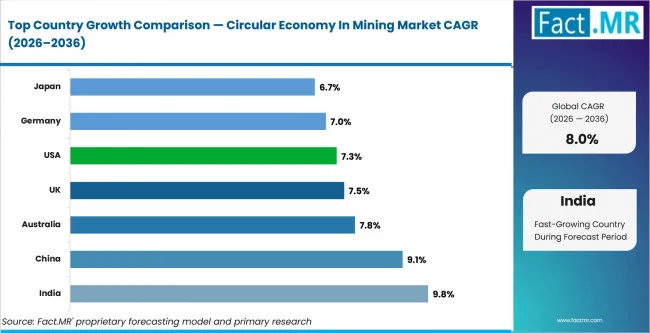
Circular Economy In Mining Market Cagr Analysis By Country | Source: Fact.MR
What is powering India’s lead?
9.8% CAGR, driven by critical-mineral recycling incentives and secondary resource recovery.
India is building a broader critical-mineral framework that connects geological discovery with recovery planning across domestic supply programs. The Press Information Bureau reported in April 2025 that the Geological Survey of India received a broad exploration assignment. The program covers 1,200 exploration projects within the national critical-mineral framework. The market is expected to record a 9.8% CAGR during the forecast period as project developers connect feed mapping with domestic recovery capacity.
How is China scaling circular mining demand?
9.1% CAGR, supported by industrial recovery infrastructure and mine-efficiency programs.
China combines a broad mining base with processing capacity that creates multiple residue streams for reuse and recovery. The National Bureau of Statistics reported in February 2025 that mining industry value added increased 3.1% during 2024. Demand is projected to post a 9.1% CAGR between 2026 and 2036, as operators connect resource efficiency with processing and waste-management investment.
What supports the Australia outlook?
7.8% CAGR, owing to common-use processing access and mining-byproduct reprocessing.
Australia is widening recovery options by pairing mine-reuse research with established processing knowledge across mineral regions. In May 2025, the NSW Government’s Mine Reuse Project identified 28 current and historic mine sites with potential critical-mineral or high-tech-metal value in old waste. The market is anticipated to advance at a 7.8% CAGR over the assessment period, as reprocessing projects move from historical inventories toward qualified recovery plans.
What underpins United Kingdom growth?
7.5% CAGR, attributable to domestic mineral recycling targets and processing capability.
United Kingdom policy now connects critical-mineral security with domestic production and secondary material recovery across national supply planning. The Department for Business and Trade set a recycling ambition in November 2025. The target would meet 20% of mineral needs through domestic recycling. The market is estimated to record a 7.5% CAGR across the forecast horizon as processors build qualification routes around domestic secondary feeds.
How is the United States developing circular mining demand?
7.3% CAGR, shaped by mine-waste mapping and federal byproduct recovery support.
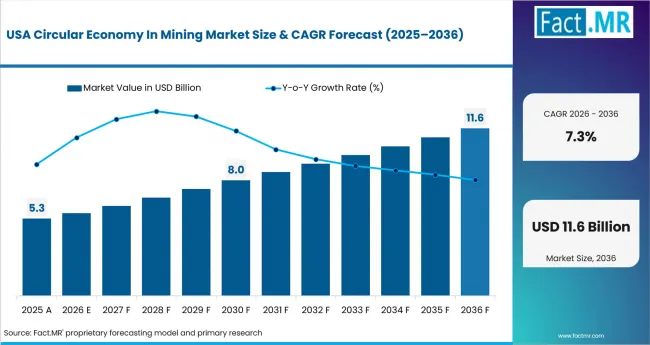
Circular Economy In Mining Market Country Value Analysis | Source: Fact.MR
Federal programs are building a clearer inventory of mine waste before recovery projects move into technical evaluation. In January 2025, the U.S. Department of Energy announced USD 32.75 million for critical-mineral projects using waste and other domestic feed streams. The market is forecast to post a 7.3% CAGR from 2026 to 2036, supported by characterization work that narrows sites for pilot recovery campaigns.
Why does secondary material use support Germany’s circular mining outlook?
7.0% CAGR, supported by secondary raw-material recovery and established industrial recycling capacity.
Germany’s circular mining opportunity is tied to an industrial system that already treats secondary materials as part of domestic resource planning. The Federal Ministry for the Environment reports that secondary raw materials currently cover about 13% of Germany’s total raw material consumption. The market is projected to record a 7.0% CAGR over the forecast period as metal producers and recyclers expand secondary feed use across industrial value chains. Solution providers gain stronger access where recovery systems can improve material traceability and connect recycled feed with established processing networks.
How are resource security priorities strengthening Japan’s circular mining demand?
6.7% CAGR 2036, shaped by established metal recycling systems and continued resource security priorities.
Japan’s dependence on imported mineral resources gives domestic metal recovery a strategic role beyond conventional waste treatment. In January 2025, METI materials reported that 7.48 million tons of self-generated steel scrap were reused within Japan’s steel production system. The market is estimated to record a 6.7% CAGR through 2036 as recycling networks support metal recovery and reduce pressure on primary feed imports. Technology providers gain relevance when sorting and recovery systems can return consistent secondary materials into established smelting and manufacturing operations.
Who leads the Circular Economy in Mining Market?
Boliden AB, Glencore, and Umicore are some key players in mining and recycling
Boliden AB and Umicore compete primarily on their ability to secure secondary feedstock and maximize metal recovery rates. Veolia differentiates itself through its industrial water management and waste treatment services, which support resource recovery programs at mining and processing sites. Aurubis, Novelis and Stena Recycling strengthen the competitive landscape with extensive downstream recycling infrastructure and established customer qualification networks.
Glencore and Umicore are particularly well positioned to process mining residues and complex secondary feed streams through integrated recovery and refining operations. Veolia's competitive advantage lies in water recycling and environmental management solutions. Aurubis and Stena Recycling focus on efficient metal collection systems and closed-loop supply chains that support circular manufacturing models. Companies that can combine reliable feedstock access with strong quality assurance and customer qualification capabilities are best positioned to transform circular economy initiatives into scalable and recurring commercial opportunities.
Which companies are the key providers?
Boliden AB and Glencore head the provider list. Umicore and Veolia follow with Aurubis plus Novelis and Stena Recycling.
- Boliden AB
- Glencore
- Umicore
- Veolia
- Aurubis
- Novelis (Hindalco)
- Stena Recycling
Bibliography
- Aurubis AG. (2025, September 24). Aurubis Richmond: First U.S. multimetal recycling plant starts production of strategic metals. Aurubis.
- Boliden AB. (2026, March 5). Boliden publishes Annual and Sustainability Report 2025. Boliden.
- European Commission. (2025, March 25). Selected strategic projects under the Critical Raw Materials Act. European Commission.
- Federal Ministry for the Environment, Nature Conservation, Nuclear Safety and Consumer Protection. (2025). The National Circular Economy Strategy. German Federal Ministry for the Environment.
- Glencore plc. (2025, March 31). Glencore’s Portovesme Critical Raw Materials Hub selected as Strategic Project by European Commission. Glencore.
- Ministry of Economy, Trade and Industry. (2025, January 22). Green Steel for GX. Government of Japan.
- Ministry of Mines. (2025, April 9). National Critical Mineral Mission: Powering India’s clean energy future. Press Information Bureau, Government of India.
- Ministry of Mines. (2025, November 25). Development of 3 lakh ton annual recycling capacity for critical mineral extraction envisaged from the incentive scheme. Press Information Bureau, Government of India.
- National Bureau of Statistics of China. (2025, February 28). Statistical communiqué of the People’s Republic of China on the 2024 national economic and social development. National Bureau of Statistics of China.
- New South Wales Government. (2025, May 11). Old mines given new lease of life under Critical Minerals and High-Tech Metals Strategy. NSW Government.
- Novelis Inc. (2025, September 24). Novelis releases 2025 sustainability report. Novelis.
- Stena Recycling. (2025, November 26). Stena Metall’s annual reports for 2024/2025 now available. Stena Recycling.
- TOMRA Mining. (2025, June 12). TOMRA Mining launches CONTAIN: Deep learning classification for inclusion-type ore sorting. TOMRA.
- TOMRA Mining. (2025, August 7). TOMRA Mining technology delivers transformative impact at the world’s largest lithium plant. TOMRA.
- U.S. Department of Energy. (2025, January 15). DOE invests over USD 32 million to increase efficiency of U.S. critical minerals production through the co-manufacture of value-added products. U.S. Department of Energy.
- U.S. Department of Energy. (2025, August 13). Funding notice: Mines & Metals Capacity Expansion – Piloting by-product critical minerals and materials recovery at domestic industrial facilities. U.S. Department of Energy.
- U.S. Geological Survey. (2026, January 20). National Mine Waste Inventory. U.S. Geological Survey.
- Umicore. (2026, February 20). Full year results 2025. Umicore.
- United Nations Environment Programme. (2024, March 1). Global Resources Outlook 2024. United Nations Environment Programme.
- Veolia. (2026). Management of wastewater and tailings from the mining industry. Veolia.
This Report Addresses
- The report provides strategic intelligence on the Circular Economy in Mining Market across key material recovery, waste valorization, and resource efficiency initiatives shaping the industry landscape.
- Segment analysis covers Tailings Reprocessing, Water Recycling, E-waste Metal Recovery, and Waste-to-resource routes as major focus areas supporting sustainable mining operations and material circularity.
- Regional outlook evaluates North America and Europe alongside Asia-Pacific. The comparison also covers Latin America and the Middle East & Africa across evolving mining sustainability frameworks.
- Competitive analysis profiles leading participants involved in mining waste management, metal recovery, recycling technologies, and circular resource solutions, highlighting their strategies, innovations, and market positioning.
- Solution assessment covers Tailings Reprocessing and Water Recycling alongside Metal Recovery, Waste-to-Resource Technologies, and other circular economy initiatives.
- Technology assessment covers Advanced Sorting Technologies and Hydrometallurgical Processes alongside Artificial Intelligence, Automation, and Digital Resource Management Systems.
- Application assessment covers Metal Mining and Mineral Processing alongside Mine Site Rehabilitation, Industrial Material Recovery, and Sustainable Resource Management applications.
- Market analysis evaluates key growth drivers, regulatory developments, sustainability targets, investment trends, and technological advancements influencing circular economy adoption across the mining sector.
- Opportunity assessment highlights emerging business models focused on resource optimization, secondary raw material production, emissions reduction, and long-term environmental stewardship within mining operations.
What does the Circular Economy in Mining Market cover?
Tailings Reprocessing and Water Recycling systems support mining circularity. E-waste Metal Recovery and Waste-to-resource routes extend recovery across secondary material streams.
The Circular Economy in Mining Market covers systems and services that recover value from mining residues and secondary material streams. Coverage includes Tailings Reprocessing plus Water Recycling and E-waste Metal Recovery. Waste-to-resource routes are included where recovered outputs enter mining or metal value chains. The analysis also covers Mineral and Mining Type structure alongside End Use demand.
The market differs from general waste management because value creation must connect to mine production, mineral processing or metal recovery. Municipal recycling and unrelated industrial waste services remain outside the boundary unless they process a defined mining or mineral-processing stream.
What is included in the scope?
Circular mining systems cover active mines and processing sites. Qualified secondary material streams are also included when recovery routes connect to metal production.
The scope includes metal recycling and secondary raw material processing, recovery of valuable metals from electronic waste, surface and underground mining operations, mineral separation and flotation processes, recycling equipment and sorting technologies, recycled metal supply chains, copper scrap recovery and recycling, process-water recycling and treatment, and the recovery of minerals and metals from secondary feedstocks and mining residues. These areas collectively influence resource efficiency, waste valorization, material recirculation, and sustainable mining practices across the circular economy value chain.
What is excluded from the scope?
Municipal recycling services and unrelated industrial waste treatment are outside the scope.
The scope excludes household waste collection and general scrap trading when no mining or mineral-processing feed stream is involved. Primary extraction equipment is excluded unless its commercial function within the project is waste rejection or material recovery.
How was the analysis built?
120+ sources, 40+ company portfolios, 25+ countries, 20+ interviews.
- Primary Research
- Primary research includes interviews with mining companies, mineral processing operators, sustainability managers and resource recovery specialists. It also includes input from recycling technology providers, equipment manufacturers, environmental consultants and mine redevelopment experts involved in circular economy initiatives across mining operations.
- Desk Research
- Desk research reviews mining industry statistics, sustainability reports, circular economy frameworks, tailings reprocessing developments, resource recovery technologies and company product portfolios. Government publications, industry association reports, environmental regulations and corporate announcements are also assessed to evaluate market trends and competitive positioning.
- Market-Sizing and Forecasting
- Forecasting uses mining production activity, secondary resource recovery rates, tailings valorization projects, recycling technology adoption and sustainability investment trends across major regions. Models consider waste reduction initiatives, metal recovery economics, regulatory support and closed-loop resource management strategies influencing market growth.
- Data Validation and Update Cycle
- Forecasts are validated through provider checks and industry interviews that test assumptions on resource recovery demand, technology adoption and sustainability spending. Portfolio mapping, regional mining activity assessment and stakeholder feedback help confirm market direction, while ongoing reviews of regulatory developments, project announcements and circular economy investments support forecast updates.
Segmentation
What is the report’s scope and coverage?
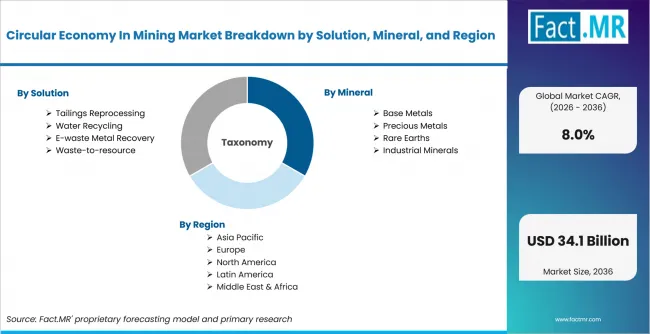
Circular Economy In Mining Market Breakdown By Solution, Mineral, And Region | Source: Fact.MR
| Attribute | Details |
|---|---|
| Quantitative Units | USD billion |
| Market Definition | Systems and services that recover value from mining residues or recycle water and secondary metal streams across mining and mineral processing operations |
| Solution | Tailings Reprocessing; Water Recycling; E-waste Metal Recovery; Waste-to-resource |
| Mineral | Base Metals; Precious Metals; Rare Earths; Industrial Minerals |
| Mining Type | Surface Mining; Underground Mining |
| End Use | Metal Producers; Mining Operators; Recycling Firms |
| Regions Covered | North America; Europe; Asia Pacific; Central and South America; Middle East and Africa |
| Countries Covered | India; China; Australia; United Kingdom; United States; Germany; Japan |
| Key Companies Profiled | Boliden AB; Glencore; Umicore; Veolia; Aurubis; Novelis (Hindalco); Stena Recycling |
| Forecast Period | 2026 to 2036 |
| Approach | Hybrid top-down and bottom-up approach using mine production activity; tailings and residue inventories; solution adoption; mineral recovery economics; mining type exposure; end-use demand; qualification timelines and supplier validation |
Source: Fact.MR analysis. Updated Jul 9, 2026
How is the market segmented?
-
By Solution
- Tailings Reprocessing
- Water Recycling
- E-waste Metal Recovery
- Waste-to-resource
-
By Mineral
- Base Metals
- Precious Metals
- Rare Earths
- Industrial Minerals
-
By Mining Type
- Surface Mining
- Underground Mining
-
By End Use
- Metal Producers
- Mining Operators
- Recycling Firms
-
By Region
- North America
- United States
- Canada
- Europe
- Germany
- United Kingdom
- France
- Italy
- Spain
- Asia Pacific
- India
- China
- Japan
- South Korea
- Australia
- Latin America
- Brazil
- Argentina
- Mexico
- Chile
- Middle East & Africa
- UAE
- Saudi Arabia
- South Africa
- North America
Frequently Asked Questions
How is surface mining positioned within the Circular Economy in Mining Market?
What contribution do Metal Producers make to the Circular Economy in Mining Market demand?
How significant is the Base Metals segment in the Circular Economy in Mining Market?
What role does Tailings Reprocessing play within the Circular Economy in Mining Market?
How is Boliden AB positioned in the competitive landscape?
Which country shows notable growth prospects in the Circular Economy in Mining Market?
How is the Circular Economy in Mining Market expected to develop in China?
What outlook is projected for Australia in the Circular Economy in Mining Market?
How is demand anticipated to progress in the United Kingdom?
What trend characterizes the United States Circular Economy in Mining Market?
How does Germany perform in the Circular Economy in Mining Market?
What is Japan’s growth outlook in the Circular Economy in Mining Market?
What factor primarily supports demand growth in the Circular Economy in Mining Market?
Which challenge continues to influence project development?
How does Tailings Reprocessing support value creation in the Circular Economy in Mining Market?
Why do Metal Producers remain influential purchasers in the Circular Economy in Mining Market?
Who worked on this report


Preview the report firsthand - request a free sample
Free SampleGet the brochure for pricing and purchase details
Download PDF