- Market Value (2025): USD 1.6 Bn
- Estimated Value (2026): USD 1.8 Bn
- Forecast Value (2036): USD 5.5 Bn
- CAGR (2026-2036): 12.1%
What is the Collectible Reusable Cups Market forecast to be worth by 2036?
USD 1.8 billion in 2026 to USD 5.5 billion by 2036 at a 12.1% CAGR.
- The Collectible Reusable Cups Market reached USD 1.6 billion in 2025.
- Demand is projected to increase from USD 1.8 billion in 2026 to USD 5.5 billion by 2036.
- The market is forecast to record a 12.1% CAGR from 2026 to 2036 as venue operators expand managed return systems and branded event programs.
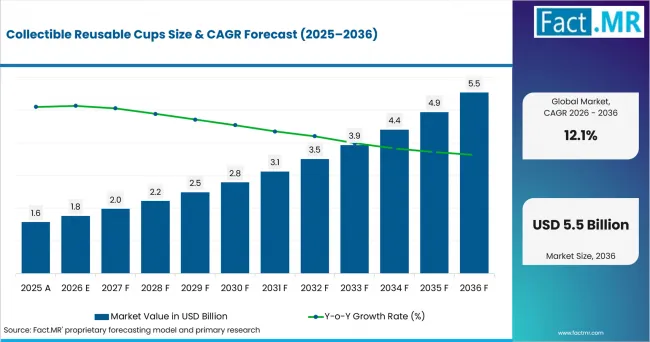
Collectible Reusable Cups Value Analysis | Source: Fact.MR
What are the defining numbers behind Collectible Reusable Cups Market growth?
An absolute opportunity of USD 3.8 billion is expected between 2026 and 2036.
- Demand Drivers in the Market
- Stadium vendors need cups that survive repeated use and keep their print quality. Collectible graphics also link reusable cups with merchandise and deposit-return programs.
- Festival organizers need cups that work with return points and central washing systems. Good collection design is therefore a key part of reusable cup programs.
- Foodservice operators need stackable cups that fit current storage and service routines. This makes handling easier at concession stands.
- Brand owners need decoration that stays legible after repeated use, while QR or RFID options connect sponsorship with asset tracking.
- Key Segments Analyzed
- By Cup Material: PCR polypropylene is expected to hold a 33.0% share in 2026. It offers the stiffness, washability, and print options needed for repeated venue use.
- By Use Model: Venue deposit-return is projected to account for 34.0% share in 2026 owing to a clear economic signal that encourages cups to move back into collection and washing loops.
- By Capacity: <300 mL is anticipated to capture 37.0% share in 2026. Compact servings suit controlled portions and high-throughput event service.
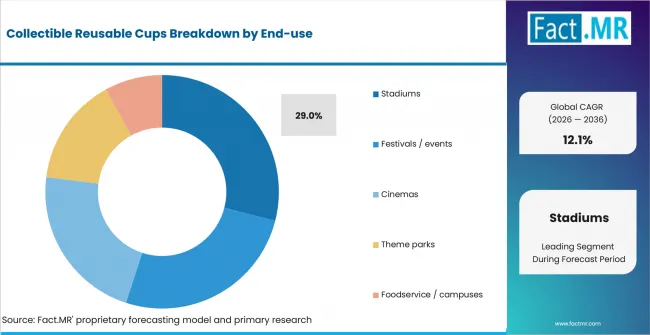
- By End-use: Stadiums are expected to hold a 29.0% share in 2026. Fixed concession areas and repeat events make cup returns, sponsor graphics, and collection easier to manage.
- Analyst Opinion at Fact.MR
- Shambhu Nath Jha, Principal Consultant at Fact.MR states, “Return discipline carries as much weight as cup durability. A reusable cup creates value only when the venue gets it back. Suppliers are expected to compete on durable decoration and traceability. Formats that fit washing systems while preserving service speed are expected to gain preference.”
- Strategic Implications
- Venue operators should set deposit values and return points before choosing the final cup design.
- Converters should validate print adhesion after repeated washing. Recycled plastic claims should match the resin grade and the documentation used for the finished cup.
- Event organizers should align cup size and artwork with the beverage menu. The same returnable packaging format can then serve several concessions with fewer cup variants.
- Wash-system partners should track loss and turnaround time so operators can compare replacement cost with reusable-pool performance.
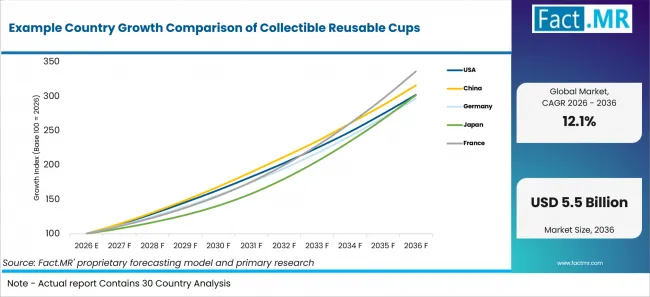
France is expected to post 12.9% CAGR through 2036 as reuse rules support venue systems. China is projected at 12.2% as catering and visitor volumes sustain beverage occasions. The USA and Japan are each anticipated at 11.7%, while Germany is forecast at 11.5% through established reuse practices.
How does the Collectible Reusable Cups Market break down by segment?
<300 mL leads Capacity at 37.0% share in 2026; Venue deposit-return leads Use Model at 34.0% share.
Which Cup Material dominates?
PCR polypropylene is expected to hold 33.0% share in 2026.
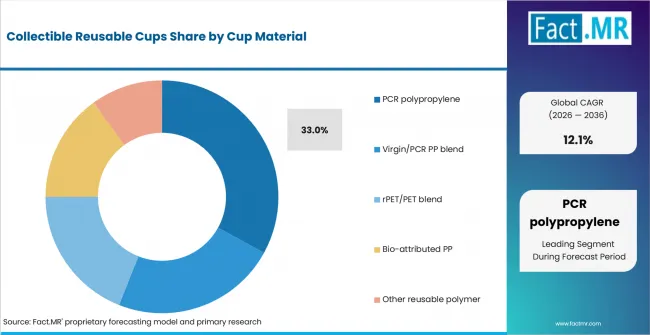
Collectible Reusable Cups Analysis By Cup Material | Source: Fact.MR
PCR polypropylene is expected to lead because venues need rigid cups for repeated use. Virgin and recycled PP blends help control color and production. rPET and PET blends offer clear cups. Bio-attributed PP suits programs that value feedstock claims. Other polymers serve more limited uses. Operators should compare wash durability, print quality, and stacking. These factors affect storage and service at busy venues.
What leads the Use Model segment?
Venue deposit-return is projected to account for 34.0% share in 2026.
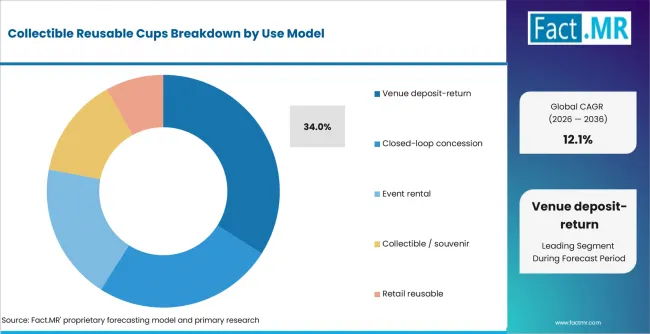
Collectible Reusable Cups Analysis By Use Model | Source: Fact.MR
Venue deposit-return is projected to lead because the operator can attach a financial signal to cup recovery. Closed-loop concessions keep assets within one venue. Event rental shifts cup ownership to a service partner. Collectible programs place more value on artwork and souvenir appeal. Retail reusable formats depend on consumers carrying the cup back into later use occasions. Foodservice reusable cup systems use the same circulation principle when return and washing are managed together. Operators are expected to compare return convenience with the replacement cost created by cups that leave the pool.
How does Capacity shape demand?
<300 mL is anticipated to lead with 37.0% share in 2026.
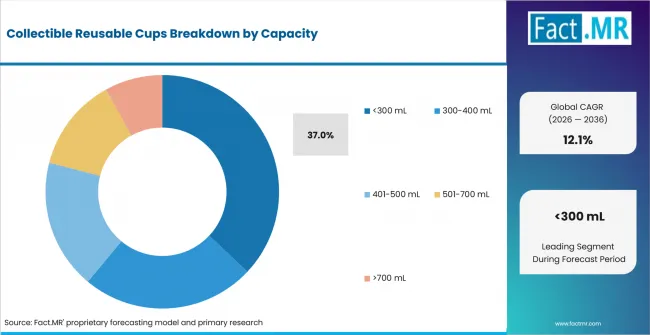
Collectible Reusable Cups Analysis By Capacity | Source: Fact.MR
The <300 mL band is anticipated to lead where serving speed and portion control take priority. The 300-400 mL band addresses common concession servings. The 401-500 mL band supports larger beverage portions at stadiums and festivals. The 501-700 mL range serves longer consumption occasions. Formats above 700 mL remain more specialized because they occupy more rack space. Capacity therefore affects washing throughput as well as the number of cups that can be stored near a service point. Venue teams are expected to balance beverage menu requirements against the space available for clean and used cup stacks.
What supports Stadiums within End-use?
Stadiums are estimated to represent 29.0% share in 2026.
Collectible Reusable Cups Analysis By End Use | Source: Fact.MR
Stadiums are estimated to lead because fixed entry points and recurring fixtures create repeatable collection routes. Festivals use similar deposits on temporary sites. Cinemas offer controlled circulation within a defined building. Theme parks combine repeat visits with multiple concession points. Campuses extend reuse into daily service. Stadium operators can place return stations near exits and keep washing schedules tied to event calendars. Sponsors can use collectible artwork as part of the cup design. The operating model therefore combines beverage service with asset recovery and brand visibility across a predictable venue footprint.
What is accelerating Collectible Reusable Cups Market adoption, and what is holding it back?
Venue return systems and reuse regulation support adoption; loss rates and washing logistics restrain it.
Drivers Impact Analysis
| DRIVER | (~) % IMPACT ON CAGR | GEOGRAPHIC RELEVANCE | IMPACT TIMELINE |
|---|---|---|---|
| Deposit-return systems | +2.0% | Europe, North America, East Asia | Short term (<= 2 years) |
| Single-use reduction rules | +1.6% | Europe, North America | Medium term (2-4 years) |
| Branded event merchandise | +1.2% | Global | Short term (<= 2 years) |
| Traceable cup pools | +0.9% | Europe, North America | Medium term (2-4 years) |
Opportunity Impact Analysis
| OPPORTUNITY | (~) % IMPACT ON CAGR | GEOGRAPHIC RELEVANCE | IMPACT TIMELINE |
|---|---|---|---|
| Shared city return networks | +1.1% | Europe | Medium term (2-4 years) |
| High-recycled-content PP cups | +0.8% | Europe, North America | Medium term (2-4 years) |
| Licensed collectible designs | +0.7% | Global | Short term (<= 2 years) |
Restraints Impact Analysis
| RESTRAINT | (~) % IMPACT ON CAGR | GEOGRAPHIC RELEVANCE | IMPACT TIMELINE |
|---|---|---|---|
| Cup loss and non-return | -0.7% | Global | Short term (<= 2 years) |
| Commercial washing capacity | -0.5% | Global | Medium term (2-4 years) |
| Hygiene and inspection burden | -0.4% | Global | Long term (>= 4 years) |
Which countries are scaling the Collectible Reusable Cups Market through 2036?
- The country comparison spans 1.4 percentage points across the forecast period.
- France is 0.7 percentage point above China. Reuse rules and busy visitor venues support managed cup systems.
- China is 0.5 percentage point above the USA. Growing catering activity creates more beverage use at events and attractions.
- The USA matches Japan at 11.7% CAGR as venue programs combine branded cups with controlled return points.
- Japan is 0.2 percentage point above Germany. Tourism and formal reuse trials support repeated cup use.
- Germany closes the displayed range through established reusable takeaway practices and high-volume tourism activity.
Similar CAGRs can still reflect different market conditions. Return systems and reuse rules vary by country. The report covers North America, Latin America, Western Europe, Eastern Europe, East Asia, South Asia & Pacific, and Middle East & Africa.
Example Country Growth Comparison Of Collectible Reusable Cups | Source: Fact.MR
| Country | CAGR (2026-2036) |
|---|---|
| France | 12.9% |
| China | 12.2% |
| United States | 11.7% |
| Japan | 11.7% |
| Germany | 11.5% |
What supports USA adoption?
11.7% CAGR, supported by high-volume leisure and venue beverage occasions.
In March 2026 the U.S. National Park Service reported 323,014,305 recreation visits during 2025. That visitor base creates repeated beverage-service occasions at attractions and recreation destinations. Stadium and event operators are expected to gain more value when collectible graphics are paired with simple return points and reliable washing capacity.
How is China scaling demand?
12.2% CAGR, led by catering activity and high-throughput service settings.
In January 2026 China’s National Bureau of Statistics reported 2025 catering revenue of RMB 5,798.2 billion. The value was 3.2% above 2024. Large catering volumes widen the addressable base for reusable beverage service. Venue operators are expected to favor standardized PP formats when collection and centralized washing can be managed across repeated events.
What supports France adoption?
12.9% CAGR, backed by reuse policy and tourism-linked foodservice activity.
In July 2026, INSEE reported that residents aged 15 or older in metropolitan France made 231.4 million trips during 2025, of which 195.9 million had France, including its overseas departments and territories, as the main destination. High travel activity supports beverage demand across attractions and events. Reusable cup programs are expected to fit venues that connect branded formats with clear return points and repeat service cycles.
How does Japan perform?
11.7% CAGR, shaped by tourism activity and controlled venue return systems.
In January 2026 the Japan National Tourism Organization reported 42,683,600 international arrivals during 2025. Arrivals were 15.8% above 2024. Visitor growth expands beverage occasions across attractions and entertainment districts. Operators are expected to benefit from clear return guidance and standardized cup formats that move efficiently through washing systems.
What is supporting Germany adoption?
11.5% CAGR, driven by tourism volume and established reusable-service practices.
In February 2026 Destatis reported 497.5 million guest overnight stays in Germany during 2025. Overnight stays were 0.3% above 2024. High accommodation activity supports foodservice volume across destination areas. Festival and sports venues are expected to favor durable cup formats that align with familiar deposit behavior and repeated washing routines.
Who leads the Collectible Reusable Cups Market?
In April 2025, Amcor completed its combination with Berry Global, creating a broader packaging portfolio that now includes Berry’s established reusable-cup capabilities. Berry has documented experience in returnable-cup programs, including the Borrow Cup initiative in Glasgow, where its reusable polypropylene cups were selected for a shared return system. Greiner Packaging also remains directly active in reusable event cups for concerts, festivals, sporting events, and other large-scale occasions.
Greiner Packaging offers reusable polypropylene event cups designed for repeated use. The company provides custom printing and in-mold labeling options, while integrated RFID chips, QR codes, and variable-data printing can support cup traceability. Greiner also states that its cups are dishwasher-safe and retain their appearance after multiple wash cycles.
Suppliers are expected to compete on cup strength, print quality, tracking, and wash performance. Berry documents standardized reusable-cup sizes, dishwasher-safe construction, and RFID-based tracking, while Greiner emphasizes stackability, washability, custom decoration, and optional RFID functionality. These capabilities provide operators with documented criteria for comparing reusable cup solutions across repeated-use programs.
Which companies are the key providers?
Key companies profiled include Amcor; Cup Concept; Greiner Packaging; InfinyCup; and Faerch.
- Amcor
- Cup Concept
- Greiner Packaging
- InfinyCup
- Faerch
Bibliography
- Amcor plc. (2025, April 30). Amcor completes combination with Berry Global; positioned to significantly enhance value for customers and shareholders.
- European Commission, Directorate-General for Environment. (2025, February 11). New rules enter into force for a more sustainable and competitive packaging economy.
- Statistisches Bundesamt (Destatis). (2026, February 11). Tourismus in Deutschland im Jahr 2025: Erneut Rekordwert bei Gästeübernachtungen [Tourism in Germany in 2025: Another record for overnight stays].
- Greiner Packaging. (2026, April 28). ESC 2026: Reusable cups made from 100% recycled material show Austrian circular economy in action.
- Insee. (2026, July 23). Voyages et nuitées selon la destination : données annuelles 2025 [Trips and overnight stays by destination: Annual data 2025].
- National Bureau of Statistics of China. (2026, January 20). Total retail sales of consumer goods in December 2025.
- National Park Service. (2026, March 13). Public interest in national parks remains strong as visits top 323 million in 2025.
This Report Answers
- The report explains how cup material and use model shape collectible reusable cup systems. It also covers capacity and end-use requirements across venue programs.
- Segment analysis identifies the share leaders across each parent category. It explains the operating reasons behind deposit-return systems and compact capacities. PCR polypropylene and stadium use are assessed within the 2026 segment framework.
- Country analysis examines the United States and China alongside Germany. Japan and France complete the country set. Official post-2024 evidence supports the tourism and foodservice context used in each outlook.
- Competitive analysis reviews the profiled companies across reusable-cup systems and related foodservice packaging activity.
- Application analysis assesses return behavior and washing capacity as operating criteria. Decoration durability and traceability are reviewed where they affect cup circulation across venue programs.
What does the Collectible Reusable Cups Market cover?
The Collectible Reusable Cups Market covers beverage cups designed for repeated service in venues and foodservice settings. The scope intersects foodservice packaging where cups circulate across repeated service cycles. Return and rental models are included. Souvenir and retail reuse models are included when repeated beverage use remains part of the proposition.
Material analysis covers PP and PET-based reusable formats within rigid plastic packaging and plastic container categories. End-use analysis connects the cup to foodservice packaging where concession speed and wash logistics affect system design.
What is included in the scope?
The scope includes reusable cups sold for venue deposit-return and concession models. Rental and souvenir programs are included when the cup is intended for repeated service. Sustainable packaging is relevant where the beverage cup is designed for multiple service cycles. PCR content is considered where supplier documentation supports the finished food-contact specification.
The assessment also considers policy-linked design pressures associated with eco-modulation optimized rigid plastic packaging and wider refillable packaging models. Decoration and washability are included where they affect repeated service. Stackability and deposit mechanics are assessed as operating requirements. Traceability is included where it supports cup-pool monitoring.
What is excluded from the scope?
Outside the scope are ordinary single-use beverage cups, conventional paper cups and household drinkware intended for personal use. Permanent ceramic or metal mugs and reusable food containers belong outside the boundary unless a beverage-cup circulation model is part of the application.
Recycling-only systems fall outside the market boundary when a cup is designed for a single service cycle before material recovery. The assessment centers on repeated-use cup programs, with end-of-life recycling treated as a supporting feature after the intended reuse phase.
How Was the Analysis Built?
The analysis draws on 120+ sources, 35+ company portfolios, 25+ countries, and more than 20 industry interviews.
- Primary Research: The study uses interviews with manufacturers, service providers, technology teams, distributors, end users, and industry experts. These talks cover buying needs, product use, operating issues, approvals, competition, and market adoption.
- Desk Research: The study reviews government data, rules, company filings, trade data, technical studies, industry groups, standards, and public policy. Every source used in the analysis appears in the bibliography.
- Market Sizing and Forecasting: Market estimates use past results, demand trends, prices, volumes, segment shares, company activity, country growth, adoption, investment, and barriers to growth.
- Data Validation and Update Cycle: The study compares interview findings with public data, company activity, rule changes, trade patterns, and industry trends. Updates track product launches, capacity changes, partnerships, approvals, and market use.
What is the report’s scope and coverage?
Collectible Reusable Cups Breakdown By Cup Material, Use Model, And Region | Source: Fact.MR
| Attribute | Details |
|---|---|
| Quantitative Units | USD billion in 2026 to USD billion by 2036 at a CAGR |
| Market Definition | Reusable beverage cups designed for repeated service and collectible or branded use in managed return, concession, rental, souvenir or retail reuse models. |
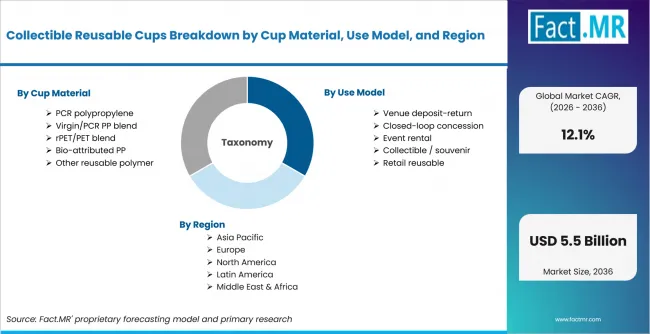
| Cup Material | PCR polypropylene; Virgin/PCR PP blend; rPET/PET blend; Bio-attributed PP; Other reusable polymer |
| Use Model | Venue deposit-return; Closed-loop concession; Event rental; Collectible / souvenir; Retail reusable |
| Capacity | <300 mL; 300-400 mL; 401-500 mL; 501-700 mL; >700 mL |
| End-use | Stadiums; Festivals / events; Cinemas; Theme parks; Foodservice / campuses |
| Regions Covered | North America; Latin America; Western Europe; Eastern Europe; East Asia; South Asia & Pacific; Middle East & Africa |
| Countries Covered | United States; China; Germany; Japan; France |
| Key Companies Profiled | Amcor; Cup Concept; Greiner Packaging; InfinyCup; Faerch |
| Forecast Period | 2026 to 2036 |
| Approach | Hybrid top-down and bottom-up approach using venue beverage demand, reusable cup circulation, return models, foodservice activity, material selection, country regulation and provider portfolio review. |
How is the market segmented?
-
By Cup Material
- PCR polypropylene
- Virgin/PCR PP blend
- rPET/PET blend
- Bio-attributed PP
- Other reusable polymer
-
By Use Model
- Venue deposit-return
- Closed-loop concession
- Event rental
- Collectible / souvenir
- Retail reusable
-
By Capacity
- <300 mL
- 300-400 mL
- 401-500 mL
- 501-700 mL
- >700 mL
-
By End-use
- Stadiums
- Festivals / events
- Cinemas
- Theme parks
- Foodservice / campuses
-
By Region
- North America
- Latin America
- Western Europe
- Eastern Europe
- East Asia
- South Asia & Pacific
- Middle East & Africa

