Copolymer Polyols Market

Copolymer Polyols Market Analysis, By Type, By Application, and Region - Market Insights 2025 to 2035

Analysis Of Copolymer Polyols Market Covering 30+ Countries Including Analysis Of US, Canada, UK, Germany, France, Nordics, GCC Countries, Japan, Korea And Many More

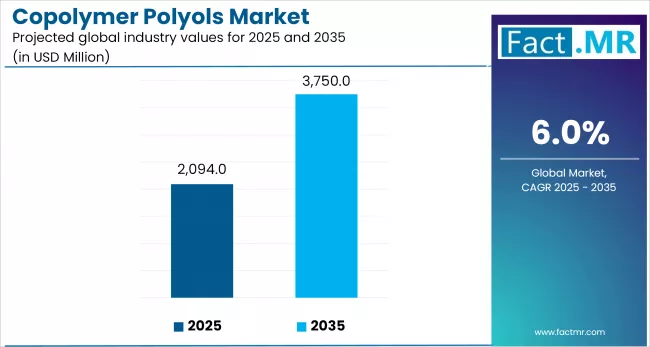
Copolymer Polyols Market Outlook (2025 to 2035)

The global copolymer polyols market is projected to increase from USD 2,094 million in 2025 to USD 3,751 million by 2035, with a CAGR of 6% during the forecast period. Growth is driven by the growing demand for energy-efficient products, especially in the construction and automotive industries.

With rising energy costs and growing environmental concerns, copolymer polyols are becoming increasingly important in the production of rigid polyurethane foams, enabling improved insulation and enhanced comfort. The emphasis on sustainable materials and processes is encouraging many manufacturers to incorporate copolymer polyol technology into their products.

Copolymer Polyols Market By Industry Value Analysis

Quick Facts about Copolymer Polyols Market

  • Industry Value (2025): USD 2,094 Million
  • Projected Value (2035): USD 3,750 Million
  • Forecast CAGR (2025 to 2035): 6.0%
  • Leading Segment (2025): Blended (55% Market Share)
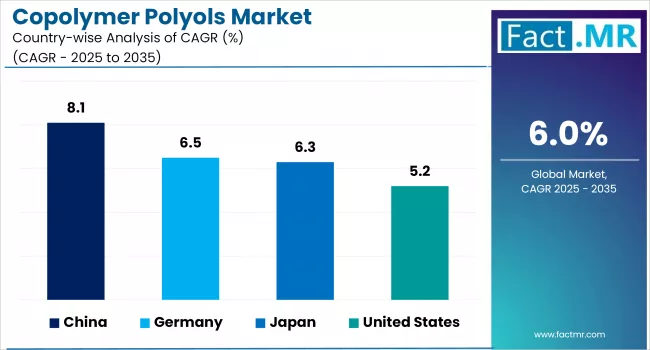
  • Country Growth Rate (2025 to 2035): China (8.1% CAGR)
  • Top Key Players: Dow, BASF SE (In Joint Venture with INEOS), Covestro AG, SABIC, and Royal Dutch Shell Plc.

What are the Drivers of Copolymer Polyols Market?

Car manufacturers require innovative, lightweight and durable interior materials. Copolymer polyols have great elasticity, resilient properties and structural integrity. The rise in production of vehicles, particularly in Asia Pacific, increases the demand for copolymer polyol foams. Because foam applications for comfort increase usage of these products, the demand grows tremendously.

Urbanization is growing rapidly across developing nations. Buildings use copolymer polyol polyurethane foams in insulation, flooring and roofing materials in the construction of energy-efficient buildings. New energy efficiency standards require the building of materials be better performing. Renovation and remodeling projects have also added to the developing urban economy.

Contemporary homes and apartments expect their furniture to look good, be comfortable and durable. Copolymer polyols help create soft, resilient, and durable foams used in sofas and couches, mattresses and chairs. Appliance insulation is another focus area. The pace of urbanization and increasing disposable income will keep the momentum for furniture and accommodation projects.

Tight restrictions on environmental controls will force industries to change material selection. Copolymer polyol carries lower VOC emissions and recyclability properties. Manufacturers will continue to use greener formulations. The environmental drive for green chemistry will encourage the development of new methods of producing polyols.

The rapid growth of e-commerce is fueling demand for packaging solutions that are both effective and lightweight. Polyurethane foams made with copolymer polyols address this need by offering excellent shock resistance, which helps protect goods during shipping and handling. Additionally, their adaptability allows these foams to be tailored for different types and sizes of packages, making them a versatile choice for the diverse requirements of modern e-commerce logistics.

What are the Regional Trends of Copolymer Polyols Market?

The Asia-Pacific region is the largest and fastest-growing market for copolymer polyols because of rapid industrialization, the growth of the construction market, and the increase in a middle-class population. China, India, and Southeast Asian countries, in particular, are experiencing much demand from the automotive, bedding, and appliance sectors.

While the North American market is generally mature, it is still a viable and evolving market for copolymer polyol suppliers because of new innovative technologies and continuing demand for lightweight, energy-efficient materials. Growth is enhanced through sustained, measurable, sustainable construction practices, increased fuel-efficient and lightweight vehicle redesign, and a decline in domestic manufacturing restrictions.

Europe is ahead of the game when it comes to sustainable manufacturing and green chemistry. Strict environmental regulations and a serious focus on circular economy principles are driving the use of copolymer polyols in construction, furniture and automotive applications. Demand is particularly robust in Germany, France and the Nordics, where high-performing foams are replacing traditional products.

Latin America and the Middle East & Africa are both seeing a gradual increase in copolymer polyol use. Infrastructure construction, urban development and more investment in commercial construction are driving demand. The overall market size remains small, but there is an upside to the promise of future growth, underlined by increasing imports of polyol-based products and interest in local manufacturing opportunities.

What are the Challenges and Restraining Factors of Copolymer Polyols Market?

The market is experiencing extreme volatility related to the prices of raw materials, specifically with the core inputs propylene oxide and ethylene oxide derived from crude oil. This extreme volatility creates uncertainty for manufacturers and end-users related to prices and production margins.

Manufacturers are also facing a rapidly expanding scope of environmental and regulatory compliance requirements related to isocyanates and petrochemical-based polyols. Manufacturers have to deal with global systems like REACH and regional VOC emissions regulations that communicate the need for new formulations, which isn't always done to lower R&D costs.

The limited supply of bio-based alternatives, especially the limited supply ratio in terms of scalability, is a limiting factor. There is an increasing demand for sustainable polyols. Still, most program funding for sustainable and bio-based polyols is expensive to produce and less efficient to manufacture than traditional copolymer polyols. This may delay transitioning to sustainable bio-based polyols at an industry scale.

There is a continuous seriousness about the technical limitations. For instance, producing a consistent foam density and performance across applications and between applications with varying biological properties. Such areas of the industry include medical, acoustic foams, and aerospace foams. One of the problems is that scaling innovation creates different costs that manufacturers cannot manage.

Country-Wise Outlook

Copolymer Polyols Market By Country

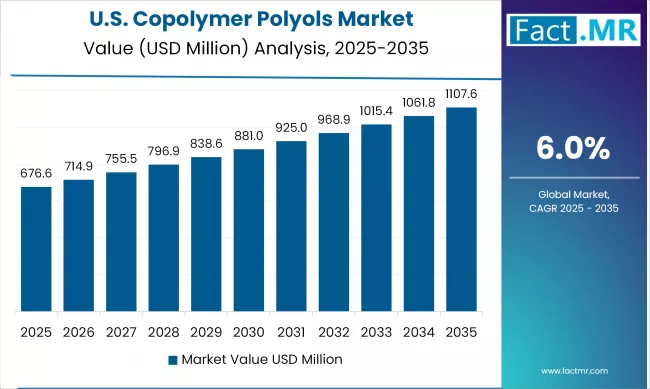
U.S. Copolymer Polyols Market sees Advancing Sustainability Through Innovation in Copolymer Polyols

The copolymer polyol market in the U.S. is undergoing a transformational change, driven by performance and sustainability. As construction and automotive manufacturers push for lightweight, durable, and energy-efficient materials, copolymer polyols have become essential in applications such as insulation, seat cushioning, and thermal barriers.

As manufacturing returns to U.S. soil, backed by federal policies and incentives like the Inflation Reduction Act, investments in polyurethane systems have taken off. With significant regulation around emitted VOCs and isocyanate handling, R&D is accelerating through bio-based and low-emission options.

Copolymer Polyols Market By Country Value Analysis

The burgeoning electric vehicle (EV) market has also opened opportunities for custom foam applications for battery insulation and vehicle interiors. The steady demand for high-resilience foams in bedding, furniture, and consumer appliances continues to develop a diverse end-user base.

There is also a strong trend toward integrated supply chains to ensure consistency of raw materials in light of global disruption. It's an attractive marketplace for those who can navigate agility, compliance, and discover the next science-driven material.

China witnesses Rapid Market Growth Backed by Industrial Ambition Meets Eco-Conscious Demand in Copolymer Polyols

The copolymer polyols market in China is currently growing rapidly, encouraged by rampant industrialization, a vital automotive industry, and an explosive construction environment. China is the world's largest consumer of polyurethane, and the country continues to capitalize on the domestic production aspect to produce materials locally and innovate new materials, increasing capacity to limit the volume of imports.

Government restrictions on the expectations of green building practices, emissions control, and other regulations are changing the standards of material. Manufacturers are exploring the capabilities of bio-based polyols as well as emissions variety within the polyol category for the development of lower-emission polyols that are less harmful to the environment. The dual carbon policy aims to achieve a carbon peak by 2030 and carbon neutrality by 2060, and this situation has put sustainability front and center of the entire industrial process.

Demand for lower-emission, eco-friendly polyurethane foams, which feature in insulation, kitchens, home appliances, and automotive interiors is increasing. A growing middle class in China and urbanization has been increasing demand for higher-performing beds and bedding products, and more enhanced quality furniture, which is allowing further consumption of co-polymer polyols in various applications.

There are currently a number of local players who are investing heavily in the R&D of specialty grades, including medical foams and low-density flexible foams. The players in the market who are leveraging their domestic raw material advantages and forging partnerships and relationships will be the winners.

Premium Efficiency and Eco Precision Drive Market Adoption of Japan

The copolymer polyols market in Japan is characterized by precision-engineered, environmentally conscious, and high-value markets. As a country with advanced industrial maturity and technology development, Japan has strong opportunities for copolymer polyols in markets such as automotive, consumer electronics, and high-performance construction.

Japan's commitment to sustainability, including its carbon-neutral ambitions, provides broad support among municipalities and consumers for low-VOC, bio-based materials. The automotive market is expanding its efforts in electric vehicles (EVs) and hybrid vehicles, which further opens new doors for weight-reducing polyurethane foams in interior, battery insulation and acoustic dampening applications.

The construction market is transitioning to more earthquake-resilient homes with complex energy-efficient buildings, resulting in increased demand for foam insulation with thermal and sound insulating capabilities from copolymer polyols.

Japan's ageing population and commitment to quality healthcare will open niche applications in health mattresses and hospital furnishings. The market is certainly positively oriented towards industry and academia, to encourage new ideas. Excellence not volume; precision, compliance, and innovation are elements necessary to create sustainable growth in a high-end market.

Category-wise Analysis

Blended Polyols to Exhibit Leading by Type

Copolymer Polyols Market  By Type

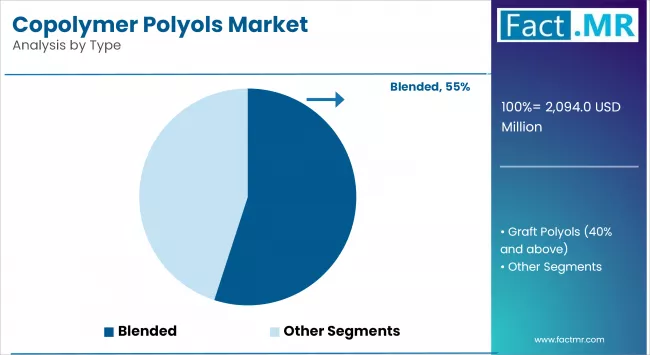
Blended copolymer polyols hold the largest revenue share in the copolymer polyols market, as these are the extensively used polyols in the world market and remain a favorable option that is used in many different industries, including automotive, furniture, construction and equipment manufacture. The ability of blended polyols to offer a reasonable balance of price, performance and processing easily helps to justify their position as the highest volume polyols used for making high-resilience flexible foams. They are very common as a polymeric material for many different applications such as seating, insulation, and carpet backing and therefore remain a material of choice for other manufacturers who are producing large volume applications.

Graft polyols with 40% or greater solid content is the fastest-growing segment due to rising demand for higher foam firmness and superior load-bearing properties. The increased solids content in these polyols enhances the mechanical strength and structural integrity of polyurethane foams, making them ideal for use in high-performance applications such as mattresses, automotive seating, and furniture..  The value added to the performance of the foam by using these high-solids polyols include greater mechanical strength, decreased foam shrinkage and improved durability, which are critical characteristics for a niche market that includes automotive seats, high-end mattresses, and orthopedic products.

Slabstock PU Foams to Exhibit Leading by Application

Copolymer Polyols Market  By Application

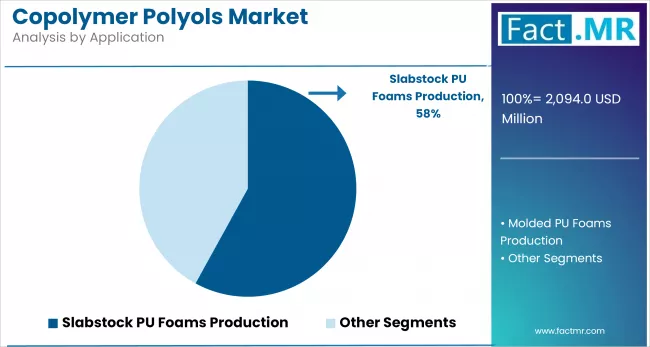
Slabstock PU foams dominates the copolymer polyols market, as slabstock is experiencing massive demand from the bedding, furniture, and carpet underlay markets. Copolymer polyols that are utilized in slabstock foam are highly resilient, have uniformity in density, and have desired softness properties, which allow for efficiently produced foam blocks for high demand applications. Cost-effectiveness mixed with flexibility in formulative options, makes them the material of choice among producers.

Molded PU foams are the fastest growing application segment, as demand for molded components that are ergonomically designed, and have precision from a foam manufacturing perspective has increased along with the automotive and medical sectors. Molded copolymer polyols provide for consistent moldings, dimensional stability, and have enhanced rebound characteristics, which makes them an ideal material for car seats, headrests, armrests, and medical cushions. As vehicles move towards lighter, more energy-efficient developments and consumers seek more individualized comfort solutions, molded PU foams are capitalizing on adoption.

Competitive Analysis

The copolymer polyols market is becoming increasingly competitive, with a mix of global chemical giants and specialized regional manufacturers. Key players differentiate through proprietary formulations, application-specific performance, and adherence to evolving environmental and safety regulations. Companies also leverage strategic collaborations with end-use industries to offer tailored solutions for flexible foams, coatings, adhesives, and sealants.

Players are developing their portfolios in modern times into bio-based polyols, low VOC formulations, and high solid graft polyols, in concert with regulation and green building mandates. Additionally, players have a differentiated yet specific range of foam properties associated with, but not limited to, rebound resiliency, density, and load strength coming into consideration relative to specific molded or higher-end applications.

The sector is experiencing an influx of R&D initiatives with partners mainly linked to academic institutions, and multi-tier arrangements with partners not necessarily in the polyurethane ecosystem, focused on circular polyurethane value chains. Additionally, digitalization of the supply chain, automation in formulation laboratories, and real-time process monitoring are new developments changing expectations for efficiency.

Key players in the copolymer polyols industry are Dow, BASF SE (In Joint Venture with INEOS), Covestro AG, SABIC, Royal Dutch Shell Plc., Oltchim SA, AGX Chemicals, KPX Chemicals, and other players.

Recent Development

  • In April 2024, Econic Technologies, a deep tech company specializing in renewable carbon solutions, announced a collaboration with Sanyo Chemical, a leading Japanese chemical company. They signed a memorandum of understanding (MOU) to evaluate Econic’s technology for producing CO₂-based polyols for sustainable, high-performance polyurethanes.
  • In May 2023, Mitsui Chemicals, Inc. and Sanyo Chemical Industries, Ltd., two prominent Japanese chemical companies, established a 50-50 Limited Liability Partnership (LLP) named Japan Polyol Limited Liability Partnership. This partnership aimed to address common issues in the production of polypropylene glycols (PPGs), including improving productivity and securing the future supply stability of PPGs in Japan. The LLP's business activities encompass.

Segmentation of Copolymer Polyols Market

  • By Type :

    • Blended
      • 10%
      • 15%
      • 20%
      • 25%
      • 30%-40%
    • Graft Polyols (40% and above)
  • By Application :

    • Slabstock PU Foams Production
      • Furniture & Bedding Foams
      • Carpet Underlaying
      • Packaging Foams
    • Molded PU Foams Production
      • Automotive Seating
      • Energy-absorbing padding
  • By Region :

    • North America
    • Latin America
    • Western Europe
    • Eastern Europe
    • East Asia
    • South Asia & Pacific
    • Middle East & Africa

Table of Content

  1. Executive Summary
    • Global Market Outlook
    • Demand-side Trends
    • Supply-side Trends
    • Technology Roadmap Analysis
    • Analysis and Recommendations
  2. Market Overview
    • Market Coverage / Taxonomy
    • Market Definition / Scope / Limitations
  3. Market Background
    • Market Dynamics
      • Drivers
      • Restraints
      • Opportunity
      • Trends
    • Scenario Forecast
      • Demand in Optimistic Scenario
      • Demand in Likely Scenario
      • Demand in Conservative Scenario
    • Opportunity Map Analysis
    • Product Life Cycle Analysis
    • Supply Chain Analysis
      • Supply Side Participants and their Roles
        • Producers
        • Mid-Level Participants (Traders/ Agents/ Brokers)
        • Wholesalers and Distributors
      • Value Added and Value Created at Node in the Supply Chain
      • List of Raw Material Suppliers
      • List of Existing and Potential Buyers
    • Investment Feasibility Matrix
    • Value Chain Analysis
      • Profit Margin Analysis
      • Wholesalers and Distributors
      • Retailers
    • PESTLE and Porter’s Analysis
    • Regulatory Landscape
      • By Key Regions
      • By Key Countries
    • Production and Consumption Statistics
    • Import and Export Statistics
  4. Global Construction Aggregate Market Analysis 2020-2024 and Forecast, 2025-2035
    • Historical Market Size Value (USD Mn) & Volume (Tons) Analysis, 2020-2024
    • Current and Future Market Size Value (USD Mn) & Volume (Tons) Projections, 2025-2035
      • Y-o-Y Growth Trend Analysis
      • Absolute $ Opportunity Analysis
  5. Global Construction Aggregate Market Pricing Analysis 2020-2024 and Forecast 2025-2035
  6. Global Construction Aggregate Market Analysis 2020-2024 and Forecast 2025-2035, By Type
    • Introduction / Key Findings
    • Historical Market Size Value (USD Mn) & Volume (Tons) Analysis By Type, 2020-2024
    • Current and Future Market Size Value (USD Mn) & Volume (Tons) Analysis and Forecast By Type, 2025-2035
      • Blended
      • Graft Polyols (40% and above)
    • Y-o-Y Growth Trend Analysis By Type, 2020-2024
    • Absolute $ Opportunity Analysis By Type, 2025-2035
  7. Global Construction Aggregate Market Analysis 2020-2024 and Forecast 2025-2035, By Application
    • Introduction / Key Findings
    • Historical Market Size Value (USD Mn) & Volume (Tons) Analysis By Application, 2020-2024
    • Current and Future Market Size Value (USD Mn) & Volume (Tons) Analysis and Forecast By Application, 2025-2035
      • Slabstock PU Foams Production
      • Molded PU Foams Production
    • Y-o-Y Growth Trend Analysis By Application, 2020-2024
    • Absolute $ Opportunity Analysis By Application, 2025-2035
  8. Global Construction Aggregate Market Analysis 2020-2024 and Forecast 2025-2035, By Region
    • Introduction
    • Historical Market Size Value (USD Mn) & Volume (Tons) Analysis By Region, 2020-2024
    • Current Market Size Value (USD Mn) & Volume (Tons) Analysis and Forecast By Region, 2025-2035
      • North America
      • Latin America
      • Western Europe
      • East Asia
      • South Asia Pacific
      • Eastern Europe
      • Middle East & Africa
    • Market Attractiveness Analysis By Region
  9. North America Construction Aggregate Market Analysis 2020-2024 and Forecast 2025-2035, By Country
    • Historical Market Size Value (USD Mn) & Volume (Tons) Trend Analysis By Market Taxonomy, 2020-2024
    • Market Size Value (USD Mn) & Volume (Tons) Forecast By Market Taxonomy, 2025-2035
      • By Country
        • U.S.
        • Canada
        • Mexico
      • By Type
      • By Application
    • Market Attractiveness Analysis
      • By Country
      • By Type
      • By Application
    • Key Takeaways
  10. Latin America Construction Aggregate Market Analysis 2020-2024 and Forecast 2025-2035, By Country
    • Historical Market Size Value (USD Mn) & Volume (Tons) Trend Analysis By Market Taxonomy, 2020-2024
    • Market Size Value (USD Mn) & Volume (Tons) Forecast By Market Taxonomy, 2025-2035
      • By Country
        • Brazil
        • Chile
        • Rest of Latin America
      • By Type
      • By Application
    • Market Attractiveness Analysis
      • By Country
      • By Type
      • By Application
    • Key Takeaways
  11. Western Europe Construction Aggregate Market Analysis 2020-2024 and Forecast 2025-2035, By Country
    • Historical Market Size Value (USD Mn) & Volume (Tons) Trend Analysis By Market Taxonomy, 2020-2024
    • Market Size Value (USD Mn) & Volume (Tons) Forecast By Market Taxonomy, 2025-2035
      • By Country
        • Germany
        • Italy
        • France
        • U.K.
        • Spain
        • Russia
        • BENELUX
        • Rest of Europe
      • By Type
      • By Application
    • Market Attractiveness Analysis
      • By Country
      • By Type
      • By Application
    • Key Takeaways
  12. East Asia Construction Aggregate Market Analysis 2020-2024 and Forecast 2025-2035, By Country
    • Historical Market Size Value (USD Mn) & Volume (Tons) Trend Analysis By Market Taxonomy, 2020-2024
    • Market Size Value (USD Mn) & Volume (Tons) Forecast By Market Taxonomy, 2025-2035
      • By Country
        • China
        • Japan
        • South Korea
      • By Type
      • By Application
    • Market Attractiveness Analysis
      • By Country
      • By Type
      • By Application
    • Key Takeaways
  13. South Asia Pacific Construction Aggregate Market Analysis 2020-2024 and Forecast 2025-2035, By Country
    • Historical Market Size Value (USD Mn) & Volume (Tons) Trend Analysis By Market Taxonomy, 2020-2024
    • Market Size Value (USD Mn) & Volume (Tons) Forecast By Market Taxonomy, 2025-2035
      • By Country
        • India
        • ASEAN Countries
        • Australia & New Zealand
        • Rest of South Asia Pacific
      • By Type
      • By Application
    • Market Attractiveness Analysis
      • By Country
      • By Type
      • By Application
    • Key Takeaways
  14. Eastern Europe Construction Aggregate Market Analysis 2020-2024 and Forecast 2025-2035, By Country
    • Historical Market Size Value (USD Mn) & Volume (Tons) Trend Analysis By Market Taxonomy, 2020-2024
    • Market Size Value (USD Mn) & Volume (Tons) Forecast By Market Taxonomy, 2025-2035
      • By Country
        • Russia
        • Poland
        • Hungary
        • Balkan & Baltics
        • Rest of Eastern Europe
      • By Type
      • By Application
    • Market Attractiveness Analysis
      • By Country
      • By Type
      • By Application
    • Key Takeaways
  15. Middle East & Africa Construction Aggregate Market Analysis 2020-2024 and Forecast 2025-2035, By Country
    • Historical Market Size Value (USD Mn) & Volume (Tons) Trend Analysis By Market Taxonomy, 2020-2024
    • Market Size Value (USD Mn) & Volume (Tons) Forecast By Market Taxonomy, 2025-2035
      • By Country
        • KSA
        • Other GCC Countries
        • Turkiye
        • South Africa
        • Rest of MEA
      • By Type
      • By Application
    • Market Attractiveness Analysis
      • By Country
      • By Type
      • By Application
    • Key Takeaways
  16. Key Countries Construction Aggregate Market Analysis
    • U.S.
      • Pricing Analysis
      • Market Share Analysis, 2024
        • By Type
        • By Application
    • Germany
      • Pricing Analysis
      • Market Share Analysis, 2024
        • By Type
        • By Application
    • China
      • Pricing Analysis
      • Market Share Analysis, 2024
        • By Type
        • By Application
    • South Korea
      • Pricing Analysis
      • Market Share Analysis, 2024
        • By Type
        • By Application
    • India
      • Pricing Analysis
      • Market Share Analysis, 2024
        • By Type
        • By Application
  17. Market Structure Analysis
    • Competition Dashboard
    • Competition Benchmarking
    • Market Share Analysis of Top Players
      • By Regional
      • By Type
      • By Application
  18. Competition Analysis
    • Competition Deep Dive
      • Dow
        • Overview
        • Product Portfolio
        • Profitability by Market Segments (Product/Age /Sales Channel/Region)
        • Sales Footprint
        • Strategy Overview
          • Marketing Strategy
          • Product Strategy
          • Channel Strategy
      • BASF SE (In Joint Venture with INEOS)
        • Overview
        • Product Portfolio
        • Profitability by Market Segments (Product/Age /Sales Channel/Region)
        • Sales Footprint
        • Strategy Overview
          • Marketing Strategy
          • Product Strategy
          • Channel Strategy
      • Covestro AG
        • Overview
        • Product Portfolio
        • Profitability by Market Segments (Product/Age /Sales Channel/Region)
        • Sales Footprint
        • Strategy Overview
          • Marketing Strategy
          • Product Strategy
          • Channel Strategy
      • SABIC
        • Overview
        • Product Portfolio
        • Profitability by Market Segments (Product/Age /Sales Channel/Region)
        • Sales Footprint
        • Strategy Overview
          • Marketing Strategy
          • Product Strategy
          • Channel Strategy
      • Royal Dutch Shell Plc.
        • Overview
        • Product Portfolio
        • Profitability by Market Segments (Product/Age /Sales Channel/Region)
        • Sales Footprint
        • Strategy Overview
          • Marketing Strategy
          • Product Strategy
          • Channel Strategy
      • Oltchim SA
        • Overview
        • Product Portfolio
        • Profitability by Market Segments (Product/Age /Sales Channel/Region)
        • Sales Footprint
        • Strategy Overview
          • Marketing Strategy
          • Product Strategy
          • Channel Strategy
      • AGX Chemicals
        • Overview
        • Product Portfolio
        • Profitability by Market Segments (Product/Age /Sales Channel/Region)
        • Sales Footprint
        • Strategy Overview
          • Marketing Strategy
          • Product Strategy
          • Channel Strategy
      • KPX Chemicals
        • Overview
        • Product Portfolio
        • Profitability by Market Segments (Product/Age /Sales Channel/Region)
        • Sales Footprint
        • Strategy Overview
          • Marketing Strategy
          • Product Strategy
          • Channel Strategy
  19. Assumptions & Acronyms Used
  20. Research Methodology

List Of Table

  • Table 1: Global Market Value (USD Mn) Forecast by Region, 2020 to 2035
  • Table 2: Global Market Volume (Tons) Forecast by Region, 2020 to 2035
  • Table 3: Global Market Value (USD Mn) Forecast by Type, 2020 to 2035
  • Table 4: Global Market Volume (Tons) Forecast by Type, 2020 to 2035
  • Table 5: Global Market Value (USD Mn) Forecast by Application, 2020 to 2035
  • Table 6: Global Market Volume (Tons) Forecast by Application, 2020 to 2035
  • Table 7: North America Market Value (USD Mn) Forecast by Country, 2020 to 2035
  • Table 8: North America Market Volume (Tons) Forecast by Country, 2020 to 2035
  • Table 9: North America Market Value (USD Mn) Forecast by Type, 2020 to 2035
  • Table 10: North America Market Volume (Tons) Forecast by Type, 2020 to 2035
  • Table 11: North America Market Value (USD Mn) Forecast by Application, 2020 to 2035
  • Table 12: North America Market Volume (Tons) Forecast by Application, 2020 to 2035
  • Table 13: Latin America Market Value (USD Mn) Forecast by Country, 2020 to 2035
  • Table 14: Latin America Market Volume (Tons) Forecast by Country, 2020 to 2035
  • Table 15: Latin America Market Value (USD Mn) Forecast by Type, 2020 to 2035
  • Table 16: Latin America Market Volume (Tons) Forecast by Type, 2020 to 2035
  • Table 17: Latin America Market Value (USD Mn) Forecast by Application, 2020 to 2035
  • Table 18: Latin America Market Volume (Tons) Forecast by Application, 2020 to 2035
  • Table 19: Western Europe Market Value (USD Mn) Forecast by Country, 2020 to 2035
  • Table 20: Western Europe Market Volume (Tons) Forecast by Country, 2020 to 2035
  • Table 21: Western Europe Market Value (USD Mn) Forecast by Type, 2020 to 2035
  • Table 22: Western Europe Market Volume (Tons) Forecast by Type, 2020 to 2035
  • Table 23: Western Europe Market Value (USD Mn) Forecast by Application, 2020 to 2035
  • Table 24: Western Europe Market Volume (Tons) Forecast by Application, 2020 to 2035
  • Table 25: East Asia Market Value (USD Mn) Forecast by Country, 2020 to 2035
  • Table 26: East Asia Market Volume (Tons) Forecast by Country, 2020 to 2035
  • Table 27: East Asia Market Value (USD Mn) Forecast by Type, 2020 to 2035
  • Table 28: East Asia Market Volume (Tons) Forecast by Type, 2020 to 2035
  • Table 29: East Asia Market Value (USD Mn) Forecast by Application, 2020 to 2035
  • Table 30: East Asia Market Volume (Tons) Forecast by Application, 2020 to 2035
  • Table 31: South Asia Pacific Market Value (USD Mn) Forecast by Country, 2020 to 2035
  • Table 32: South Asia Pacific Market Volume (Tons) Forecast by Country, 2020 to 2035
  • Table 33: South Asia Pacific Market Value (USD Mn) Forecast by Type, 2020 to 2035
  • Table 34: South Asia Pacific Market Volume (Tons) Forecast by Type, 2020 to 2035
  • Table 35: South Asia Pacific Market Value (USD Mn) Forecast by Application, 2020 to 2035
  • Table 36: South Asia Pacific Market Volume (Tons) Forecast by Application, 2020 to 2035
  • Table 37: Eastern Europe Market Value (USD Mn) Forecast by Country, 2020 to 2035
  • Table 38: Eastern Europe Market Volume (Tons) Forecast by Country, 2020 to 2035
  • Table 39: Eastern Europe Market Value (USD Mn) Forecast by Type, 2020 to 2035
  • Table 40: Eastern Europe Market Volume (Tons) Forecast by Type, 2020 to 2035
  • Table 41: Eastern Europe Market Value (USD Mn) Forecast by Application, 2020 to 2035
  • Table 42: Eastern Europe Market Volume (Tons) Forecast by Application, 2020 to 2035
  • Table 43: Middle East & Africa Market Value (USD Mn) Forecast by Country, 2020 to 2035
  • Table 44: Middle East & Africa Market Volume (Tons) Forecast by Country, 2020 to 2035
  • Table 45: Middle East & Africa Market Value (USD Mn) Forecast by Type, 2020 to 2035
  • Table 46: Middle East & Africa Market Volume (Tons) Forecast by Type, 2020 to 2035
  • Table 47: Middle East & Africa Market Value (USD Mn) Forecast by Application, 2020 to 2035
  • Table 48: Middle East & Africa Market Volume (Tons) Forecast by Application, 2020 to 2035

List Of Figures

  • Figure 1: Global Market Volume (Tons) Forecast 2020 to 2035
  • Figure 2: Global Market Pricing Analysis
  • Figure 3: Global Market Value (USD Mn) Forecast 2020 to 2035
  • Figure 4: Global Market Value Share and BPS Analysis by Type, 2025 and 2035
  • Figure 5: Global Market Y-o-Y Growth Comparison by Type, 2025 to 2035
  • Figure 6: Global Market Attractiveness Analysis by Type
  • Figure 7: Global Market Value Share and BPS Analysis by Application, 2025 and 2035
  • Figure 8: Global Market Y-o-Y Growth Comparison by Application, 2025 to 2035
  • Figure 9: Global Market Attractiveness Analysis by Application
  • Figure 10: Global Market Value (USD Mn) Share and BPS Analysis by Region, 2025 and 2035
  • Figure 11: Global Market Y-o-Y Growth Comparison by Region, 2025 to 2035
  • Figure 12: Global Market Attractiveness Analysis by Region
  • Figure 13: North America Market Incremental $ Opportunity, 2025 to 2035
  • Figure 14: Latin America Market Incremental $ Opportunity, 2025 to 2035
  • Figure 15: Western Europe Market Incremental $ Opportunity, 2025 to 2035
  • Figure 16: East Asia Market Incremental $ Opportunity, 2025 to 2035
  • Figure 17: South Asia Pacific Market Incremental $ Opportunity, 2025 to 2035
  • Figure 18: Eastern Europe Market Incremental $ Opportunity, 2025 to 2035
  • Figure 19: Middle East & Africa Market Incremental $ Opportunity, 2025 to 2035
  • Figure 20: North America Market Value Share and BPS Analysis by Country, 2025 and 2035
  • Figure 21: North America Market Value Share and BPS Analysis by Type, 2025 and 2035
  • Figure 22: North America Market Y-o-Y Growth Comparison by Type, 2025 to 2035
  • Figure 23: North America Market Attractiveness Analysis by Type
  • Figure 24: North America Market Value Share and BPS Analysis by Application, 2025 and 2035
  • Figure 25: North America Market Y-o-Y Growth Comparison by Application, 2025 to 2035
  • Figure 26: North America Market Attractiveness Analysis by Application
  • Figure 27: Latin America Market Value Share and BPS Analysis by Country, 2025 and 2035
  • Figure 28: Latin America Market Value Share and BPS Analysis by Type, 2025 and 2035
  • Figure 29: Latin America Market Y-o-Y Growth Comparison by Type, 2025 to 2035
  • Figure 30: Latin America Market Attractiveness Analysis by Type
  • Figure 31: Latin America Market Value Share and BPS Analysis by Application, 2025 and 2035
  • Figure 32: Latin America Market Y-o-Y Growth Comparison by Application, 2025 to 2035
  • Figure 33: Latin America Market Attractiveness Analysis by Application
  • Figure 34: Western Europe Market Value Share and BPS Analysis by Country, 2025 and 2035
  • Figure 35: Western Europe Market Value Share and BPS Analysis by Type, 2025 and 2035
  • Figure 36: Western Europe Market Y-o-Y Growth Comparison by Type, 2025 to 2035
  • Figure 37: Western Europe Market Attractiveness Analysis by Type
  • Figure 38: Western Europe Market Value Share and BPS Analysis by Application, 2025 and 2035
  • Figure 39: Western Europe Market Y-o-Y Growth Comparison by Application, 2025 to 2035
  • Figure 40: Western Europe Market Attractiveness Analysis by Application
  • Figure 41: East Asia Market Value Share and BPS Analysis by Country, 2025 and 2035
  • Figure 42: East Asia Market Value Share and BPS Analysis by Type, 2025 and 2035
  • Figure 43: East Asia Market Y-o-Y Growth Comparison by Type, 2025 to 2035
  • Figure 44: East Asia Market Attractiveness Analysis by Type
  • Figure 45: East Asia Market Value Share and BPS Analysis by Application, 2025 and 2035
  • Figure 46: East Asia Market Y-o-Y Growth Comparison by Application, 2025 to 2035
  • Figure 47: East Asia Market Attractiveness Analysis by Application
  • Figure 48: South Asia Pacific Market Value Share and BPS Analysis by Country, 2025 and 2035
  • Figure 49: South Asia Pacific Market Value Share and BPS Analysis by Type, 2025 and 2035
  • Figure 50: South Asia Pacific Market Y-o-Y Growth Comparison by Type, 2025 to 2035
  • Figure 51: South Asia Pacific Market Attractiveness Analysis by Type
  • Figure 52: South Asia Pacific Market Value Share and BPS Analysis by Application, 2025 and 2035
  • Figure 53: South Asia Pacific Market Y-o-Y Growth Comparison by Application, 2025 to 2035
  • Figure 54: South Asia Pacific Market Attractiveness Analysis by Application
  • Figure 55: Eastern Europe Market Value Share and BPS Analysis by Country, 2025 and 2035
  • Figure 56: Eastern Europe Market Value Share and BPS Analysis by Type, 2025 and 2035
  • Figure 57: Eastern Europe Market Y-o-Y Growth Comparison by Type, 2025 to 2035
  • Figure 58: Eastern Europe Market Attractiveness Analysis by Type
  • Figure 59: Eastern Europe Market Value Share and BPS Analysis by Application, 2025 and 2035
  • Figure 60: Eastern Europe Market Y-o-Y Growth Comparison by Application, 2025 to 2035
  • Figure 61: Eastern Europe Market Attractiveness Analysis by Application
  • Figure 62: Middle East & Africa Market Value Share and BPS Analysis by Country, 2025 and 2035
  • Figure 63: Middle East & Africa Market Value Share and BPS Analysis by Type, 2025 and 2035
  • Figure 64: Middle East & Africa Market Y-o-Y Growth Comparison by Type, 2025 to 2035
  • Figure 65: Middle East & Africa Market Attractiveness Analysis by Type
  • Figure 66: Middle East & Africa Market Value Share and BPS Analysis by Application, 2025 and 2035
  • Figure 67: Middle East & Africa Market Y-o-Y Growth Comparison by Application, 2025 to 2035
  • Figure 68: Middle East & Africa Market Attractiveness Analysis by Application
  • Figure 69: Global Market - Tier Structure Analysis
  • Figure 70: Global Market - Company Share Analysis

- FAQs -

What is the Global Copolymer Polyols Market size in 2025?

The copolymer polyols market is valued at USD 2,094 million in 2025.

Who are the Major Players Operating in the Copolymer Polyols Market?

Prominent players in the market include Dow, BASF SE (In Joint Venture with INEOS), Covestro AG, SABIC, Royal Dutch Shell Plc., Oltchim SA, AGX Chemicals, KPX Chemicals.

What is the Estimated Valuation of the Copolymer Polyols Market by 2035?

The market is expected to reach a valuation of USD 3,751 million by 2035.

What Value CAGR Did the Copolymer Polyols Market Exhibit over the Last Five Years?

The historic growth rate of the copolymer polyols market is 5.4% from 2020-2024.

Copolymer Polyols Market

Schedule a Call