- Market Value (2025): USD 1.5 Bn
- Estimated Value (2026): USD 1.8 Bn
- Forecast Value (2036): USD 10.5 Bn
- CAGR (2026-2036): 19.0%
What is the Dynamic Pricing Engines Market forecast to be worth by 2036?
USD 1.8 billion in 2026 to USD 10.5 billion by 2036 at a 19.0% CAGR.
- The dynamic pricing engines market crossed a valuation of USD 1.5 billion in 2025.
- Demand is projected to increase from USD 1.8 billion in 2026 to USD 10.5 billion by 2036.
- The market is forecast to record 19.0% CAGR from 2026 to 2036 as pricing teams use cloud engines to adjust prices across commerce, travel and subscription channels.
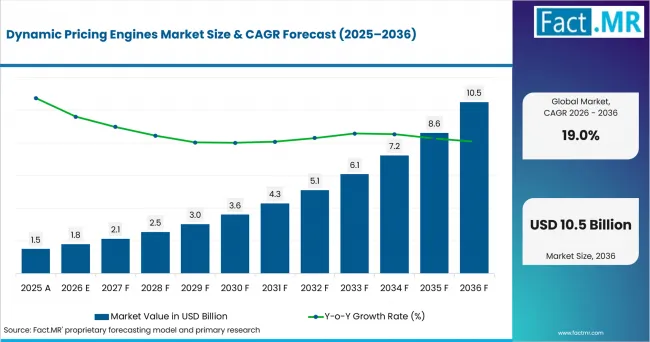
Dynamic Pricing Engines Market Value Analysis | Source: Fact.MR
What are the defining numbers behind Dynamic Pricing Engines Market growth?
USD 8.6 billion absolute opportunity by 2036, led by software platforms, cloud deployment and enterprise commerce teams.
- Demand Drivers in the Market
- Retail pricing teams need automated guardrails because online baskets change quickly and manual reviews cannot keep pace with SKU-level price moves.
- Airline revenue teams need request-specific pricing supported by trip context, seat demand and ancillary offer data.
- B2B commerce managers need quote guidance owing to frequent cost changes and contract-specific customer terms.
- Finance leaders need forecast visibility so pricing changes show their likely effect on margin before a new price is approved.
- Key Segments Analyzed
- By Offering: Software platform is projected to hold 44.0% share in 2026 because enterprise accounts need a central workbench for rules, models and approvals.
- By Deployment: Cloud is anticipated to account for 53.0% share in 2026 owing to faster model updates and easier rollout across stores, marketplaces and booking channels.
- By Capability: Forecasting is estimated to capture 42.0% share in 2026 due to its role in testing demand response before price execution.
- By Customer Group: Large enterprise is forecast to represent 46.0% share in 2026 supported by larger SKU bases and dedicated pricing operations teams.
- Analyst Opinion at Fact.MR
- Shambhu Nath Jha, Principal Consultant at Fact.MR, states, “Dynamic pricing engines are becoming operational systems, not side tools for analysts. Adoption is expected to widen where teams need explainable price changes, approval controls and measurable margin impact. Providers should combine forecasting, governance and clean execution links into commerce systems.”
- Strategic Implications
- Retail vendors should show how their engines prevent margin leakage when competitors change prices during a selling day.
- Travel platforms should connect pricing, offer creation and ancillary rules so revenue teams manage the full booking value.
- B2B software providers should support contract terms and exception approvals since customer-specific pricing remains central to industrial sales.
- Compliance teams should document price-change logic because regulators are asking how dynamic prices are explained to customers.
South Korea is projected to post 19.3% CAGR through 2036 supported by mobile commerce depth. The UK is estimated to record 17.1% CAGR owing to online retail penetration. Japan is anticipated to advance at 15.9% CAGR driven by e-commerce scale. Germany is forecast to hold 15.6% CAGR as enterprise AI use rises. The USA is expected to record 13.5% CAGR because e-commerce and airline retailing already use live demand signals.
How does the Dynamic Pricing Engines Market break down by segment?
Software platform leads Offering at 44.0%; Cloud leads Deployment at 53.0%.
Which Offering dominates?
Software platform holds 44.0% share in 2026.
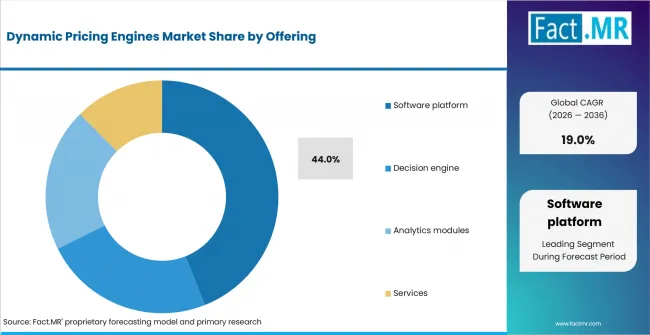
Dynamic Pricing Engines Market Analysis By Offering | Source: Fact.MR
Software platforms are projected to hold 44.0% share in 2026 because pricing teams need one place for rules, recommendations and approvals. Decision engines automate execution. Analytics modules support diagnostics, while services help teams clean price data and configure models.
What leads the Deployment segment?
Cloud accounts for 53.0% share in 2026.
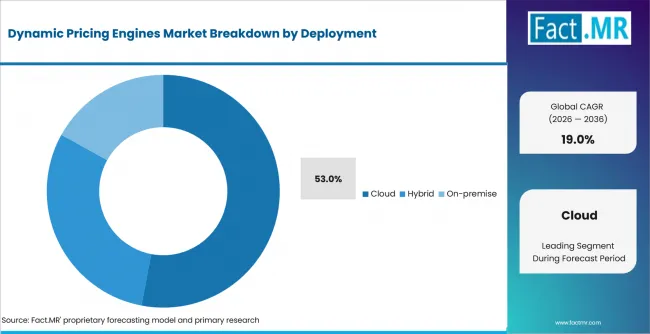
Dynamic Pricing Engines Market Analysis By Deployment | Source: Fact.MR
Cloud deployment is anticipated to account for 53.0% share in 2026 due to faster model updates and easier rollout. Hybrid deployment fits sensitive price data, while on-premise systems remain relevant where legacy controls shape execution.
How does Capability shape demand?
Forecasting captures 42.0% share in 2026.
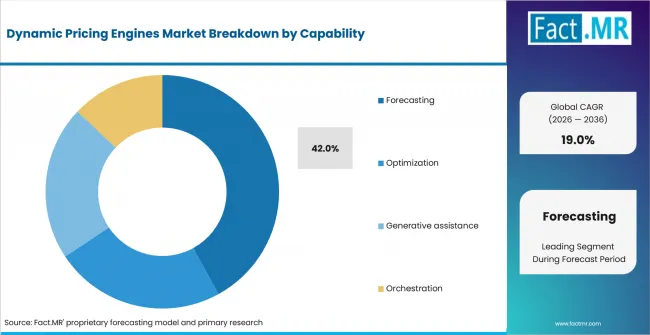
Dynamic Pricing Engines Market Analysis By Capability | Source: Fact.MR
Forecasting is estimated to capture 42.0% share in 2026 because price moves need a demand view before execution. Optimization turns forecasts into recommendations, while orchestration routes accepted prices into ERP, commerce and point-of-sale systems.
What supports Large enterprise demand within Customer Group?
Large enterprise represents 46.0% share in 2026.
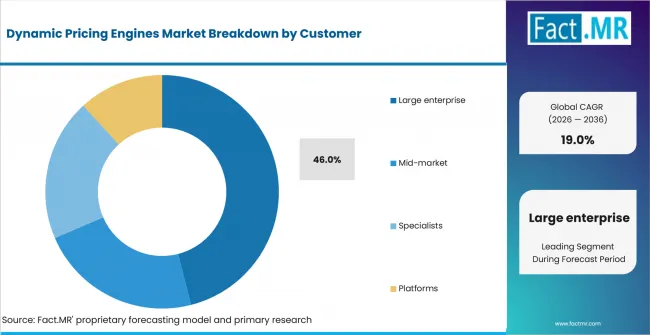
Dynamic Pricing Engines Market Analysis By Customer | Source: Fact.MR
Large enterprises are forecast to represent 46.0% share in 2026 because they manage more price points and channels. Mid-market firms adopt lighter workflows, while pricing specialists and commerce platforms influence implementation choices.
What is accelerating Dynamic Pricing Engines Market adoption, and what is holding it back?
Channel volatility drives it; transparency and data-use risk restrain it.
Drivers Impact Analysis
| Driver | (~) % Impact on CAGR | Geographic Relevance | Impact Timeline |
|---|---|---|---|
| E-commerce price volatility | +2.1% | USA, UK, South Korea | Short term (<= 2 years) |
| AI-assisted forecasting | +1.7% | Europe, Japan, USA | Medium term (2-4 years) |
| Airline and travel offer pricing | +1.3% | USA, UK, Japan | Medium term (2-4 years) |
| B2B quote automation | +1.0% | Germany, USA | Long term (>= 4 years) |
| Marketplace seller competition | +0.8% | Germany, South Korea | Short term (<= 2 years) |
Source: Fact.MR analysis. Updated Aug 25, 2026
- E-commerce price volatility: The U.S. Census Bureau reported Q2 2026 e-commerce sales of USD 340.2 billion, up 12.2% from Q2 2025.
- AI-assisted forecasting: Eurostat reported that 20.0% of EU enterprises with at least 10 persons employed used AI technologies in 2025, up from 13.5% in 2024.
- Airline and travel offer pricing: PROS HOLDINGS, INC. reported Lufthansa Group adoption of Dynamic Ancillary Pricing in January 2025.
- B2B quote automation: Industrial sellers need guidance that reflects cost changes, contract terms and approval limits.
Opportunity Impact Analysis
| Opportunity | (~) % Impact on CAGR | Geographic Relevance | Impact Timeline |
|---|---|---|---|
| Explainable price recommendations | +1.4% | Europe, USA | Short term (<= 2 years) |
| Generative pricing assistants | +1.1% | USA, UK, Japan | Medium term (2-4 years) |
| Embedded commerce pricing | +0.9% | Global | Medium term (2-4 years) |
| Mobile-first seller tools | +0.7% | South Korea, Japan | Long term (>= 4 years) |
Source: Fact.MR analysis. Updated Aug 25, 2026
- Explainable price recommendations: Compliance teams need rule history and reasons for each price change.
- Generative pricing assistants: Analysts use natural-language workflows to review rules, forecasts and exceptions under human approval.
- Embedded commerce pricing: Commerce suites create room for engines that connect recommendations to displayed prices.
- Mobile-first seller tools: Korea’s mobile shopping value formed 79.4% of online shopping value in August 2025.
Restraints Impact Analysis
| Restraint | (~) % Impact on CAGR | Geographic Relevance | Impact Timeline |
|---|---|---|---|
| Consumer transparency requirements | -0.9% | UK, Europe | Short term (<= 2 years) |
| Data privacy and personalization risk | -0.8% | USA, Japan | Medium term (2-4 years) |
| Integration with legacy systems | -0.6% | Global | Medium term (2-4 years) |
| Pricing skills gap | -0.4% | Germany, South Korea | Long term (>= 4 years) |
Source: Fact.MR analysis. Updated Aug 25, 2026
- Consumer transparency requirements: The CMA stated that under the UK’s new consumer protection regime, businesses can face fines of up to 10% of their annual worldwide turnover for breaches of consumer protection law.
- Data privacy and personalization risk: The FTC reported pricing uses tied to precise location and browser history.
- Integration with legacy systems: Older ERP, order and ticketing systems extend deployment cycles.
- Pricing skills gap: Teams need pricing, data and commercial users to translate model output into safe rules.
Which countries are scaling Dynamic Pricing Engines Market fastest?
- The country comparison spans 5.8 percentage points and forms three practical growth bands across the forecast period.
- South Korea remains 2.2 percentage points above the UK through mobile commerce depth, frequent online promotions and strong mobile-shopping activity.
- The UK remains 1.2 percentage points above Japan as high online retail penetration and active pricing-transparency requirements encourage more structured pricing-engine adoption.
- Japan remains 0.3 percentage point above Germany through large B2C and B2B e-commerce transaction pools and increasingly complex digital pricing workflows.
- Germany remains 2.1 percentage points above the USA as enterprise AI adoption and centralized pricing operations support auditable price optimization.
- The USA closes the displayed range through large e-commerce volumes, airline pricing use cases and established demand for real-time pricing signals.
Comparable CAGRs can create different entry conditions due to mobile-commerce intensity, online retail penetration, enterprise AI maturity, regulatory expectations and pricing-system integration needs. Full report coverage includes North America, Latin America, Western Europe, Eastern Europe, East Asia, South Asia & Pacific, and Middle East & Africa.
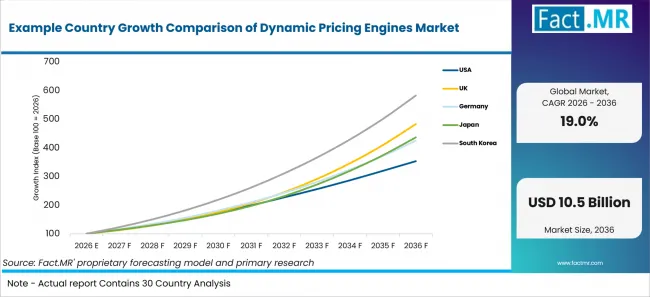
Example Country Growth Comparison Of Dynamic Pricing Engines Market | Source: Fact.MR
| Country | CAGR |
|---|---|
| South Korea | 19.3% |
| UK | 17.1% |
| Japan | 15.9% |
| Germany | 15.6% |
| USA | 13.5% |
Source: Fact.MR analysis. Updated Aug 25, 2026
What is powering South Korea’s lead?
19.3% CAGR, driven by mobile commerce depth and frequent digital price changes.
South Korea’s growth reflects a mobile-first commerce environment where promotions and price tests can change rapidly. Online shopping reached 22.4802 trillion won in August 2025, up 6.6% year over year, while mobile shopping accounted for 79.4% of online shopping value. This scale creates demand for pricing engines that automate adjustments while maintaining clear approval and audit controls.
How is the UK scaling demand?
17.1% CAGR, supported by online retail depth and pricing-transparency requirements.
The UK’s growth is supported by a mature online retail market where pricing teams manage frequent digital price changes. ONS reported in July 2026 that online sales values increased 14.4% year over year in June 2026, while online sales represented 29.4% of retail sales excluding automotive fuel. CMA guidance on dynamic pricing also increases demand for systems that document price ranges, timing and change triggers clearly.
What supports Japan’s outlook?
15.9% CAGR, led by large B2C and B2B e-commerce transaction pools.
Japan’s growth reflects the scale of its digital commerce economy. METI reported that B2C e-commerce reached 26.1 trillion yen in 2024, while B2B e-commerce reached 514.4 trillion yen, up 10.6%. Large transaction volumes create demand for pricing engines that support product-level testing and booking-window optimization while maintaining structured internal approvals.
What underpins Germany’s growth?
15.6% CAGR, supported by enterprise AI adoption and centralized pricing operations.
Germany’s growth is supported by wider enterprise use of AI and strong online purchasing activity. Destatis reported that 26% of enterprises with at least 10 persons employed used AI technologies in 2025, while 82% of people aged 25 to 44 had purchased goods or services online within the previous three months. These conditions support auditable pricing optimization for retail and industrial sellers managing complex customer-specific price lists.
What supports USA adoption?
13.5% CAGR, driven by e-commerce scale and airline pricing use cases.
The USA’s growth reflects large digital commerce volumes and established real-time pricing workflows. The U.S. Census Bureau reported USD 340.2 billion in retail e-commerce sales in Q2 2026, up 12.2% year over year, while BTS produced a preliminary estimate of 97.1 million passenger enplanements for May 2026 across all carriers and unscheduled service. These transaction volumes support demand for pricing engines that combine inventory, timing and customer signals with stronger governance around personalization and data use.
Who leads the Dynamic Pricing Engines Market?
Revionics (an Aptos Company) and Pricefx provide direct pricing-engine platforms, while PROS HOLDINGS, INC. and Oracle Corporation add travel, B2B and retail pricing capabilities.
Revionics (an Aptos Company) is profiled for AI-based retail price management, while Pricefx is profiled for enterprise pricing workflows. Competera is included for retail pricing and competitive intelligence use cases.
PROS HOLDINGS, INC. adds travel and B2B pricing depth. Blue Yonder Group, Inc. and Oracle Corporation extend coverage from retail planning and commerce-suite positions.
Which companies are the key providers?
Key companies include Revionics (an Aptos Company), Competera, Pricefx, PROS HOLDINGS, INC., Blue Yonder Group, Inc., Oracle Corporation.
- Revionics (an Aptos Company)
- Competera
- Pricefx
- PROS HOLDINGS, INC.
- Blue Yonder Group, Inc.
- Oracle Corporation
How is the market segmented?
-
By Offering:
- Software platform
- Decision engine
- Analytics modules
- Services
-
By Deployment:
- Cloud
- Hybrid
- On-premise
-
By Capability:
- Forecasting
- Optimization
- Generative assistance
- Orchestration
-
By Customer Group:
- Large enterprise
- Mid-market
- Pricing specialists
- Commerce platforms
-
By Region:
- North America
- Latin America
- Western Europe
- Eastern Europe
- East Asia
- South Asia & Pacific
- Middle East & Africa
Bibliography
- Bureau of Transportation Statistics. (2026, August 13). May 2026 U.S. airline traffic data down 0.7% from the same month last year. U.S. Department of Transportation.
- Bundeskartellamt. (2025, June 2). Bundeskartellamt has concerns about Amazon’s use of so-called price control mechanisms.
- Eurostat. (2025, December 11). 20% of EU enterprises use AI technologies. European Commission.
- Federal Trade Commission. (2025, January 17). FTC surveillance pricing study indicates wide range of personal data used to set individualized consumer prices.
- Federal Statistical Office. (2025, November 24). Enterprises using artificial intelligence (AI) technologies, by employment size class.
- Federal Statistical Office. (2025, November 27). Internet users and online shoppers.
- Federal Statistical Office. (2025, November 24). Reasons against the use of artificial intelligence technologies, by employment size class.
- Ministry of Economy, Trade and Industry. (2025, August 26). Results of FY2024 E-Commerce Market Survey compiled.
- Ministry of Data and Statistics. (2025, October 1). Online shopping in August 2025.
- Ministry of SMEs and Startups. (2026, January 28). SME exports hit record high in 2025, led by cars, cosmetics and a rebound in China.
- Ministry of SMEs and Startups. (2026, March 13). New survey offers detailed look at Korea’s small business landscape in 2024.
- Office for National Statistics. (2026, July 24). Retail sales, Great Britain: June 2026.
- PROS Holdings, Inc. (2025, January 28). Lufthansa Group and PROS take next step in commercial innovation with advanced AI-based dynamic pricing fueling incremental revenue growth.
- Statistics Bureau of Japan. (2026, February 6). 2025 yearly average. Family Income and Expenditure Survey.
- U.S. Census Bureau. (2026, August 18). Quarterly retail e-commerce sales: 2nd quarter 2026. U.S. Department of Commerce.
This Report Addresses
- Strategic intelligence on dynamic pricing engines by offering and deployment environment.
- Segment analysis covering software platform leadership and cloud deployment share.
- Regional outlook across USA, UK, Germany, Japan and South Korea.
- Competitive analysis covering Revionics (an Aptos Company), Competera, Pricefx, PROS HOLDINGS, INC., Blue Yonder Group, Inc. and Oracle Corporation.
- Capability assessment covering forecasting, optimization, generative assistance and orchestration.
- Customer assessment covering large enterprises, mid-market accounts, pricing specialists and commerce platforms.
- Research support from provider checks, official statistics, regulator reviews and company announcements.
What does the Dynamic Pricing Engines Market cover?
Software platforms, decision engines, analytics modules and services used for price optimization.
The Dynamic Pricing Engines Market covers software used to recommend or execute prices from live business signals. It intersects with retail analytics platforms in price-response analysis. AI recommendation software is adjacent when recommendations influence customer-specific offers.
The assessment excludes broad software distribution platforms unless price optimization is a named function. Adjacent AI in retail systems are included only when pricing logic is deployed.
What is included in the scope?
Dynamic pricing engines used in retail, travel, B2B commerce and platform pricing workflows.
The scope includes licensed software, SaaS platforms, decision engines and services. Engines linked to AI-powered recommendation engines are included when pricing is direct. Coverage also includes frictionless retail infrastructure where price execution is part of the workflow. Analyst tools such as self-service analytics tools are included when users act on price recommendations.
What is excluded from the scope?
General analytics suites and standalone commerce infrastructure are outside the scope.
The scope excludes general BI tools, catalog systems and promotion calendars without price recommendations. Separate edge analytics tools are excluded without pricing logic. General AI agent management services are outside the scope when they only govern agents. Vehicle-focused automotive software systems are included only when they contain a named dynamic pricing engine.
How Was the Analysis Built?
The analysis draws on 120+ sources, 35+ company portfolios, 25+ countries, and more than 20 industry interviews.
- Primary Research: Primary research includes discussions with manufacturers, service providers, technology developers, distributors, end users, procurement teams, and subject-matter experts. These conversations examine purchasing priorities, product adoption, operational challenges, approval requirements, competitive positioning, and the factors that influence wider market acceptance.
- Desk Research: Desk research covers government statistics, regulatory publications, company filings, trade data, technical studies, industry associations, standards, public policy, and other authoritative sources. Every source used in the analysis is documented in the bibliography.
- Market Sizing and Forecasting: Market estimates combine historical performance, demand indicators, pricing and volume trends, segment shares, company participation, country-level growth, adoption patterns, investment activity, and barriers to market expansion.
- Data Validation and Update Cycle: Findings are validated by comparing primary interviews with public data, company activity, regulatory changes, trade patterns, and industry developments. Regular updates review new product launches, capacity changes, partnerships, approvals, procurement trends, and shifts in commercial adoption.
Segmentation
What is the report’s scope and coverage?
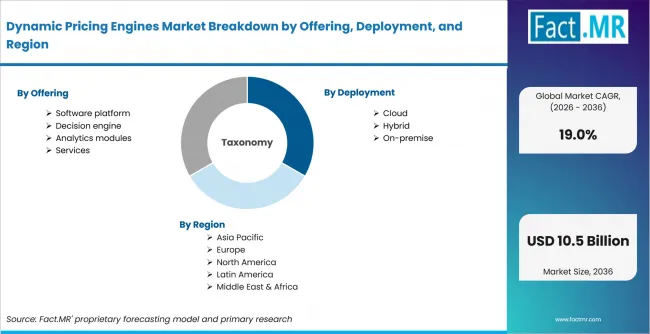
Dynamic Pricing Engines Market Breakdown By Offering, Deployment, And Region | Source: Fact.MR
| Attribute | Details |
|---|---|
| Quantitative Units | USD billion |
| Market Definition | Software engines that recommend, optimize or execute price changes using demand, inventory, competitive, customer and channel signals. |
| Offering | Software platform; Decision engine; Analytics modules; Services |
| Deployment | Cloud; Hybrid; On-premise |
| Capability | Forecasting; Optimization; Generative assistance; Orchestration |
| Customer Group | Large enterprise; Mid-market; Pricing specialists; Commerce platforms |
| Regions Covered | North America; Latin America; Western Europe; Eastern Europe; East Asia; South Asia & Pacific; Middle East & Africa |
| Countries Covered | USA; UK; Germany; Japan; South Korea |
| Companies Profiled | Revionics (an Aptos Company), Competera, Pricefx, PROS HOLDINGS, INC., Blue Yonder Group, Inc., Oracle Corporation |
| Forecast Period | 2026 to 2036 |
| Approach | Hybrid top-down and bottom-up approach using software revenue, pricing use cases, deployment mix, customer adoption, country growth and provider portfolio review. |
Source: Fact.MR analysis. Updated Aug 25, 2026
Frequently Asked Questions
How big is the dynamic pricing engines market in 2026?
What is the CAGR of the dynamic pricing engines market from 2026 to 2036?
Which offering leads the dynamic pricing engines market?
Which deployment leads the dynamic pricing engines market?
Who are the leading companies in the dynamic pricing engines market?
Who worked on this report


Preview the report firsthand - request a free sample
Free SampleGet the brochure for pricing and purchase details
Download PDF