- Market Value (2025): USD 1.4 Bn
- Estimated Value (2026): USD 1.5 Bn
- Forecast Value (2036): USD 3.5 Bn
- CAGR (2026-2036): 8.9%
What is the Flow Cytometry Diagnostics Market forecast to be worth by 2036?
USD 1.5 billion in 2026 to USD 3.5 billion by 2036, at 8.9% CAGR.
- The Flow Cytometry Diagnostics Market crossed a valuation of USD 1.4 billion in 2025, supported by spending on instruments and reagents used in clinical cell-characterization workflows.
- Demand is projected to increase from USD 1.5 billion in 2026 to USD 3.5 billion by 2036 as laboratories strengthen panel validation and measurable residual disease workflows.
- The market is forecast to record an 8.9% CAGR from 2026 to 2036.
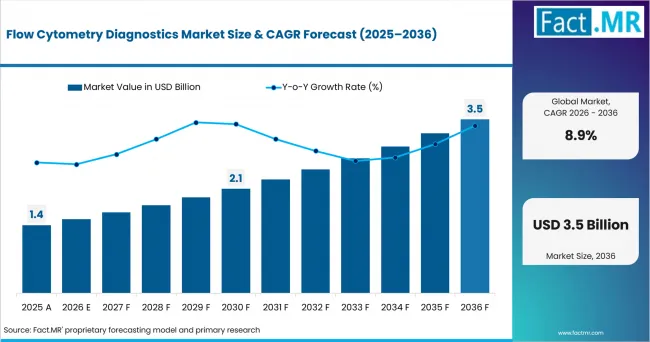
Flow Cytometry Diagnostics Market Value Analysis | Source: Fact.MR
What are the defining numbers behind Flow Cytometry Diagnostics Market growth?
USD 2.0 billion absolute opportunity by 2036 is expected to be shaped by Flow Cytometers and Hematologic Malignancy Diagnosis.
- Demand Drivers in the Market
- Clinical laboratories rely on repeatable cell testing for leukemia and lymphoma. The antibody mix and instrument controls have to be correct, while trained staff review the cell patterns and turn them into a result doctors can use.
- Hospitals benefit from faster testing when blood cancer and transplant teams work with the same sample. Infectious-disease and immune-care teams may also depend on that route.
- Reference laboratories keep a clear record of software steps, instrument settings and cell reviews. This allows later reviewers to understand how the result was reached.
- MRD programs focus on finding very small numbers of cancer cells left after treatment. Careful testing and clear proof of performance help doctors plan follow-up.
- Key Segments Analyzed
- By Product: Flow Cytometers are expected to hold 30.0% share in 2026 supported by their central role in clinical cell counting, immunophenotyping and disease classification.
- By Application: Hematologic Malignancy Diagnosis is projected to account for 25.0% share in 2026 owing to the routine use of cellular markers in leukemia and lymphoma assessment.
- By Technology: Multiparametric Flow Cytometry is anticipated to capture 30.0% share in 2026 due to its ability to examine several cellular markers within a single sample.
- By End User: Hospitals are estimated to represent 30.0% share in 2026 attributable to their integration of pathology laboratories with hematology and oncology services.
- Analyst Opinion at Fact.MR
- Shambhu Nath Jha, Senior Analyst at Fact.MR, states, “Flow cytometry diagnostics is becoming a workflow-control market in which reproducible interpretation carries more weight than parameter count alone. Adoption is expected to favor vendors that limit variation linked to sample age, antibody lots, instrument settings and software gates. Additional channels are likely to gain value only when the full process produces defensible leukemia and measurable residual disease results.”
- Strategic Implications
- Instrument providers must show clear records for quality checks and calibration before hospitals add tests with more markers. The same evidence should cover test sensitivity and service support.
- Reagent and assay teams review antibody choice, color balance and batch quality before using a panel across more disease groups. These checks form part of the approval process.
- Software records have to show how cell groups were selected and how signal overlap was corrected. A second reviewer should be able to follow each step without difficulty.
- Laboratories set limits for sample age and transport before MRD testing enters routine use. Written rules also cover cell recovery and when a test has to be repeated.
Germany is expected to record 12.0% CAGR from 2026 to 2036. University hospitals and specialist laboratories support the outlook. Brazil is projected to post 11.1% CAGR by 2036. Access and regional diagnostic capacity shape purchasing there. The USA is anticipated to advance at 10.2% CAGR through 2036. South Korea is estimated at 9.3% CAGR from 2026 to 2036. The U.K. and Japan are forecast at 8.5% and 7.6% CAGR through 2036.
How does the Flow Cytometry Diagnostics Market break down by segment?
Flow Cytometers leads at 30.0% by Product Segment and Hematologic Malignancy Diagnosis lead at 25.0% by Application segment in 2026.
Why do Flow Cytometers lead Product?
Flow Cytometers hold 30.0% share in 2026.
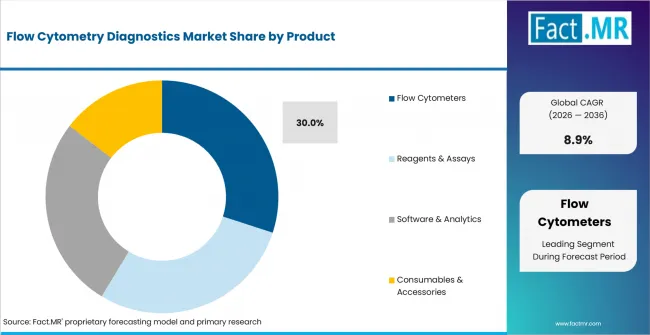
Flow Cytometry Diagnostics Market Analysis By Product | Source: Fact.MR
The instrument determines how many events a laboratory can capture, how weak a signal it can detect and how consistently the same sample can be measured across runs. Reagents and software shape the final result, but both depend on the cytometer producing stable data first. In March 2025, Beckman Coulter Life Sciences launched the CytoFLEX mosaic Spectral Detection Module with support for up to 88 detection channels, showing how manufacturers are expanding analytical depth without separating it from acquisition control.
What keeps Hematologic Malignancy Diagnosis ahead within Application?
Hematologic Malignancy Diagnosis accounts for 25.0% share in 2026.
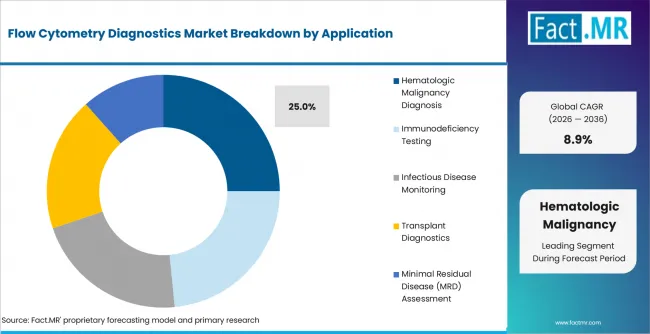
Flow Cytometry Diagnostics Market Analysis By Application | Source: Fact.MR
Leukemia and lymphoma review depends on identifying abnormal cell populations in blood and bone marrow, which makes immunophenotyping part of routine classification work. Even a small change in marker expression can alter the diagnostic category or the next follow-up step. INCA reported in February 2026 that Brazil is expected to record 12,220 leukemia cases per year from 2026 to 2028, keeping hematologic panels central to clinical flow cytometry demand.
How does Multiparametric Flow Cytometry lead Technology?
Multiparametric Flow Cytometry captures 30.0% share in 2026.
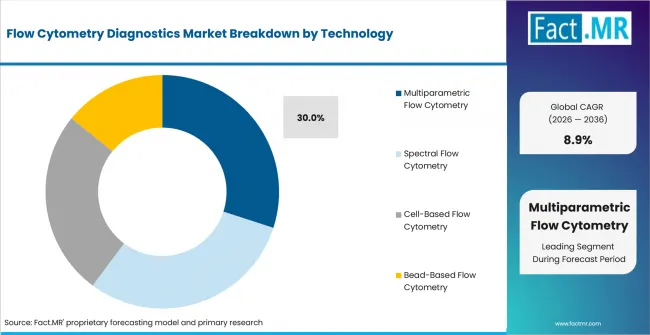
Flow Cytometry Diagnostics Market Analysis By Technology | Source: Fact.MR
Clinical laboratories already have validated panels, compensation methods and staff experience built around multiparametric systems. This installed workflow gives the technology an advantage over newer spectral platforms that require additional training in unmixing and data review. Cytek’s May 2025 launch of the Aurora Evo flow cytometer points to the next stage of competition, where higher throughput and automation are added without removing the need for careful panel validation.
Why are Hospitals the leading End User?
Hospitals represent 30.0% share in 2026.
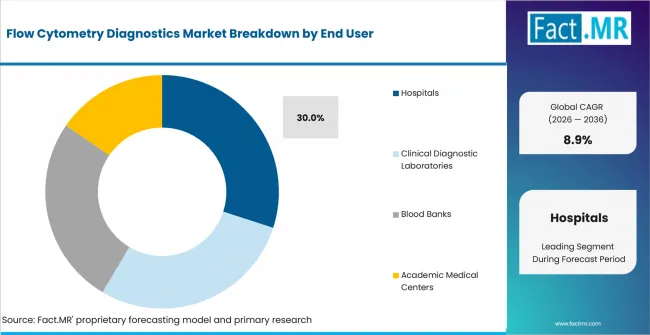
Flow Cytometry Diagnostics Market Analysis By End User | Source: Fact.MR
Flow cytometry results often feed directly into hematology, transplant, immune-status and infection-related decisions, so testing capacity works best when it sits close to treating clinicians. Diagnostic laboratories and blood banks handle important volumes, while academic medical centers add complex referral cases and research-linked testing.
What is accelerating Flow Cytometry Diagnostics Market adoption, and what is holding it back?
Standardized panels and proficiency expectations are anticipated to support adoption, while gating gaps and specimen-handling burden are expected to slow wider use.
Drivers Impact Analysis
| DRIVER | (~) % IMPACT ON CAGR | GEOGRAPHIC RELEVANCE | IMPACT TIMELINE |
|---|---|---|---|
| Standardized panel and proficiency frameworks | +1.5% | Global, with higher relevance in Germany and Brazil | Medium term (2-4 years) |
| Regulatory clarity for automated image and pattern analysis | +1.2% | USA | Medium term (2-4 years) |
| Instrument and multiparametric technology upgrades | +0.9% | Germany and USA | Short term (<=2 years) |
| Hospital-based diagnostic capacity expansion | +0.7% | Brazil and U.K. | Long term (>=4 years) |
| Harmonized immune profiling and MRD guidance | +0.5% | Germany and U.K. | Long term (>=4 years) |
Source: Fact.MR analysis. Updated Jul 20, 2026
- Standardized panel and proficiency frameworks: CAP accreditation material describes annual checklist updates and discipline-specific laboratory expectations. EuroFlow publications add standardized antibody panels and analysis approaches for hematologic diagnosis and MRD. These frameworks are expected to make laboratories compare suppliers on evidence and controls before expanding routine testing. Workflow support is part of the same decision.
- Regulatory clarity for automated image and pattern analysis: FDA’s AI-enabled medical device list includes hematology entries with dated final decisions. Athelas Home has a final decision date of February 6, 2026. Flow cytometry software is not the same device class. Laboratories still watch these regulatory signals when they consider automated image review and pattern recognition. Report traceability remains part of that review because software output must be defensible in a laboratory file.
Opportunity Impact Analysis
| OPPORTUNITY | (~) % IMPACT ON CAGR | GEOGRAPHIC RELEVANCE | IMPACT TIMELINE |
|---|---|---|---|
| Minimal Residual Disease (MRD) assessment expansion | +0.6% | Germany and U.K. | Medium term (2-4 years) |
| Spectral flow cytometry adoption | +0.5% | Japan and South Korea | Medium term (2-4 years) |
| Software and analytics for gating auditability | +0.4% | South Korea and USA | Short term (<=2 years) |
| Academic and blood-bank testing capacity | +0.3% | Brazil | Long term (>=4 years) |
Source: Fact.MR analysis. Updated Jul 20, 2026
- Minimal Residual Disease assessment expansion: MRD testing is expected to create referral volume for laboratories with proven sensitivity and specimen stability. Harmonized interpretation becomes the next requirement when clinicians compare results across time. EuroFlow’s MRD-centered panels give laboratories a shared reference point. Each site still needs local validation before using the result in routine clinical review.
- Spectral flow cytometry adoption: Spectral systems are anticipated to gain room in complex immune panels where conventional compensation becomes difficult. The opportunity needs careful proof before laboratories expand it into routine work. Laboratories need training and reference materials before they change familiar acquisition routines. Unmixing checks and software review steps must support higher-dimensional data before it supports a clear diagnostic answer.
- Software and analytics for gating auditability: Software demand is projected to grow because laboratory directors need traceable gate review before they expand complex reports. Audit trails and version history are expected to become purchase criteria. Analyst sign-off is another part of the same decision when hospitals link flow results to hematology and transplant care.
Restraints Impact Analysis
| RESTRAINT | (~) % IMPACT ON CAGR | GEOGRAPHIC RELEVANCE | IMPACT TIMELINE |
|---|---|---|---|
| Gating and reporting pathway gaps | -0.5% | South Korea and USA | Short term (<=2 years) |
| Pre-analytical specimen handling burden | -0.4% | Germany | Short term (<=2 years) |
| Panel and reagent standardization costs | -0.3% | Brazil | Medium term (2-4 years) |
| High-dimensional validation burden | -0.3% | Japan | Medium term (2-4 years) |
Source: Fact.MR analysis. Updated Jul 20, 2026
- Gating and reporting pathway gaps: Adoption is expected to slow when the laboratory lacks a clear route from raw events to signed reports. The barrier is practical because a reviewer needs to understand every step behind a diagnostic answer. Analysts need defined gates and review logs before exception cases move forward. Repeat-test triggers are needed before clinicians trust a result that changes treatment follow-up.
- Pre-analytical specimen handling burden: Flow cytometry results depend on sample age and transport time because delayed handling can reduce viability and cell recovery. A well-designed panel does not rescue a poor specimen once cells have degraded. Courier rules and accession timing therefore belong in the operating plan before routine use. Rejection criteria should be written before laboratories expand the workflow.
- Panel and reagent standardization costs: Smaller laboratories are expected to face pressure when clone selection and fluorochrome balance must be documented for each panel. Lot review and controls add further work for teams that already have limited specialist capacity. Bio-Rad’s January 2025 TrailBlazer and StarBright dye label kit launch shows how reagent vendors are extending panel-building tools. Local validation still costs time and staff effort.
Where is Flow Cytometry Diagnostics Market demand growing across key countries?
The worldwide 8.9% CAGR combines the growth of every country included in the forecast. Germany, Brazil, the USA and South Korea grow faster than this rate. The U.K. and Japan move more slowly. The six countries shown are examples from the wider study and do not mark the full highest and lowest range.
- The differences between these markets go beyond the CAGR figures. Each country faces a separate challenge that affects how quickly flow cytometry becomes part of routine diagnosis.
- Germany benefits from strong hospital laboratories and careful control of sample age, transport and cell condition. Brazil has steady demand for leukemia and lymphoma testing, but access outside major cities and the cost of checking new panels can slow use in smaller laboratories.
- The USA gains from specialist blood cancer centers, clinical studies and demand for results that stay consistent across referral sites. South Korea relies more on connected hospital systems. Clear software records and consistent cell review become more important as laboratories handle more cases.
- The U.K. faces pressure to shorten diagnosis times without lowering result quality. Japan takes a slower approach. Advanced systems remain useful, but hospitals usually require strong local testing before wider use.
Countries with similar growth rates can still have different buying priorities. Some focus on sample handling, while others look more closely at reagents, machine sensitivity, software records or staff training. The full report covers North America, Latin America, Western Europe, Eastern Europe, East Asia, South Asia and Pacific, and the Middle East and Africa.
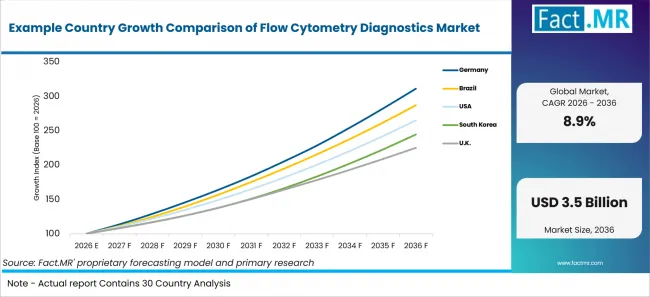
Example Country Growth Comparison Of Flow Cytometry Diagnostics Market | Source: Fact.MR
| COUNTRY | CAGR |
|---|---|
| Germany | 12.0% |
| Brazil | 11.1% |
| USA | 10.2% |
| South Korea | 9.3% |
| U.K. | 8.5% |
| Japan | 7.6% |
Source: Fact.MR analysis. Updated Jul 20, 2026
What shapes growth in Germany?
12.0% CAGR, driven by large hospital laboratories and careful sample handling.
Germany has a large hospital system that sends difficult blood and bone marrow cases to specialist laboratories. Destatis recorded more than 17.2 million hospital cases across 1,874 hospitals in 2023. This supports demand for instruments and testing materials. Laboratories still have to control sample age, transport time, cell condition and cell recovery before doctors use the results in blood disease care.
What shapes growth in Brazil?
11.1% CAGR, supported by blood cancer testing and wider access to test panels.
Brazil’s growth depends on whether advanced testing can reach regional laboratories outside major cancer centers. INCA estimates 12,560 non-Hodgkin lymphoma cases each year from 2026 to 2028. This creates steady demand for tests that identify different cell types. Smaller laboratories may still face high reagent costs and difficulty setting up and checking antibody panels. Companies that provide hands-on testing support can serve these laboratories more effectively.
What shapes growth in the USA?
10.2% CAGR, backed by specialist blood cancer centers and consistent results across laboratories.
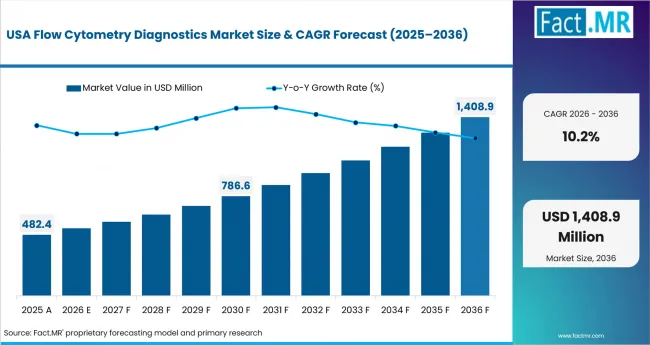
Flow Cytometry Diagnostics Market Country Value Analysis | Source: Fact.MR
Demand in the USA covers leukemia and lymphoma diagnosis, immune checks and tests for small numbers of cancer cells left after treatment. SEER reports 18.7 non-Hodgkin lymphoma cases per 100,000 people. This keeps testing active across a wide specialist network. Patients and samples often move between referral centers, so laboratories place greater value on instrument checks, test sensitivity and results that remain consistent at different sites.
What shapes growth in South Korea?
9.3% CAGR, supported by major cancer centers and clear digital records.
South Korea carries out much of its complex flow cytometry testing in large specialist hospitals. The National Cancer Center reported 288,613 new cancer patients in 2023. Higher case numbers increase the amount of data that laboratory staff must review. Saved analysis steps, clear software records and tools for a second review help staff check how each result was reached.
What shapes growth in the U.K.?
8.5% CAGR, led by NHS time targets and clear blood cancer reporting.
The U.K. tracks the time between cancer referral, diagnosis and treatment through the NHS. NHS England publishes cancer waiting-time figures each month and quarter. This keeps pressure on hospitals to return results quickly. Flow cytometry systems are useful when they shorten testing and review time without weakening the written evidence used for leukemia, transplant and remaining-cancer-cell decisions.
What shapes growth in Japan?
7.6% CAGR, supported by blood cancer testing but slowed by careful local checks.
Japan has a strong medical base for advanced flow cytometry. Its National Cancer Center projected 38,300 malignant lymphoma cases and 15,200 leukemia cases for 2025. Hospitals usually expand larger test panels only after local checks confirm that signals separate clearly, reagents remain stable and staff reach the same result. This careful process supports demand but slows wider routine use.
Who leads the Flow Cytometry Diagnostics Market?
BD and Beckman Coulter Life Sciences lead direct instrument and reagent coverage, while Cytek Biosciences and Thermo Fisher Scientific strengthen spectral analysis and broader laboratory workflow support.
BD combines flow cytometers, antibodies, software and cell-sorting tools across clinical and research laboratories. In May 2025, the company launched the BD FACSDiscover A8 Cell Analyzer, combining spectral detection with real-time cell imaging and support for analysis of more than 50 cellular characteristics. Beckman Coulter Life Sciences competes through the CytoFLEX platform and related reagent and software support. Its March 2025 CytoFLEX mosaic module added spectral capability in configurations supporting up to 88 detection channels. These companies compete on acquisition stability, panel depth and the ability to preserve traceable results across repeated runs.
Cytek Biosciences focuses more closely on full-spectrum flow cytometry. Its Aurora Evo launch in May 2025 added higher throughput and automation for laboratories handling complex panels. Thermo Fisher Scientific and Bio-Rad Laboratories contribute instruments, antibodies, dyes and assay inputs, while Miltenyi Biotec adds cell enrichment and sample-preparation strength. Sysmex, Agilent Technologies and Bio-Techne complete the provider set through cell analysis, sorting, reagents and adjacent workflow tools. Competition through 2036 is expected to center on panel validation, software audit trails, specimen control and reproducible MRD and hematologic results.
Which companies are the key providers?
The company landscape includes BD (Becton, Dickinson and Company), Beckman Coulter Life Sciences, Sysmex Corporation, Cytek Biosciences, Inc., Thermo Fisher Scientific Inc., Bio-Rad Laboratories, Inc., Agilent Technologies, Inc., Miltenyi Biotec.
- BD (Becton, Dickinson and Company)
- Beckman Coulter Life Sciences
- Sysmex Corporation
- Cytek Biosciences, Inc.
- Thermo Fisher Scientific Inc.
- Bio-Rad Laboratories, Inc.
- Agilent Technologies, Inc.
- Miltenyi Biotec
Bibliography
- Becton, Dickinson and Company. (2025, May 13). BD launches landmark cell analyzer featuring breakthrough spectral and real-time cell imaging technologies.
- Beckman Coulter Life Sciences. (2025, March 18). Beckman Coulter Life Sciences launches industry-first modular spectral flow cytometry solution.
- Instituto Nacional de Câncer. (2026, February 4). Estimativa 2026–2028: Incidência de câncer no Brasil.
- U.S. Food and Drug Administration. (2025, January 6). FDA issues comprehensive draft guidance for developers of artificial intelligence-enabled medical devices.
This Report Addresses
- The report provides strategic intelligence on Flow Cytometry Diagnostics across Product and Application choices that shape clinical cell-characterization workflows.
- Segment analysis covers Flow Cytometers and Hematologic Malignancy Diagnosis as the share leaders within the 2026 market structure.
- Regional outlook evaluates Germany and Brazil alongside the United States and South Korea, while the United Kingdom, Japan, and 25+ countries complete the growth comparison.
- Competitive analysis profiles BD and Beckman Coulter Life Sciences alongside Sysmex Corporation and Cytek Biosciences, followed by Thermo Fisher Scientific, Bio-Rad Laboratories, Agilent Technologies, and Miltenyi Biotec.
- Technology assessment covers Multiparametric Flow Cytometry and Spectral Flow Cytometry alongside Cell-Based and Bead-Based Flow Cytometry across diagnostic workflows that require different panel-design, compensation, unmixing, and validation logic.
- Use-case assessment covers Hematologic Malignancy Diagnosis and Immunodeficiency Testing alongside Infectious Disease Monitoring, Transplant Diagnostics, and Minimal Residual Disease assessment.
What does the Flow Cytometry Diagnostics Market cover?
Flow Cytometers, Reagents & Assays, Software & Analytics, and Consumables & Accessories used to characterize cells across clinical diagnostic workflows.
The Flow Cytometry Diagnostics Market covers instruments, reagents, assays, software, consumables, and related workflows used to identify and measure cellular characteristics. Coverage includes hematologic malignancy diagnosis and immunodeficiency testing alongside infectious disease monitoring, transplant diagnostics, and Minimal Residual Disease assessment.
The market differs from general laboratory equipment because commercial value comes from cell-specific acquisition, marker detection, panel interpretation, and diagnostic reporting. Unrelated laboratory instruments and complete clinical procedure expenditure remain outside the boundary unless their principal commercial function supports defined flow cytometry diagnostics.
What is included in the scope?
Flow cytometry instruments, testing materials, and analytical workflows used across hospitals and clinical laboratory environments.
The scope includes Flow Cytometers and Reagents & Assays alongside Software & Analytics and Consumables & Accessories. Coverage spans Multiparametric and Spectral Flow Cytometry alongside Cell-Based and Bead-Based technologies used in Hematologic Malignancy Diagnosis and Immunodeficiency Testing. Infectious Disease Monitoring, Transplant Diagnostics, and Minimal Residual Disease assessment are included when cellular characterization is the purchased diagnostic function.
Hospitals and Clinical Diagnostic Laboratories are included alongside Blood Banks and Academic Medical Centers. Coverage also considers specimen age, transport conditions, cell viability, panel design, antibody clones, fluorochrome balance, compensation or unmixing, instrument calibration, gating strategy, software traceability, and analyst interpretation because these factors influence routine diagnostic adoption across the segmentation framework.
What is excluded from the scope?
Unrelated laboratory equipment, complete procedure expenditure, and adjacent services outside clinical flow cytometry diagnostics are outside the scope.
The scope excludes instruments and services that do not support cellular characterization through flow cytometry. Complete treatment, hospitalization, and procedure costs are excluded because the market covers diagnostic products and supporting workflows rather than total patient-care expenditure. General laboratory software is excluded unless its principal commercial function supports flow cytometry acquisition, gating, analysis, audit trails, or diagnostic reporting.
Unrecorded segment shares and unreported company shares are not added. Claims without a named current source remain outside the analysis, while public publications are used to explain implementation, regulation, disease burden, and workflow conditions rather than replace Fact.MR market values.
How Was the Analysis Built?
The analysis draws on 120+ sources, 35+ company portfolios, 25+ countries, and more than 20 industry interviews.
- Primary Research: Primary research includes discussions with manufacturers, service providers, technology developers, distributors, end users, procurement teams, and subject-matter experts. These conversations examine purchasing priorities, product adoption, operational challenges, approval requirements, competitive positioning, and the factors that influence wider market acceptance.
- Desk Research: Desk research covers government statistics, regulatory publications, company filings, trade data, technical studies, industry associations, standards, public policy, and other authoritative sources. Every source used in the analysis is documented in the bibliography.
- Market Sizing and Forecasting: Market estimates combine historical performance, demand indicators, pricing and volume trends, segment shares, company participation, country-level growth, adoption patterns, investment activity, and barriers to market expansion.
- Data Validation and Update Cycle: Findings are validated by comparing primary interviews with public data, company activity, regulatory changes, trade patterns, and industry developments. Regular updates review new product launches, capacity changes, partnerships, approvals, procurement trends, and shifts in commercial adoption.
Segmentation
What is the report’s scope and coverage?
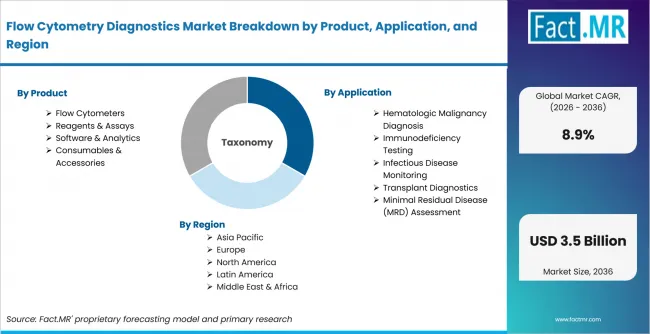
Flow Cytometry Diagnostics Market Breakdown By Product, Application, And Region | Source: Fact.MR
| Attribute | Details |
|---|---|
| Quantitative Units | USD Billion in 2026 to USD Billion by 2036 at a CAGR |
| Market Definition | Instruments, reagents, assays, software, consumables, and related diagnostic workflows used to characterize cells for hematologic malignancy diagnosis, immune assessment, infectious disease monitoring, transplant diagnostics, and minimal residual disease evaluation |
| Product | Flow Cytometers; Reagents & Assays; Software & Analytics; Consumables & Accessories |
| Application | Hematologic Malignancy Diagnosis; Immunodeficiency Testing; Infectious Disease Monitoring; Transplant Diagnostics; Minimal Residual Disease (MRD) Assessment |
| Technology | Multiparametric Flow Cytometry; Spectral Flow Cytometry; Cell-Based Flow Cytometry; Bead-Based Flow Cytometry |
| End User | Hospitals; Clinical Diagnostic Laboratories; Blood Banks; Academic Medical Centers |
| Regions Covered | North America; Latin America; Western Europe; Eastern Europe; East Asia; South Asia and Pacific; Middle East and Africa |
| Countries Covered | Germany; Brazil; United States; South Korea; United Kingdom; Japan |
| Key Companies Profiled | BD (Becton, Dickinson and Company); Beckman Coulter Life Sciences; Sysmex Corporation; Cytek Biosciences, Inc.; Thermo Fisher Scientific Inc.; Bio-Rad Laboratories, Inc.; Agilent Technologies, Inc.; Miltenyi Biotec |
| Forecast Period | 2026 to 2036 |
| Approach | Hybrid top-down and bottom-up approach using instrument and reagent demand; hematologic testing volumes; hospital and laboratory capacity; panel-validation activity; specimen-handling requirements; multiparametric and spectral technology adoption; MRD workflow expansion; software traceability; country-level growth |
Source: Fact.MR analysis. Updated Jul 20, 2026
How is the market segmented?
-
By Product:
- Flow Cytometers
- Reagents & Assays
- Software & Analytics
- Consumables & Accessories
-
By Application:
- Hematologic Malignancy Diagnosis
- Immunodeficiency Testing
- Infectious Disease Monitoring
- Transplant Diagnostics
- Minimal Residual Disease (MRD) Assessment
-
By Technology:
- Multiparametric Flow Cytometry
- Spectral Flow Cytometry
- Cell-Based Flow Cytometry
- Bead-Based Flow Cytometry
-
By End User:
- Hospitals
- Clinical Diagnostic Laboratories
- Blood Banks
- Academic Medical Centers
-
By Region:
- North America
- Latin America
- Western Europe
- Eastern Europe
- East Asia
- South Asia and Pacific
- Middle East and Africa
Frequently Asked Questions
Which Product leads the Flow Cytometry Diagnostics Market?
Which Application leads the Flow Cytometry Diagnostics Market?
Which Technology leads the Flow Cytometry Diagnostics Market?
Which End User leads the Flow Cytometry Diagnostics Market?
Which country records the highest CAGR in the Flow Cytometry Diagnostics Market?
How does Brazil perform in the Flow Cytometry Diagnostics Market?
How does the United States perform in the Flow Cytometry Diagnostics Market?
How does South Korea perform in the Flow Cytometry Diagnostics Market?
How does the United Kingdom perform in the Flow Cytometry Diagnostics Market?
How does Japan perform in the Flow Cytometry Diagnostics Market?
What is the primary driver in the Flow Cytometry Diagnostics Market?
What is the main restraint in the Flow Cytometry Diagnostics Market?
Why are Flow Cytometers important?
Why does Hematologic Malignancy Diagnosis dominate demand?
Why is Multiparametric Flow Cytometry important?
Why do Hospitals dominate demand?
What is the Flow Cytometry Diagnostics Market expected to be worth by 2036?
What absolute opportunity will the Flow Cytometry Diagnostics Market create?
Who worked on this report


Preview the report firsthand - request a free sample
Free SampleGet the brochure for pricing and purchase details
Download PDF