Glycine Market
Glycine Market Analysis, By Grade Type (Food Grade, Technical Grade, and Pharma Grade), By Production Method, By End Use and Region - Market Insights 2025 to 2035
Technical Grade is projected to grow at a CAGR of 5.9%, whereas another segment Food Grade is likely to grow at 8.1%. In terms of countries U.S. is projected to grow at 7.6%, followed by China at 6.8% and India to grow at 9%
Glycine Market Outlook (2025 to 2035)
The global glycine market is expected to reach USD 2,825.8 million by 2035, up from USD 1,356.4 million in 2024. During the forecast period (2025 to 2035), the industry is projected to expand at a CAGR of 6.9%.
Glycine is widely used as a nutritional supplement in animal feed as it regulates all metabolic processes. Increasing meat consumption globally, along with high livestock production, such as swine, broilers, and cattle, will lead to a surge in demand for animal feed additives.
Quick Stats for Glycine Market
- Industry Value (2025): USD 1450 Million
- Projected Value (2035): USD 2825.8 Million
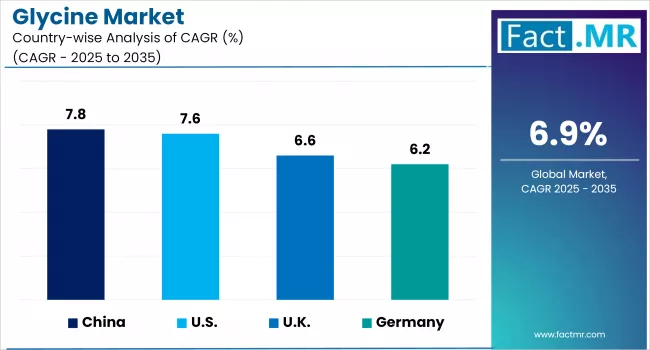
- Forecast CAGR (2025 to 2035): 6.9%
- Leading Segment (2025): Food Grade (40% Market Share)
- Country Growth Rate (2025 to 2035) : China (7.8% CAGR)
- Top Key Players: Ajinomoto, Chattem Chemicals, Evonik, and GEO Specialty Chemicals
In addition, growth in global meat export reflects a projected increase in consumption of glycine over the following years. North America accounts for approximately one-third of the global glycine market value, supported by meat, which represents nearly 60 percent of total protein intake in the United States.
Governments in various countries are implementing initiatives aimed at expanding livestock populations and enhancing cattle breeding activities, which is also projected to support demand for glycine in the global market.
What are the drivers of the glycine market?
In the pharmaceutical industry, glycine is used as a component of amino acid mixtures for oral and parenteral use. It is used as a reabsorbable amino acid for the treatment of diarrhea and animal scours. Glycine is a versatile intermediate used in the chemical synthesis of pharmacologically active compounds. It has antimicrobial preservative properties and has been shown to stabilize vitamin C.
Certain pharmaceutical-grade products include glycine to improve the gastric absorption of the drug. Other uses include sweetener, emollient, emulsifier, solubilizing agent, stabilizer, and buffer substance in various applications. Therefore, the growing pharmaceutical industry is expected to increase demand for glycine.
Glyphosate is a synthetic amino acid that is widely used in biocides. Glycine acts as a feedstock in glyphosate production, and shifts in glyphosate demand directly influence the glycine market. The demand for glyphosate is expected to remain high during the assessment period, driven by the increasing adoption of herbicide-tolerant (HT) and genetically modified (GM) crops.
The increasing demand for reduced tillage and no-tillage farming systems is expected to positively impact the demand for glyphosate consumption. Glyphosate contributes to higher per-hectare yield.
Continued emphasis on improving crop yield, growing demand for crop protection solutions in agriculture, and preference towards sophisticated farming practices are other factors impacting demand for glyphosate and, consequently, the glycine market.
What are the regional trends of the glycine market?
Pharmaceutical, nutraceutical and food processing sectors are the main drivers of the glycine demand in the United States. The FDA regulations supporting stringent compliance with USP-grade have created a high-end segment within the pharmaceutical glycine market. The Asia suppliers are also entering into long-term supply agreements with domestic trading partners to guarantee uniformity in quality and traceability along health-focused sectors.
China remains the leading global exporter of glycine, with large-scale synthesis conducted through the ammonia-chloroacetic acid process. The stringent environmental controls have not significantly impacted Chinese exports as cost advantages and mature infrastructure continue to provide a competitive edge. Export-driven production has seen the main companies switch to electrochemical synthesis to meet Japanese, EU, and U.S. residue and purity specifications.
India is expanding both upstream and downstream glycine production capacity. The increase in pharma-grade glycine capacity is linked to the demand for API and nutraceutical exports by domestic manufacturers. Supportive government initiatives under the Make in India program promote process innovation while also contributing to stable internal demand in animal feed, food, and beverage applications.
What are the challenges and restraining factors of the glycine market?
The primary market limit consists of the volatility of feed stock and fluctuations of ammonia and chloroacetic acid cost. Changes in upstream levels of chemical markets, particularly China and India, affect glycine prices. This renders long-term purchasing unreliable to the international buyers; it also affects inventory management and supplier risk assessments.
The uncertainty surrounding policy regarding glyphosate, the most significant industrial use of glycine, continues to influence the overall market. Concerns persist regarding investment in glycine-based glyphosate supply chains as regulatory scrutiny intensifies in the EU and parts of North America. This inhibits future planning and delays the expansion of associated infrastructure.
Another challenge is the level of technology, particularly in the production of glycine at food and pharma-grade levels. Multi-stage purification, GMP and validated equipment are crucial to achieve high purity output. Smaller producers in emerging economies face difficulties in meeting international certification standards thus creating entry barriers and limiting their ability to compete with a limited number of technically advanced market participants.
Country-Wise Insights
Expanding retail network enhancing market penetration effectively in India
The global glycine market is expanding its retail presence in India as a means to enhance market penetration. With increasing demand for pharmaceuticals, food additives, and animal feeds, various companies are focusing on expanding e-commerce platforms and retail chains in India to reach different consumer segments.
Economic growth and increasing disposable incomes among Indian consumers also enhance the consumption of glycine, particularly in the health and wellness sector. Therefore, manufacturers are collaborating with local distributors and reforming logistics to make their products available in both urban and rural regions.
This targeted retail expansion contributes to increasing market share, enhances growth sustainability, and creates additional opportunities within the Indian market.
The United States is The Demand and Compliance Hub for Glycine Applications
America holds a central position in the global market with high-grade consumption of glycine in applications such as bio-based and food-grade sectors. The healthcare, nutraceutical, and pet nutrition industries provide domestic demand, as their operations necessitate the use of ingredients that meet USP requirements. Distributors prefer reliable, traceable supply chains that comply with FDA and NSF certificate provisions.
The U.S. plays a significant role in setting standards and testing protocols; however, it does not produce a substantial share of the glycine it consumes. Importers typically enter into long-term agreements with certified suppliers in China and India, where on-site quality assurance procedures are implemented. This quality framework supports importers in maintaining compliance with high-level specifications.
Clean-label food systems, health-related products, and regenerative medications are among the areas where American companies utilize glycine. This increases its application-based growth, and a strict safety environment positions the U.S. as a strategic cornerstone of value-added glycine trades worldwide.
China is The Cost-Efficient Global Glycine Manufacturing Powerhouse
China is the global leader in glycine production, as it operates integrated chemical production and export-oriented synthesis paths. It benefits from favourable production economics in the ammonia-chloroacetic acid process, enabling Chinese companies to maintain pricing leadership in technical-grade and food-grade glycine worldwide.
China is based on export capability, with key clients located in the EU, the U.S. and Southeast Asia. Manufacturers are investing in process upgrades and control purification in order to stay compliant. Newer entrants are shifting towards electrochemical and bio-based synthesis to meet the increasing purity demands in developed economies.
Domestic consumption also utilizes large quantities of glycine, used in herbicides and also to supplement animal feeds. The government supports China’s scale advantages in terms of chemical clusters and the export of agrochemicals. Environmental enforcement, however, is encouraging the consolidation and modernization of second-tier players, thereby adding to the technological edge of more advanced manufacturers.
Category-Wise Analysis
Food Grade Glycine is The Growth Driver in Functional and Regulatory-Compliant Nutrition
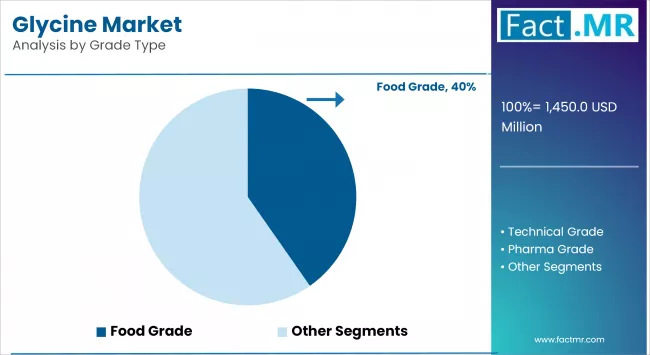
Commercial use of food-grade glycine began with its approval as a flavouring agent and a preservative enhancer. It is used in protein-enriched snacks, bakery products as well as fortified beverages. Its solubility, the nature of GRAS and capability of stabilizing ingredients in fluctuating storage conditions make it a preferred choice among manufacturers. These characteristics establish its role within functional food systems.
Clean-label trends and increased worldwide interest in performance nutrition continue to shape the outlook for this segment. International scale-up remains supported by regulatory acceptance in the U.S., Europe and Japan. With food processors focusing on amino acid fortification and transparency in ingredient labelling, demand for food-grade glycine is expected to remain steady.
Ammonia and Chloroacetic Acid Process is The Backbone of Global Glycine Production
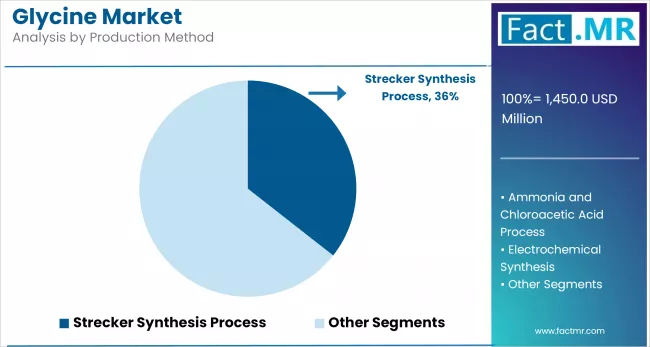
The ammonia and chloroacetic acid route is the most common way in which glycine is produced, as it is cost-effective and scalable. It remains the primary technology for producing technical and food-grade glycine, particularly in China and India. Bulk producers prefer this process as it allows ongoing production and easy purification on an industrial level.
Besides environmental scrutiny, process optimization has enhanced emissions management and waste control. This synthesis method is becoming more environmentally compatible through advancements in reactor design and solvent recovery systems. Further automation and complication controls guarantee that this production method remains sustainable, even as global competition intensifies and production standards continue to evolve.
Competitive Analysis
Key players in the glycine industry include Ajinomoto, Chattem Chemicals, Evonik, GEO Specialty Chemicals, Guangrong Chemical, Hebei Donghua Jiheng Chemical, Hubei Xingfa Chemicals Group, Linxi Hongtai, Paras Intermediates Private Limited, and Shijiazhuang Donghua Jinlong Chemical.
The competition landscape of the glycine market is intense. Ajinomoto, Evonik, and Chattem Chemicals are key market players that contribute significantly to R&D investment and the advancement of sustainable feed concepts to address market demands.
These companies also focus on increasing investments in efficient manufacturing related to glycine flavoring applications, production growth, and environmental considerations.
To expand their sales, manufacturers are embracing different strategies, including vertical and strategic acquisitions. For instance, Evonik was able to increase its market share by acquiring smaller glycine companies and integrating them into its distribution network, thereby ensuring the quality and availability of raw materials.
Döhler was strategic in targeting not only local consumers but also local glycine producers to regionalize their distribution and thereby improve market access.
Recent Development
- In October 2024, Evonik won the 2024 CPHI Pharma Award in "Sustainability" for its plant-based squalene, PhytoSquene®, a groundbreaking, GMP-compliant alternative to animal-derived squalene for drug delivery applications.
- In December 2023, Ajinomoto Co. has completed the acquisition of Forge Biologics, a U.S.-based gene therapy CDMO, through its subsidiary Ajinomoto North America, marking a strategic expansion into next-generation healthcare solutions.
Fact.MR has provided detailed information about the price points of key manufacturers of the Glycine Market positioned across regions, sales growth, production capacity, and speculative technological expansion, in the recently published report.
Methodology and Industry Tracking Approach
The 2025 glycine market report by Fact.MR draws from the insights of 1,200 stakeholders across 12 countries, with no fewer than 75 respondents per market. Among them, 65% represented end users such as electronics manufacturers, biomedical sensor developers, and flexible packaging innovators, while the remaining 35% included procurement officers, materials engineers, ink formulation experts, and compliance analysts.
The research spanned July 2024 through June 2025 and evaluated key performance indicators including viscosity, printability, adhesion properties, stretch resistance, and thermal stability. A regional calibration model was deployed to reflect demand and technology maturity in North America, Asia Pacific, and Europe.
Insights were sourced from over 95 validated datasets including patent filings, investor reports, academic publications, benchmark testing results, and supply chain intelligence. Triangulation across these inputs enabled high-confidence market forecasts and segment-level analytics with strong predictive reliability.
Fact.MR applied rigorous analytical tools, such as multivariate regression and scenario modeling, to ensure data robustness. With continuous monitoring of the glass adhesives market since 2018, this report provides a comprehensive roadmap for firms seeking a competitive advantage, innovation, and sustainable growth within the sector.
Segmentation of Glycine Market
-
By Grade Type :
- Food Grade
- Technical Grade
- Pharma Grade
-
By Production Method :
- Strecker Synthesis Process
- Ammonia and Chloroacetic Acid Process
- Electrochemical Synthesis
- Others
-
By End Use :
- Food & Beverage Industry
- Pesticides Industry
- Pharmaceuticals Industry
- Feed Industry
- Cosmetics Industry
- Dietary Supplements Industry
- Others
-
By Region :
- North America
- Latin America
- Western Europe
- Eastern Europe
- East Asia
- South Asia & Pacific
- Middle East & Africa
Table of Content
- Executive Summary
- Global Market Outlook
- Demand-side Trends
- Supply-side Trends
- Technology Roadmap Analysis
- Analysis and Recommendations
- Market Overview
- Market Coverage / Taxonomy
- Market Definition / Scope / Limitations
- Market Background
- Market Dynamics
- Drivers
- Restraints
- Opportunity
- Trends
- Scenario Forecast
- Demand in Optimistic Scenario
- Demand in Likely Scenario
- Demand in Conservative Scenario
- Opportunity Map Analysis
- Product Life Cycle Analysis
- Supply Chain Analysis
- Supply Side Participants and their Roles
- Producers
- Mid-Level Participants (Traders/ Agents/ Brokers)
- Wholesalers and Distributors
- Value Added and Value Created at Node in the Supply Chain
- List of Raw Material Suppliers
- List of Existing and Potential Buyers
- Supply Side Participants and their Roles
- Investment Feasibility Matrix
- Value Chain Analysis
- Profit Margin Analysis
- Wholesalers and Distributors
- Retailers
- PESTLE and Porter’s Analysis
- Regulatory Landscape
- By Key Regions
- By Key Countries
- Production and Consumption Statistics
- Import and Export Statistics
- Market Dynamics
- Global Glycine Market Analysis 2020 to 2035 and Forecast, 2025 to 2035
- Historical Market Size Value (USD Mn) & Volume (Tons) Analysis, 2020 to 2035
- Current and Future Market Size Value (USD Mn) & Volume (Tons) Projections, 2025 to 2035
- Y-o-Y Growth Trend Analysis
- Absolute $ Opportunity Analysis
- Global Glycine Market Pricing Analysis 2020 to 2035 and Forecast 2025 to 2035
- Global Glycine Market Analysis 2020 to 2035 and Forecast 2025 to 2035, By Grade Type
- Introduction / Key Findings
- Historical Market Size Value (USD Mn) & Volume (Tons) Analysis By Grade Type, 2020 to 2035
- Current and Future Market Size Value (USD Mn) & Volume (Tons) Analysis and Forecast By Grade Type, 2025 to 2035
- Food Grade
- Technical Grade
- Pharma Grade
- Y-o-Y Growth Trend Analysis By Grade Type, 2020 to 2035
- Absolute $ Opportunity Analysis By Grade Type, 2025 to 2035
- Global Glycine Market Analysis 2020 to 2035 and Forecast 2025 to 2035, By Production Method
- Introduction / Key Findings
- Historical Market Size Value (USD Mn) & Volume (Tons) Analysis By Production Method, 2020 to 2035
- Current and Future Market Size Value (USD Mn) & Volume (Tons) Analysis and Forecast By Production Method, 2025 to 2035
- Strecker Synthesis Process
- Ammonia and Chloroacetic Acid Process
- Electrochemical Synthesis
- Others
- Y-o-Y Growth Trend Analysis By Production Method, 2020 to 2035
- Absolute $ Opportunity Analysis By Production Method, 2025 to 2035
- Global Glycine Market Analysis 2020 to 2035 and Forecast 2025 to 2035, By End Use
- Introduction / Key Findings
- Historical Market Size Value (USD Mn) & Volume (Tons) Analysis By End Use, 2020 to 2035
- Current and Future Market Size Value (USD Mn) & Volume (Tons) Analysis and Forecast By End Use, 2025 to 2035
- Food & Beverage Industry
- Pesticides Industry
- Pharmaceuticals Industry
- Feed Industry
- Cosmetics Industry
- Dietary Supplements Industry
- Others
- Y-o-Y Growth Trend Analysis By End Use, 2020 to 2035
- Absolute $ Opportunity Analysis By End Use, 2025 to 2035
- Global Glycine Market Analysis 2020 to 2035 and Forecast 2025 to 2035, By Region
- Introduction
- Historical Market Size Value (USD Mn) & Volume (Tons) Analysis By Region, 2020 to 2035
- Current Market Size Value (USD Mn) & Volume (Tons) Analysis and Forecast By Region, 2025 to 2035
- North America
- Latin America
- Western Europe
- East Asia
- South Asia Pacific
- Eastern Europe
- Middle East & Africa
- Market Attractiveness Analysis By Region
- North America Global Glycine Market Analysis 2020 to 2035 and Forecast 2025 to 2035, By Country
- Historical Market Size Value (USD Mn) & Volume (Tons) Trend Analysis By Market Taxonomy, 2020 to 2035
- Market Size Value (USD Mn) & Volume (Tons) Forecast By Market Taxonomy, 2025 to 2035
- By Country
- U.S.
- Canada
- Mexico
- By Grade Type
- By Production Method
- By End Use
- By Country
- Market Attractiveness Analysis
- By Country
- By Grade Type
- By Production Method
- By End Use
- Key Takeaways
- Latin America Global Glycine Market Analysis 2020 to 2035 and Forecast 2025 to 2035, By Country
- Historical Market Size Value (USD Mn) & Volume (Tons) Trend Analysis By Market Taxonomy, 2020 to 2035
- Market Size Value (USD Mn) & Volume (Tons) Forecast By Market Taxonomy, 2025 to 2035
- By Country
- Brazil
- Chile
- Rest of Latin America
- By Grade Type
- By Production Method
- By End Use
- By Country
- Market Attractiveness Analysis
- By Country
- By Grade Type
- By Production Method
- By End Use
- Key Takeaways
- Western Europe Global Glycine Market Analysis 2020 to 2035 and Forecast 2025 to 2035, By Country
- Historical Market Size Value (USD Mn) & Volume (Tons) Trend Analysis By Market Taxonomy, 2020 to 2035
- Market Size Value (USD Mn) & Volume (Tons) Forecast By Market Taxonomy, 2025 to 2035
- By Country
- Germany
- Italy
- France
- U.K.
- Spain
- Russia
- BENELUX
- Rest of Europe
- By Grade Type
- By Production Method
- By End Use
- By Country
- Market Attractiveness Analysis
- By Country
- By Grade Type
- By Production Method
- By End Use
- Key Takeaways
- East Asia Global Glycine Market Analysis 2020 to 2035 and Forecast 2025 to 2035, By Country
- Historical Market Size Value (USD Mn) & Volume (Tons) Trend Analysis By Market Taxonomy, 2020 to 2035
- Market Size Value (USD Mn) & Volume (Tons) Forecast By Market Taxonomy, 2025 to 2035
- By Country
- China
- Japan
- South Korea
- By Grade Type
- By Production Method
- By End Use
- By Country
- Market Attractiveness Analysis
- By Country
- By Grade Type
- By Production Method
- By End Use
- Key Takeaways
- South Asia Pacific Global Glycine Market Analysis 2020 to 2035 and Forecast 2025 to 2035, By Country
- Historical Market Size Value (USD Mn) & Volume (Tons) Trend Analysis By Market Taxonomy, 2020 to 2035
- Market Size Value (USD Mn) & Volume (Tons) Forecast By Market Taxonomy, 2025 to 2035
- By Country
- India
- ASEAN Countries
- Australia & New Zealand
- Rest of South Asia Pacific
- By Grade Type
- By Production Method
- By End Use
- By Country
- Market Attractiveness Analysis
- By Country
- By Grade Type
- By Production Method
- By End Use
- Key Takeaways
- Eastern Europe Global Glycine Market Analysis 2020 to 2035 and Forecast 2025 to 2035, By Country
- Historical Market Size Value (USD Mn) & Volume (Tons) Trend Analysis By Market Taxonomy, 2020 to 2035
- Market Size Value (USD Mn) & Volume (Tons) Forecast By Market Taxonomy, 2025 to 2035
- By Country
- Russia
- Poland
- Hungary
- Balkan & Baltics
- Rest of Eastern Europe
- By Grade Type
- By Production Method
- By End Use
- By Country
- Market Attractiveness Analysis
- By Country
- By Grade Type
- By Production Method
- By End Use
- Key Takeaways
- Middle East & Africa Global Glycine Market Analysis 2020 to 2035 and Forecast 2025 to 2035, By Country
- Historical Market Size Value (USD Mn) & Volume (Tons) Trend Analysis By Market Taxonomy, 2020 to 2035
- Market Size Value (USD Mn) & Volume (Tons) Forecast By Market Taxonomy, 2025 to 2035
- By Country
- KSA
- Other GCC Countries
- Turkiye
- South Africa
- Rest of MEA
- By Grade Type
- By Production Method
- By End Use
- By Country
- Market Attractiveness Analysis
- By Country
- By Grade Type
- By Production Method
- By End Use
- Key Takeaways
- Key Countries Global Glycine Market Analysis
- U.S.
- Pricing Analysis
- Market Share Analysis, 2024
- By Grade Type
- By Production Method
- By End Use
- China
- Pricing Analysis
- Market Share Analysis, 2024
- By Grade Type
- By Production Method
- By End Use
- India
- Pricing Analysis
- Market Share Analysis, 2024
- By Grade Type
- By Production Method
- By End Use
- U.S.
- Market Structure Analysis
- Competition Dashboard
- Competition Benchmarking
- Market Share Analysis of Top Players
- By Regional
- By Grade Type
- By Production Method
- By End Use
- Competition Analysis
- Competition Deep Dive
- Ajinomoto
- Overview
- Product Portfolio
- Profitability by Market Segments (Product/Age /Sales Channel/Region)
- Sales Footprint
- Strategy Overview
- Marketing Strategy
- Product Strategy
- Channel Strategy
- Chattem Chemicals
- Overview
- Product Portfolio
- Profitability by Market Segments (Product/Age /Sales Channel/Region)
- Sales Footprint
- Strategy Overview
- Marketing Strategy
- Product Strategy
- Channel Strategy
- Evonik
- Overview
- Product Portfolio
- Profitability by Market Segments (Product/Age /Sales Channel/Region)
- Sales Footprint
- Strategy Overview
- Marketing Strategy
- Product Strategy
- Channel Strategy
- GEO Specialty Chemicals
- Overview
- Product Portfolio
- Profitability by Market Segments (Product/Age /Sales Channel/Region)
- Sales Footprint
- Strategy Overview
- Marketing Strategy
- Product Strategy
- Channel Strategy
- Guangrong Chemical
- Overview
- Product Portfolio
- Profitability by Market Segments (Product/Age /Sales Channel/Region)
- Sales Footprint
- Strategy Overview
- Marketing Strategy
- Product Strategy
- Channel Strategy
- Hebei Donghua Jiheng Chemical
- Overview
- Product Portfolio
- Profitability by Market Segments (Product/Age /Sales Channel/Region)
- Sales Footprint
- Strategy Overview
- Marketing Strategy
- Product Strategy
- Channel Strategy
- Hubei Xingfa Chemicals Group
- Overview
- Product Portfolio
- Profitability by Market Segments (Product/Age /Sales Channel/Region)
- Sales Footprint
- Strategy Overview
- Marketing Strategy
- Product Strategy
- Channel Strategy
- Linxi Hongtai
- Overview
- Product Portfolio
- Profitability by Market Segments (Product/Age /Sales Channel/Region)
- Sales Footprint
- Strategy Overview
- Marketing Strategy
- Product Strategy
- Channel Strategy
- Paras Intermediates Private Limited
- Overview
- Product Portfolio
- Profitability by Market Segments (Product/Age /Sales Channel/Region)
- Sales Footprint
- Strategy Overview
- Marketing Strategy
- Product Strategy
- Channel Strategy
- Shijiazhuang Donghua Jinlong Chemical
- Overview
- Product Portfolio
- Profitability by Market Segments (Product/Age /Sales Channel/Region)
- Sales Footprint
- Strategy Overview
- Marketing Strategy
- Product Strategy
- Channel Strategy
- Showa Denko KK
- Overview
- Product Portfolio
- Profitability by Market Segments (Product/Age /Sales Channel/Region)
- Sales Footprint
- Strategy Overview
- Marketing Strategy
- Product Strategy
- Channel Strategy
- Yuki Gosei Kogyo
- Overview
- Product Portfolio
- Profitability by Market Segments (Product/Age /Sales Channel/Region)
- Sales Footprint
- Strategy Overview
- Marketing Strategy
- Product Strategy
- Channel Strategy
- Zhenxing Chemical
- Overview
- Product Portfolio
- Profitability by Market Segments (Product/Age /Sales Channel/Region)
- Sales Footprint
- Strategy Overview
- Marketing Strategy
- Product Strategy
- Channel Strategy
- Other Market Players
- Overview
- Product Portfolio
- Profitability by Market Segments (Product/Age /Sales Channel/Region)
- Sales Footprint
- Strategy Overview
- Marketing Strategy
- Product Strategy
- Channel Strategy
- Ajinomoto
- Competition Deep Dive
- Assumptions & Acronyms Used
- Research Methodology
List Of Table
- Table 1: Global Market Value (USD Mn) Forecast by Region, 2020 to 2035
- Table 2: Global Market Volume (Tons) Forecast by Region, 2020 to 2035
- Table 3: Global Market Value (USD Mn) Forecast by Grade Type, 2020 to 2035
- Table 4: Global Market Volume (Tons) Forecast by Grade Type, 2020 to 2035
- Table 5: Global Market Value (USD Mn) Forecast by Production Method, 2020 to 2035
- Table 6: Global Market Volume (Tons) Forecast by Production Method, 2020 to 2035
- Table 7: Global Market Value (USD Mn) Forecast by End Use, 2020 to 2035
- Table 8: Global Market Volume (Tons) Forecast by End Use, 2020 to 2035
- Table 9: North America Global Market Value (USD Mn) Forecast by Country, 2020 to 2035
- Table 10: North America Global Market Volume (Tons) Forecast by Country, 2020 to 2035
- Table 11: North America Global Market Value (USD Mn) Forecast by Grade Type, 2020 to 2035
- Table 12: North America Global Market Volume (Tons) Forecast by Grade Type, 2020 to 2035
- Table 13: North America Global Market Value (USD Mn) Forecast by Production Method, 2020 to 2035
- Table 14: North America Global Market Volume (Tons) Forecast by Production Method, 2020 to 2035
- Table 15: North America Global Market Value (USD Mn) Forecast by End Use, 2020 to 2035
- Table 16: North America Global Market Volume (Tons) Forecast by End Use, 2020 to 2035
- Table 17: Latin America Global Market Value (USD Mn) Forecast by Country, 2020 to 2035
- Table 18: Latin America Global Market Volume (Tons) Forecast by Country, 2020 to 2035
- Table 19: Latin America Global Market Value (USD Mn) Forecast by Grade Type, 2020 to 2035
- Table 20: Latin America Global Market Volume (Tons) Forecast by Grade Type, 2020 to 2035
- Table 21: Latin America Global Market Value (USD Mn) Forecast by Production Method, 2020 to 2035
- Table 22: Latin America Global Market Volume (Tons) Forecast by Production Method, 2020 to 2035
- Table 23: Latin America Global Market Value (USD Mn) Forecast by End Use, 2020 to 2035
- Table 24: Latin America Global Market Volume (Tons) Forecast by End Use, 2020 to 2035
- Table 25: Western Europe Global Market Value (USD Mn) Forecast by Country, 2020 to 2035
- Table 26: Western Europe Global Market Volume (Tons) Forecast by Country, 2020 to 2035
- Table 27: Western Europe Global Market Value (USD Mn) Forecast by Grade Type, 2020 to 2035
- Table 28: Western Europe Global Market Volume (Tons) Forecast by Grade Type, 2020 to 2035
- Table 29: Western Europe Global Market Value (USD Mn) Forecast by Production Method, 2020 to 2035
- Table 30: Western Europe Global Market Volume (Tons) Forecast by Production Method, 2020 to 2035
- Table 31: Western Europe Global Market Value (USD Mn) Forecast by End Use, 2020 to 2035
- Table 32: Western Europe Global Market Volume (Tons) Forecast by End Use, 2020 to 2035
- Table 33: East Asia Global Market Value (USD Mn) Forecast by Country, 2020 to 2035
- Table 34: East Asia Global Market Volume (Tons) Forecast by Country, 2020 to 2035
- Table 35: East Asia Global Market Value (USD Mn) Forecast by Grade Type, 2020 to 2035
- Table 36: East Asia Global Market Volume (Tons) Forecast by Grade Type, 2020 to 2035
- Table 37: East Asia Global Market Value (USD Mn) Forecast by Production Method, 2020 to 2035
- Table 38: East Asia Global Market Volume (Tons) Forecast by Production Method, 2020 to 2035
- Table 39: East Asia Global Market Value (USD Mn) Forecast by End Use, 2020 to 2035
- Table 40: East Asia Global Market Volume (Tons) Forecast by End Use, 2020 to 2035
- Table 41: South Asia Pacific Global Market Value (USD Mn) Forecast by Country, 2020 to 2035
- Table 42: South Asia Pacific Global Market Volume (Tons) Forecast by Country, 2020 to 2035
- Table 43: South Asia Pacific Global Market Value (USD Mn) Forecast by Grade Type, 2020 to 2035
- Table 44: South Asia Pacific Global Market Volume (Tons) Forecast by Grade Type, 2020 to 2035
- Table 45: South Asia Pacific Global Market Value (USD Mn) Forecast by Production Method, 2020 to 2035
- Table 46: South Asia Pacific Global Market Volume (Tons) Forecast by Production Method, 2020 to 2035
- Table 47: South Asia Pacific Global Market Value (USD Mn) Forecast by End Use, 2020 to 2035
- Table 48: South Asia Pacific Global Market Volume (Tons) Forecast by End Use, 2020 to 2035
- Table 49: Eastern Europe Global Market Value (USD Mn) Forecast by Country, 2020 to 2035
- Table 50: Eastern Europe Global Market Volume (Tons) Forecast by Country, 2020 to 2035
- Table 51: Eastern Europe Global Market Value (USD Mn) Forecast by Grade Type, 2020 to 2035
- Table 52: Eastern Europe Global Market Volume (Tons) Forecast by Grade Type, 2020 to 2035
- Table 53: Eastern Europe Global Market Value (USD Mn) Forecast by Production Method, 2020 to 2035
- Table 54: Eastern Europe Global Market Volume (Tons) Forecast by Production Method, 2020 to 2035
- Table 55: Eastern Europe Global Market Value (USD Mn) Forecast by End Use, 2020 to 2035
- Table 56: Eastern Europe Global Market Volume (Tons) Forecast by End Use, 2020 to 2035
- Table 57: Middle East & Africa Global Market Value (USD Mn) Forecast by Country, 2020 to 2035
- Table 58: Middle East & Africa Global Market Volume (Tons) Forecast by Country, 2020 to 2035
- Table 59: Middle East & Africa Global Market Value (USD Mn) Forecast by Grade Type, 2020 to 2035
- Table 60: Middle East & Africa Global Market Volume (Tons) Forecast by Grade Type, 2020 to 2035
- Table 61: Middle East & Africa Global Market Value (USD Mn) Forecast by Production Method, 2020 to 2035
- Table 62: Middle East & Africa Global Market Volume (Tons) Forecast by Production Method, 2020 to 2035
- Table 63: Middle East & Africa Global Market Value (USD Mn) Forecast by End Use, 2020 to 2035
- Table 64: Middle East & Africa Global Market Volume (Tons) Forecast by End Use, 2020 to 2035
List Of Figures
- Figure 1: Global Market Volume (Tons) Forecast 2020–2035
- Figure 2: Global Market Pricing Analysis
- Figure 3: Global Market Value (USD Mn) Forecast 2020–2035
- Figure 4: Global Market Value Share and BPS Analysis by Grade Type, 2025 and 2035
- Figure 5: Global Market Y-o-Y Growth Comparison by Grade Type, 2025 to 2035
- Figure 6: Global Market Attractiveness Analysis by Grade Type
- Figure 7: Global Market Value Share and BPS Analysis by Production Method, 2025 and 2035
- Figure 8: Global Market Y-o-Y Growth Comparison by Production Method, 2025 to 2035
- Figure 9: Global Market Attractiveness Analysis by Production Method
- Figure 10: Global Market Value Share and BPS Analysis by End Use, 2025 and 2035
- Figure 11: Global Market Y-o-Y Growth Comparison by End Use, 2025 to 2035
- Figure 12: Global Market Attractiveness Analysis by End Use
- Figure 13: Global Market Value (USD Mn) Share and BPS Analysis by Region, 2025 and 2035
- Figure 14: Global Market Y-o-Y Growth Comparison by Region, 2025 to 2035
- Figure 15: Global Market Attractiveness Analysis by Region
- Figure 16: North America Global Market Incremental $ Opportunity, 2025 to 2035
- Figure 17: Latin America Global Market Incremental $ Opportunity, 2025 to 2035
- Figure 18: Western Europe Global Market Incremental $ Opportunity, 2025 to 2035
- Figure 19: East Asia Global Market Incremental $ Opportunity, 2025 to 2035
- Figure 20: South Asia Pacific Global Market Incremental $ Opportunity, 2025 to 2035
- Figure 21: Eastern Europe Global Market Incremental $ Opportunity, 2025 to 2035
- Figure 22: Middle East & Africa Global Market Incremental $ Opportunity, 2025 to 2035
- Figure 23: North America Global Market Value Share and BPS Analysis by Country, 2025 and 2035
- Figure 24: North America Global Market Value Share and BPS Analysis by Grade Type, 2025 and 2035
- Figure 25: North America Global Market Y-o-Y Growth Comparison by Grade Type, 2025 to 2035
- Figure 26: North America Global Market Attractiveness Analysis by Grade Type
- Figure 27: North America Global Market Value Share and BPS Analysis by Production Method, 2025 and 2035
- Figure 28: North America Global Market Y-o-Y Growth Comparison by Production Method, 2025 to 2035
- Figure 29: North America Global Market Attractiveness Analysis by Production Method
- Figure 30: North America Global Market Value Share and BPS Analysis by End Use, 2025 and 2035
- Figure 31: North America Global Market Y-o-Y Growth Comparison by End Use, 2025 to 2035
- Figure 32: North America Global Market Attractiveness Analysis by End Use
- Figure 33: Latin America Global Market Value Share and BPS Analysis by Country, 2025 and 2035
- Figure 34: Latin America Global Market Value Share and BPS Analysis by Grade Type, 2025 and 2035
- Figure 35: Latin America Global Market Y-o-Y Growth Comparison by Grade Type, 2025 to 2035
- Figure 36: Latin America Global Market Attractiveness Analysis by Grade Type
- Figure 37: Latin America Global Market Value Share and BPS Analysis by Production Method, 2025 and 2035
- Figure 38: Latin America Global Market Y-o-Y Growth Comparison by Production Method, 2025 to 2035
- Figure 39: Latin America Global Market Attractiveness Analysis by Production Method
- Figure 40: Latin America Global Market Value Share and BPS Analysis by End Use, 2025 and 2035
- Figure 41: Latin America Global Market Y-o-Y Growth Comparison by End Use, 2025 to 2035
- Figure 42: Latin America Global Market Attractiveness Analysis by End Use
- Figure 43: Western Europe Global Market Value Share and BPS Analysis by Country, 2025 and 2035
- Figure 44: Western Europe Global Market Value Share and BPS Analysis by Grade Type, 2025 and 2035
- Figure 45: Western Europe Global Market Y-o-Y Growth Comparison by Grade Type, 2025 to 2035
- Figure 46: Western Europe Global Market Attractiveness Analysis by Grade Type
- Figure 47: Western Europe Global Market Value Share and BPS Analysis by Production Method, 2025 and 2035
- Figure 48: Western Europe Global Market Y-o-Y Growth Comparison by Production Method, 2025 to 2035
- Figure 49: Western Europe Global Market Attractiveness Analysis by Production Method
- Figure 50: Western Europe Global Market Value Share and BPS Analysis by End Use, 2025 and 2035
- Figure 51: Western Europe Global Market Y-o-Y Growth Comparison by End Use, 2025 to 2035
- Figure 52: Western Europe Global Market Attractiveness Analysis by End Use
- Figure 53: East Asia Global Market Value Share and BPS Analysis by Country, 2025 and 2035
- Figure 54: East Asia Global Market Value Share and BPS Analysis by Grade Type, 2025 and 2035
- Figure 55: East Asia Global Market Y-o-Y Growth Comparison by Grade Type, 2025 to 2035
- Figure 56: East Asia Global Market Attractiveness Analysis by Grade Type
- Figure 57: East Asia Global Market Value Share and BPS Analysis by Production Method, 2025 and 2035
- Figure 58: East Asia Global Market Y-o-Y Growth Comparison by Production Method, 2025 to 2035
- Figure 59: East Asia Global Market Attractiveness Analysis by Production Method
- Figure 60: East Asia Global Market Value Share and BPS Analysis by End Use, 2025 and 2035
- Figure 61: East Asia Global Market Y-o-Y Growth Comparison by End Use, 2025 to 2035
- Figure 62: East Asia Global Market Attractiveness Analysis by End Use
- Figure 63: South Asia Pacific Global Market Value Share and BPS Analysis by Country, 2025 and 2035
- Figure 64: South Asia Pacific Global Market Value Share and BPS Analysis by Grade Type, 2025 and 2035
- Figure 65: South Asia Pacific Global Market Y-o-Y Growth Comparison by Grade Type, 2025 to 2035
- Figure 66: South Asia Pacific Global Market Attractiveness Analysis by Grade Type
- Figure 67: South Asia Pacific Global Market Value Share and BPS Analysis by Production Method, 2025 and 2035
- Figure 68: South Asia Pacific Global Market Y-o-Y Growth Comparison by Production Method, 2025 to 2035
- Figure 69: South Asia Pacific Global Market Attractiveness Analysis by Production Method
- Figure 70: South Asia Pacific Global Market Value Share and BPS Analysis by End Use, 2025 and 2035
- Figure 71: South Asia Pacific Global Market Y-o-Y Growth Comparison by End Use, 2025 to 2035
- Figure 72: South Asia Pacific Global Market Attractiveness Analysis by End Use
- Figure 73: Eastern Europe Global Market Value Share and BPS Analysis by Country, 2025 and 2035
- Figure 74: Eastern Europe Global Market Value Share and BPS Analysis by Grade Type, 2025 and 2035
- Figure 75: Eastern Europe Global Market Y-o-Y Growth Comparison by Grade Type, 2025 to 2035
- Figure 76: Eastern Europe Global Market Attractiveness Analysis by Grade Type
- Figure 77: Eastern Europe Global Market Value Share and BPS Analysis by Production Method, 2025 and 2035
- Figure 78: Eastern Europe Global Market Y-o-Y Growth Comparison by Production Method, 2025 to 2035
- Figure 79: Eastern Europe Global Market Attractiveness Analysis by Production Method
- Figure 80: Eastern Europe Global Market Value Share and BPS Analysis by End Use, 2025 and 2035
- Figure 81: Eastern Europe Global Market Y-o-Y Growth Comparison by End Use, 2025 to 2035
- Figure 82: Eastern Europe Global Market Attractiveness Analysis by End Use
- Figure 83: Middle East & Africa Global Market Y-o-Y Growth Comparison by Grade Type, 2025 to 2035
- Figure 84: Middle East & Africa Global Market Attractiveness Analysis by Grade Type
- Figure 85: Middle East & Africa Global Market Value Share and BPS Analysis by Production Method, 2025 and 2035
- Figure 86: Middle East & Africa Global Market Y-o-Y Growth Comparison by Production Method, 2025 to 2035
- Figure 87: Middle East & Africa Global Market Attractiveness Analysis by Production Method
- Figure 88: Middle East & Africa Global Market Value Share and BPS Analysis by End Use, 2025 and 2035
- Figure 89: Middle East & Africa Global Market Y-o-Y Growth Comparison by End Use, 2025 to 2035
- Figure 90: Middle East & Africa Global Market Attractiveness Analysis by End Use
- Figure 91: Global Market - Tier Structure Analysis
- Figure 92: Global Market - Company Share Analysis
- FAQs -
What was the Global Glycine Market Size Reported by Fact.MR for 2025?
The global glycine market was valued at USD 1,450 million in 2025.
Who are the Major Players Operating in the Glycine Market?
Prominent players in the market are Ajinomoto, Chattem Chemicals, Evonik, GEO Specialty Chemicals, among others.
What is the Estimated Valuation of the Glycine Market in 2035?
The market is expected to reach a valuation of USD 2,825.8 million in 2035.
What Value CAGR did the Glycine Market Exhibit Over the Last Five Years?
The historic growth rate of the glycine market was 6.1% from 2020-2024.