- Market Value (2025): USD 289.3 Mn
- Estimated Value (2026): USD 322 Mn
- Forecast Value (2036): USD 940 Mn
- CAGR (2026-2036): 11.3%
What is the LNG Bunkering Transfer Interfaces Market forecast to be worth by 2036?
USD 322 million in 2026 to USD 940 million by 2036, at 11.3% CAGR.
- The market stood at roughly USD 289.3 million in 2025 as bunkering volumes set records at hub ports and new bunkering locations commissioned their first transfer equipment.
- Revenue is projected to rise from USD 322.0 million in 2026 to USD 940.0 million by 2036 as the LNG-fuelled fleet grows, bunkering spreads to more ports, and interface equipment is standardized and replaced on documented cycles.
- An 11.3% CAGR from 2026 to 2036 is supported by vessel deliveries, port standard-setting such as Singapore’s 2026 program, and regulatory frameworks that require certified transfer systems at every bunkering point.
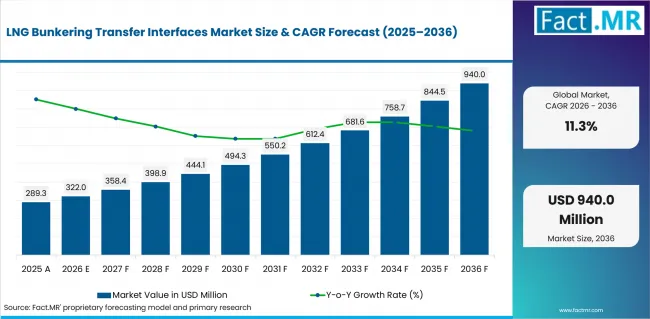
Lng Bunkering Transfer Interfaces Market Value Analysis | Source: Fact.MR
What are the defining numbers behind LNG Bunkering Transfer Interfaces Market growth?
USD 618 million absolute opportunity by 2036, led by Bunkering manifolds and Ship-to-ship mode within their respective segments.
- Demand Drivers in the Market
- The Maritime and Port Authority of Singapore reports LNG bunker sales up 23.1% to 5,71,400 tonnes in 2025, opened applications for new LNG bunker supply licences in January 2026, and is upgrading its Technical Reference for LNG Bunkering, TR56, into a full Singapore Standard in 2026, all of which formalizes transfer interface requirements at the world’s largest bunkering hub.
- The European Environment Agency counts 67 ports in the EU-27 with LNG bunkering capacity, 45 on the TEN-T core network, built under AFIR’s mandate for liquefied methane refuelling points, and each port’s bunkering operation runs on certified interface equipment.
- ISO 20519:2021, now in its second edition, specifies requirements for LNG bunkering transfer systems and equipment, covering liquid and vapor transfer hardware, procedures, delivery notes, training and facility standards, giving ports and suppliers a single reference to engineer against.
- The International Institute of Refrigeration, citing DNV, records 638 LNG-fuelled ships in operation and 188 LNG orders in 2025 representing 31% of alternative-fuel gross tonnage ordered, a fleet pipeline that converts directly into future bunkering events.
- The ABS Guide for LNG Bunkering requires dry-break emergency release couplings or breakaways on delivery systems, operable after blackout and under ice formation, embedding certified emergency release interfaces in every compliant operation.
- Key Segments Analyzed
- By Interface Type: Bunkering manifolds lead at 36.0% of 2026 demand because the manifold is the fixed meeting point where supply and receiving sides negotiate flange standards, spacing and safety device integration, and every bunkering vessel, terminal and receiving ship owns at least one engineered manifold arrangement.
- By Bunkering Mode: Ship-to-ship transfer holds 39.0% of demand as the dominant mode at major hubs, since dedicated bunker vessels deliver fuel alongside receiving ships at berth or anchorage, while shore-to-ship at 30.0% grows as fixed terminal infrastructure spreads beyond the pioneer ports.
- By Standard/Class: ISO 20519-compliant systems account for 41.0% of demand because ports and suppliers converge on the international standard for new equipment, while SIGTTO-guided arrangements at 38.0% remain deeply embedded in the gas carrier and terminal culture that bunkering inherited.
- By Vessel Type: Container ships, cruise and ferry vessels, bulk carriers, tankers, and offshore vessels require different transfer interfaces because their fuel capacity and operational profiles differ.
- By End User: Bunkering operators hold 44.0% of end user demand because they own and operate the delivery-side transfer systems, from bunker vessel manifolds to hoses and emergency release equipment, making them the market’s primary equipment buyers.
- Analyst Opinion at Fact.MR
- Shambhu Nath Jha, Sr. Consultant at Fact.MR, states, “Bunkering is a compatibility business. The receiving ship arrives with its manifold, its flange standard, its vapor return arrangement, and the supply side has to match it safely, quickly, and with paperwork that survives audit. That is why the market is consolidating around ISO 20519 packages and suppliers with real port references. The era of engineering every transfer interface from a blank sheet is ending.”
- Strategic Implications
- Port authorities developing bunkering should mandate ISO 20519 compliance in licence conditions, since standardization is what turns occasional transfers into a utility service.
- Bunkering operators gain from interface packages pre-approved by the major classification societies, which shorten vessel clearance and receiving-ship vetting.
- Suppliers can differentiate on vapor return interfaces, an underserved segment where receiving-ship compatibility problems concentrate.
- Shipowners ordering LNG-fuelled tonnage should specify manifold and connection standards early, because retrofitting interface geometry after delivery is expensive.
Trelleborg’s marine systems business supplies LNG bunkering hoses and transfer interfaces engineered for ship-to-ship service, including cryogenic hose assemblies with integrated safety systems. The migration of its offshore transfer heritage into bunkering illustrates how interface engineering is converging on standardized, type-approved packages.
Singapore is positioned for 12.4% annual growth from 2026 to 2036 as it formalizes its multi-fuel bunkering future. The Netherlands is projected to grow at 11.8% on Rotterdam’s established LNG bunkering operations. Japan advances at 11.2% on government-supported bunkering bases, and South Korea records 10.9% on its gas-fuelled fleet and shipbuilding ecosystem.
How does the LNG Bunkering Transfer Interfaces Market break down by segment?
The leading shares are Bunkering manifolds at 36.0% by Interface Type and Ship-to-ship at 39.0% by Bunkering Mode.
Why do bunkering manifolds lead the interface mix?
At 36.0% share in 2026, bunkering manifolds lead because every transfer requires an engineered meeting point on both the supply and receiving sides.
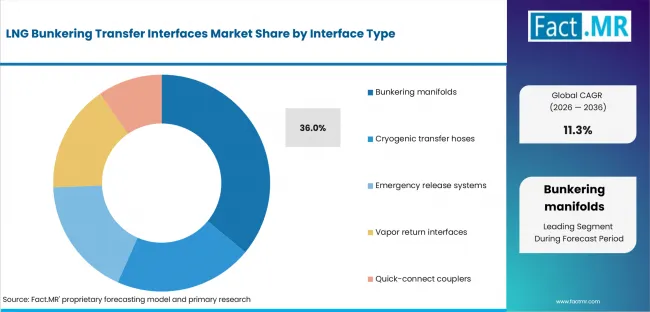
Lng Bunkering Transfer Interfaces Market Analysis By Interface Type | Source: Fact.MR
Bunkering manifolds account for 36.0% of demand because the manifold integrates flanges, isolation valves, instrumentation connections and drip and purging arrangements into one engineered assembly, and both bunker vessels and receiving ships carry them. Cryogenic transfer hoses provide the flexible connection, emergency-release systems protect against separation events, vapor-return interfaces manage boil-off gas, and quick-connect couplers support repeatable connection and disconnection.
Why does ship-to-ship lead the bunkering modes?
A 39.0% share puts ship-to-ship first in 2026 because dedicated bunker vessels offer the flexibility that hub ports with diverse receiving tonnage require.
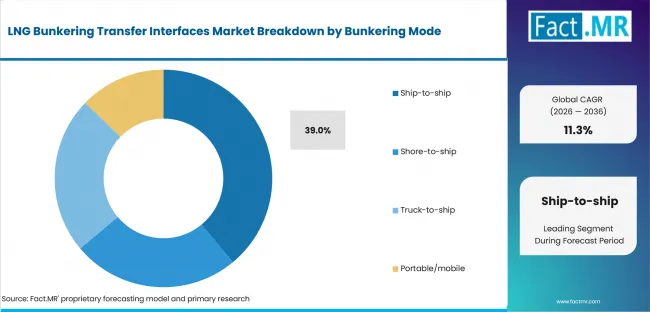
Lng Bunkering Transfer Interfaces Market Analysis By Bunkering Mode | Source: Fact.MR
Ship-to-ship transfer represents 39.0% of demand because a bunker vessel can serve a container ship at one berth and a cruise ship at another on the same tide, carrying its own hoses, manifolds and emergency release equipment to the receiving ship’s side. Shore-to-ship systems suit fixed port infrastructure, truck-to-ship transfer supports early-stage and lower-volume locations, and portable or mobile arrangements serve flexible deployment needs.
Why does ISO 20519 compliance lead the standard segment?
The 2026 leader is ISO 20519-compliant systems at 41.0% share because new bunkering programs default to the international standard’s hardware and procedural framework.
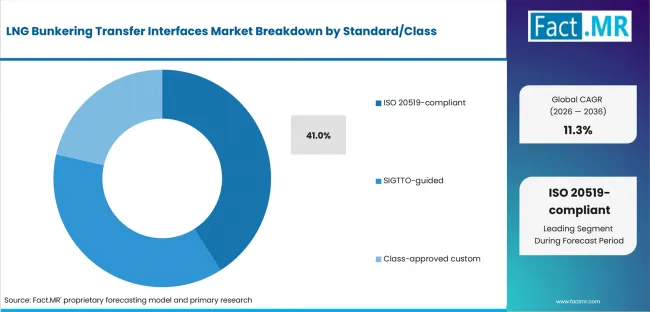
Lng Bunkering Transfer Interfaces Market Analysis By Standard Class | Source: Fact.MR
ISO 20519-compliant systems account for 41.0% of demand because the standard’s second edition gives ports, suppliers and receiving ships a common specification for transfer hardware, procedures and training, and port licensing regimes increasingly reference it directly or through national standards like Singapore’s TR56 upgrade. SIGTTO-guided arrangements remain relevant where established gas-industry ship-shore operating practice shapes the transfer design, while class-approved custom systems address port or vessel requirements outside standard packages.
How does vessel type shape LNG bunkering interface demand?
Interface selection follows the vessel's tank arrangement, bunkering frequency, and operating profile.
Container ships need transfer systems that support scheduled calls at large hubs. Cruise and ferry vessels prioritize repeatable port-side operations. Bulk carriers and tankers use equipment sized for their fuel capacity, while offshore vessels need interfaces that operate reliably in more demanding transfer conditions.
Why do bunkering operators lead the end user group?
The leading 2026 share is 44.0% for bunkering operators because they own the delivery-side transfer systems where most interface value sits.
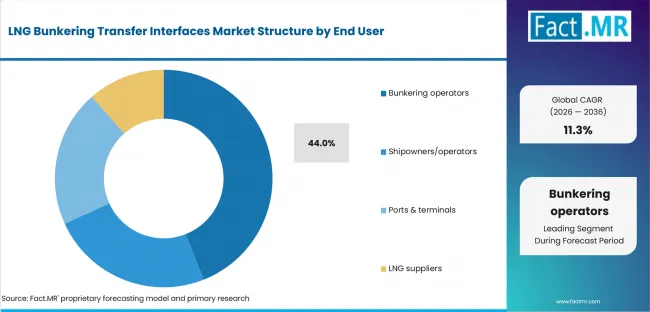
Lng Bunkering Transfer Interfaces Market Analysis By End User | Source: Fact.MR
Bunkering operators represent 44.0% of demand as the bunker vessel or terminal side carries the hoses, manifolds, emergency release systems and vapor handling equipment that make transfers possible, and operators buy and maintain this equipment across their fleets. Shipowners and operators specify compatible receiving-side equipment, ports and terminals procure infrastructure for their transfer operations, and LNG suppliers support delivery-side interface requirements.
What is accelerating LNG Bunkering Transfer Interfaces Market adoption, and what is holding it back?
The principal accelerator is the growth of the LNG-fuelled fleet and the formalization of bunkering at hub ports under standards and licensing regimes. Adoption is slowed by receiving-fleet ordering uncertainty, methane slip scrutiny of LNG as a fuel, and the capital cost of bunker vessels and fixed infrastructure.
Drivers Impact Analysis
| DRIVER | (~) % IMPACT ON CAGR | GEOGRAPHIC RELEVANCE | IMPACT TIMELINE |
|---|---|---|---|
| LNG-fuelled fleet deliveries | +1.8% | Global hub ports | Medium term (2-4 years) |
| Port standard-setting | +1.5% | Singapore, Northwest Europe | Short term (<= 2 years) |
| AFIR and national mandates | +1.2% | European Union | Short term (<= 2 years) |
| New bunkering locations | +1.0% | Asia, Middle East, Americas | Long term (>= 4 years) |
| Interface replacement cycles | +0.7% | Established bunkering ports | Long term (>= 4 years) |
Source: Fact.MR analysis. Updated Jul 24, 2026
- LNG-fuelled fleet deliveries: With 638 LNG-fuelled ships operating and LNG accounting for 31% of alternative-fuel gross tonnage ordered in 2025 per DNV data cited by the International Institute of Refrigeration, deliveries through the late 2020s add receiving ships that hub ports must serve.
- Port standard-setting: Singapore’s 2026 program, new LNG bunker supply licences, standards for port limit bunker vessels, and the TR56 upgrade to a Singapore Standard, creates a template other ports follow, pulling standardized interface equipment into more locations.
- AFIR and national mandates: The EU’s AFIR requirement delivered 67 LNG-capable bunkering ports across the EU-27 per the European Environment Agency, and continued enforcement plus FuelEU Maritime compliance economics keep bunkering infrastructure investment active.
Opportunity Impact Analysis
| OPPORTUNITY | (~) % IMPACT ON CAGR | GEOGRAPHIC RELEVANCE | IMPACT TIMELINE |
|---|---|---|---|
| Vapor return interface packages | +0.6% | Hub ports | Medium term (2-4 years) |
| Standardized bunker vessel packages | +0.5% | Newbuild bunker vessels | Short term (<= 2 years) |
| Bio-LNG and e-methane readiness | +0.4% | Europe, Singapore | Long term (>= 4 years) |
| Second-wave port equipment | +0.4% | Mediterranean, Middle East, Americas | Long term (>= 4 years) |
Source: Fact.MR analysis. Updated Jul 24, 2026
- Vapor return interface packages: Receiving ships increasingly require vapor return connections to manage tank pressure during bunkering, and packaged vapor interfaces solve a compatibility problem that improvised arrangements handle badly.
- Standardized bunker vessel packages: New bunker vessels being built to Singapore’s forthcoming port limit standards and equivalent class notations will buy interface packages as specified assemblies, favoring suppliers with type-approved sets.
- Bio-LNG and e-methane readiness: Interface equipment that handles liquefied methane regardless of origin positions suppliers for the fuel’s renewable transition without hardware replacement.
Restraints Impact Analysis
| RESTRAINT | (~) % IMPACT ON CAGR | GEOGRAPHIC RELEVANCE | IMPACT TIMELINE |
|---|---|---|---|
| Alternative fuel ordering uncertainty | -0.6% | Global newbuild market | Medium term (2-4 years) |
| Methane slip scrutiny | -0.5% | European policy | Long term (>= 4 years) |
| Bunker vessel capital cost | -0.4% | New bunkering locations | Medium term (2-4 years) |
| Receiving ship compatibility gaps | -0.3% | Older LNG-fuelled tonnage | Short term (<= 2 years) |
Source: Fact.MR analysis. Updated Jul 24, 2026
- Alternative fuel ordering uncertainty: Alternative-fuel vessel orders fell 47% in 2025 per DNV data, and shipowners weighing methanol and ammonia against LNG create demand uncertainty that delays bunkering investment in some ports.
- Methane slip scrutiny: Policy analysis in Europe increasingly questions fossil LNG’s climate credentials, and any regulatory shift against liquefied methane infrastructure would slow interface demand in affected regions.
- Bunker vessel capital cost: A purpose-built LNG bunker vessel is a major investment, and its interface equipment competes for budget with the vessel itself, stretching procurement at new bunkering locations.
How do the leading LNG bunkering transfer interface markets compare?
Singapore 12.4% CAGR. Netherlands 11.8%. Japan 11.2%. South Korea 10.9%.
Regional analysis addresses Asia Pacific and Europe through country sections on Singapore, the Netherlands, Japan, and South Korea, with more than 30 countries treated in the complete report.
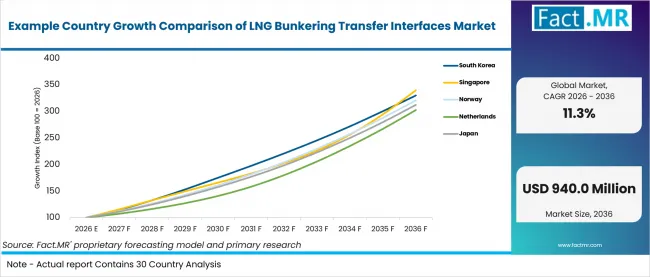
Example Country Growth Comparison Of Lng Bunkering Transfer Interfaces Market | Source: Fact.MR
| COUNTRY | CAGR |
|---|---|
| Singapore | 12.4% |
| Netherlands | 11.8% |
| Japan | 11.2% |
| South Korea | 10.9% |
Source: Fact.MR analysis. Updated Jul 24, 2026
Why Is Singapore Writing the Rulebook Its Interface Market Will Follow?
Singapore is the world’s largest bunkering hub, and its 2025 results show LNG bunkering becoming a serious business within it. The Maritime and Port Authority recorded total marine fuel sales of 56.77 million tonnes in 2025, with LNG sales up 23.1% to 571,400 tonnes. In January 2026, MPA opened applications for new LNG bunker supply licences to meet growing demand.
The standards work matters as much as the volumes. MPA is launching Standards for Port Limit LNG Bunker Vessels covering equipment and operational performance, and upgrading the existing Technical Reference for LNG Bunkering, TR56, into a full Singapore Standard in the second quarter of 2026. Standardized vessels and transfer requirements pull standardized manifolds, hoses and emergency release systems behind them. Singapore carries a 12.4% CAGR from 2026 to 2036.
Why Does Rotterdam’s Head Start Keep the Netherlands in Front?
Rotterdam built Europe’s first large-scale LNG bunkering operation and runs it as routine port business, with ship-to-ship transfers serving gas-fuelled callers across vessel types. The European Environment Agency counts 67 LNG-capable bunkering ports across the EU-27 under AFIR, and Dutch ports anchor that network’s operational maturity.
Dutch port authorities have used environmental fee differentiation to reward cleaner vessels for years, as documented in OECD and ITF analysis, reinforcing the demand side. The Netherlands’ interface market grows at an 11.8% CAGR from 2026 to 2036 on replacement cycles and fleet growth.
Why Does Japan Buy Bunkering Interfaces Through Policy Programs?
Japan’s government has subsidized LNG bunkering base establishment since fiscal 2018, as documented in OECD and ITF analysis, and Japanese ports including Yokohama have developed bunkering frameworks working through ship-shore legal competency questions with the Japan Coast Guard. The subsidized LNG-fuelled tug Sakigake has operated in Yokohama since 2015, an early proof of the domestic bunkering concept.
Japan’s energy security logic keeps LNG central, and its receiving terminals double as potential bunkering supply points. Japan’s demand grows at an 11.2% CAGR from 2026 to 2036.
Why Does South Korea’s Shipbuilding Ecosystem Pull Interface Demand?
South Korea builds a large share of the world’s LNG-fuelled vessels and LNG bunker vessels, and its ports, led by Busan, serve northeast Asian shipping where gas-fuelled tonnage is concentrated. The interface equipment fitted on Korean-built bunker vessels often comes from established international suppliers, keeping the specification bar high.
Domestic bunkering operations formalize as Korean-flag and foreign gas-fuelled callers increase. South Korea’s market grows at a 10.9% CAGR from 2026 to 2036.
Who leads the LNG Bunkering Transfer Interfaces Market?
Technip Energies Loading Systems, Trelleborg Gas Transfer (KLAW LNG and Gutteling ranges), MannTek, Dixon, Kanon Loading Equipment, and ARTA compete through type approval depth, hose and manifold engineering, and port references.
Competition is governed by type approval, ISO 20519 compatibility, hose and manifold engineering, and port-operating references. Trelleborg’s documented ship-to-ship cryogenic hose and interface offering, including KLAW LNG safety systems and Gutteling hose assemblies, illustrates this requirement; Technip Energies Loading Systems, MannTek, Dixon, Kanon Loading Equipment, and ARTA provide additional interface, coupling, and loading-arm alternatives.
Competitive differentiation centers on vapor-return packages, standardized bunker-vessel sets, and second-wave port installations.
Which companies are the key providers?
The company set includes Technip Energies Loading Systems, Trelleborg Gas Transfer (KLAW LNG and Gutteling ranges), MannTek, Dixon, Kanon Loading Equipment, and ARTA.
- Technip Energies Loading Systems
- Trelleborg Gas Transfer (KLAW LNG and Gutteling ranges)
- MannTek
- Dixon
- Kanon Loading Equipment
- ARTA
The named manufacturers, transfer-system brands, and coupling suppliers anchor the comparison, and the full report reviews more than 25 interface equipment suppliers and integrators.
Bibliography
- Maritime and Port Authority of Singapore. (2026). Singapore Posts Record Port Performance in 2025 and Develops Future Readiness for 2026.
- European Environment Agency. (2026). Sustainability of Europe’s mobility systems 2025: Energy infrastructure (LNG bunkering facilities in EU ports).
- International Organization for Standardization. (2021). ISO 20519:2021: Ships and marine technology, Specification for bunkering of liquefied natural gas fuelled vessels.
- American Bureau of Shipping. (2018). Guide for LNG Bunkering.
- International Institute of Refrigeration. (2026). LNG-fuelled ships continue to lead (data source: DNV).
- OECD / International Transport Forum. (2018). Fuelling Maritime Shipping with Liquefied Natural Gas.
Trelleborg Marine & Infrastructure. (n.d.). Gas Transfer: LNG Hoses for Bulk and Bunkering Transfer.
This Report Addresses
- The report quantifies the 2025 baseline and forecasts revenue from 2026 through 2036.
- It compares Singapore, the Netherlands, Japan, and South Korea, drawing on country coverage of 30+ markets.
- It evaluates Technip Energies Loading Systems, Trelleborg Gas Transfer (KLAW LNG and Gutteling ranges), MannTek, Dixon, Kanon Loading Equipment, and ARTA.
- It examines interface type, bunkering mode, standard class, vessel type, and end user choices.
- It separates ship-to-ship, shore-to-ship, truck-to-ship, and mobile bunkering demand.
- It tests the forecast against fleet deliveries, port standard-setting, regulatory mandates, and replacement cycles.
What does the LNG Bunkering Transfer Interfaces Market cover?
The study follows bunkering transfer hardware from port and vessel specification through daily transfer operations and replacement cycles.
Revenue includes manifolds, cryogenic hoses, emergency release systems, vapor return interfaces, quick-connect couplers, and associated control and safety components sold as interface equipment. Complete bunker vessels and terminal structures are excluded.
Demand is segmented by interface type, bunkering mode, standard class, vessel type, and end user. Country estimates reflect bunkering volumes, fleet composition, port licensing regimes, and equipment standardization.
What is included in the scope?
Included systems connect LNG supply to receiving vessels for marine fuel transfer.
Bunkering manifolds, transfer hoses, emergency release systems, vapor return interfaces and quick-connect couplers are counted across ship-to-ship, shore-to-ship, truck-to-ship and mobile modes, and across ISO, SIGTTO and class-approved specifications. Testing and recertification billed by the equipment supplier is covered.
What is excluded from the scope?
Bunker vessels, receiving ship fuel systems, and cargo transfer equipment are not included.
The study excludes bunker vessel construction, onboard LNG fuel gas supply systems, cargo loading arms and cargo transfer couplings, terminal storage tanks, and port civil works.
How was the analysis built?
Port statistics, fleet data, operator interviews, and forecast cross-checks referencing more than 30 countries.
- Primary Research: Primary research targets bunkering operators, port authorities, shipowners, interface equipment suppliers, and class society surveyors. Interviews test transfer frequencies, interface configurations, compatibility issues, equipment replacement cycles, and standardization plans.
- Desk Research: Desk research reviews port authority statistics, European infrastructure data, ISO standards, class society guides, and manufacturer literature. Named statistics are used only when supported by the government or intergovernmental sources listed in the bibliography.
- Market-Sizing and Forecasting: Sizing is developed from bunkering point counts, interface content per operation, type and standard mixes, realized pricing, and replacement cycles. The result is reconciled to USD 322 million in 2026 and USD 940 million in 2036.
- Data Validation and Update Cycle: Validation compares segment shares, supplier positions, and country growth with bunkering volumes and fleet deliveries. Update signals include licence awards, standard publications, bunker vessel orders, and receiving fleet deliveries.
Segmentation
What is the report’s scope and coverage?
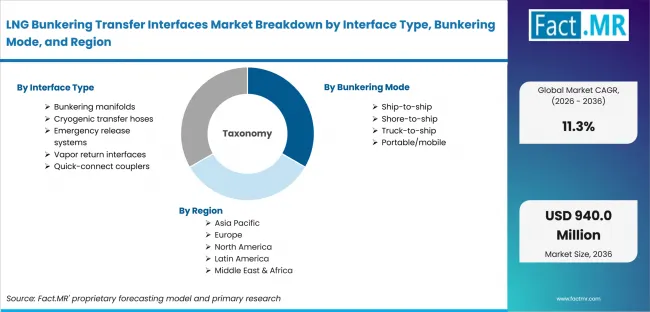
Lng Bunkering Transfer Interfaces Market Breakdown By Interface Type, Bunkering Mode, And Region | Source: Fact.MR
| ATTRIBUTE | DETAILS |
|---|---|
| Quantitative Units | USD 322 million in 2026 to USD 940 million by 2036 at 11.3% CAGR |
| Market Definition | The market covers ship-to-ship and shore-to-ship LNG bunkering transfer interfaces including hoses, manifolds, emergency release systems, vapor return interfaces and connection hardware for marine LNG fuel supply. |
| Interface Type | Bunkering manifolds; Cryogenic transfer hoses; Emergency release systems; Vapor return interfaces; Quick-connect couplers |
| Bunkering Mode | Ship-to-ship; Shore-to-ship; Truck-to-ship; Portable/mobile |
| Standard/Class | ISO 20519-compliant; SIGTTO-guided; Class-approved custom |
| Vessel Type | Container ships; Cruise/ferry; Bulk carriers; Tankers; Offshore vessels |
| End User | Bunkering operators; Shipowners/operators; Ports & terminals; LNG suppliers |
| Regions Covered | Asia Pacific; Europe |
| Countries Covered | Singapore; Netherlands; Japan; South Korea (full report analyzes 30+ countries) |
| Key Companies Profiled | Technip Energies Loading Systems; Trelleborg Gas Transfer (KLAW LNG and Gutteling ranges); MannTek; Dixon; Kanon Loading Equipment; ARTA |
| Forecast Period | 2026 to 2036 |
| Approach | Sizing combines bunkering point counts by port and mode, interface content per bunkering operation, equipment prices by type, standardization rates, and separately billed testing and service. |
Source: Fact.MR analysis. Updated Jul 24, 2026
How is the market segmented?
-
By Interface Type
- Bunkering manifolds
- Cryogenic transfer hoses
- Emergency release systems
- Vapor return interfaces
- Quick-connect couplers
-
By Bunkering Mode
- Ship-to-ship
- Shore-to-ship
- Truck-to-ship
- Portable/mobile
-
By Standard/Class
- ISO 20519-compliant
- SIGTTO-guided
- Class-approved custom
-
By Vessel Type
- Container ships
- Cruise/ferry
- Bulk carriers
- Tankers
- Offshore vessels
-
By End User
- Bunkering operators
- Shipowners/operators
- Ports & terminals
- LNG suppliers
-
By Region
- Asia Pacific
- Singapore
- Japan
- South Korea
- Europe
- Netherlands
- Asia Pacific
Frequently Asked Questions
What is the LNG bunkering transfer interfaces market worth in 2026?
What revenue level is projected for LNG bunkering transfer interfaces in 2036?
What CAGR is expected through 2036?
Which interface type leads demand?
Which bunkering mode is the largest segment?
Which standard class has the largest share?
Which end user is most common?
Who worked on this report


Preview the report firsthand - request a free sample
Free SampleGet the brochure for pricing and purchase details
Download PDF