- Market Value (2025): USD 217.6 Mn
- Estimated Value (2026): USD 240.0 Mn
- Forecast Value (2036): USD 640.0 Mn
- CAGR (2026-2036): 10.3%
What is the LNG Refueling Interface Market forecast to be worth by 2036?
USD 240.0 million in 2026 to USD 640.0 million by 2036, at a 10.3% CAGR.
- The market crossed a valuation of USD 217.6 million in 2025.
- Demand is projected to increase from USD 240.0 million in 2026 to USD 640.0 million by 2036.
- The market is forecast to record a 10.3% CAGR from 2026 to 2036, driven by heavy-duty vehicle fueling and LNG transfer hardware replacement cycles.
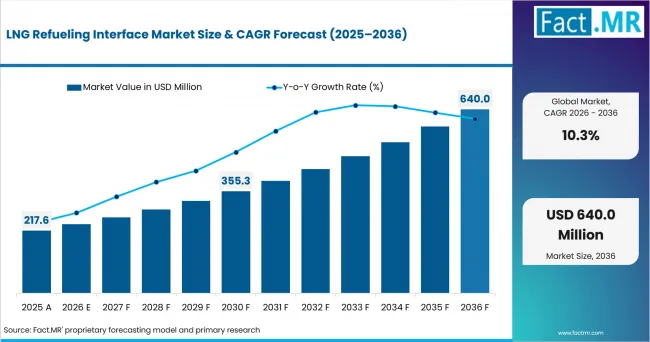
Lng Refueling Interface Market Value Analysis | Source: Fact.MR
What are the defining numbers behind LNG Refueling Interface Market growth?
USD 400.0 million absolute opportunity is expected by 2036, led by Refueling nozzles and Heavy-duty trucks alongside Stainless steel 316 and Fleet operators.
- Demand Drivers in the Market
- LNG remains useful for long-haul trucks where driving range, load capacity and fast refueling are important.
- Ports need approved connectors that handle repeated LNG transfer between shore systems and LNG-powered vessels.
- Dry-disconnect designs are expected to make each connection easier and help stations refuel vehicles or vessels more quickly.
- Breakaway couplings and matched connection systems are expected to remain important for preventing leaks if a vehicle moves away too soon or a hose fails.
- Key Segments Analyzed
- By Interface Type: Refueling nozzles are expected to hold 31.0% share in 2026 supported by their role as the controlled connection point during every LNG fueling event.
- By Application: Heavy-duty trucks are projected to account for 30.0% share in 2026 owing to frequent refueling across long-haul and high-use fleets.
- By Material: Stainless steel 316 is anticipated to capture 36.0% share in 2026 due to its stable strength and sealing performance under repeated cryogenic temperature changes.
- By Pressure Class: Low pressure below 10 bar is estimated to represent 30.0% share in 2026 attributable to its broad installed base across standard truck and bus fueling systems.
- By End User: Fleet operators are forecast to hold 29.0% share in 2026 driven by recurring fueling activity and regular replacement of worn interface components.
- Analyst Opinion at Fact.MR
- Shambhu Nath Jha, Senior Analyst at Fact.MR, states, “LNG refueling interfaces are most useful when they combine fast connection with reliable leak control. Station operators look closely at seal life, breakaway performance and safe use at very low temperatures before approving the equipment.”
- Strategic Implications
- Fleet operators gain from using the same nozzles, couplings and breakaway parts across their LNG stations. A common setup makes spare-part planning, staff training and replacement work easier at several sites.
- Station operators need clear proof of how the equipment responds if a vehicle pulls away too soon or a hose fails. Test records for emergency shutoff and leak control help confirm that the connection fails safely.
- Ports benefit from checking connector fit across both vessels and shore systems before choosing bunkering equipment. Designs that work with more than one standard help reduce delays when different vessels use the same terminal.
- Service companies strengthen local support by keeping seals, couplings and replacement parts close to busy truck routes and ports. Fast access to these items helps reduce downtime when low-temperature use wears out a fueling connection.
The UAE is projected to post an 11.0% CAGR through port activity and LNG bunkering infrastructure. The USA is anticipated to grow at a 10.3% CAGR as established freight routes and selected ports expand LNG fueling access. Japan is estimated to reach a 10.2% CAGR through shipbuilding expertise and marine fuel use. The United Kingdom is forecast at 10.0%, while Germany is projected to record a 9.7% CAGR through fleet expansion and replacement of worn refueling hardware.
How does the LNG Refueling Interface Market break down by segment?
Refueling nozzles are expected to lead Interface Type at 31.0% share in 2026. Heavy-duty trucks are projected to lead Application at 30.0% share in 2026.
Why do Refueling nozzles lead Interface Type?
Refueling nozzles are projected to account for 31.0% share in 2026.
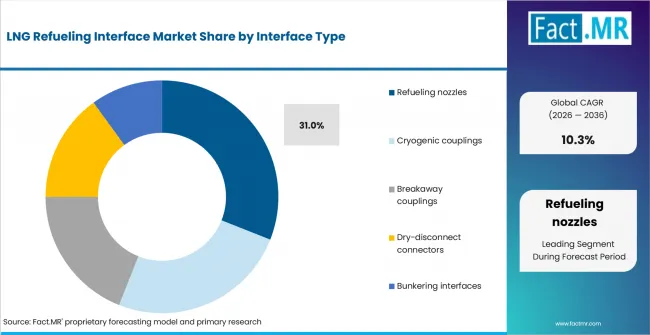
Lng Refueling Interface Market Analysis By Interface Type | Source: Fact.MR
The nozzle is handled during every fueling cycle, so it goes through frequent connection, release and seal wear. Station operators check it more often than fixed parts in the fuel line. The design must allow quick refueling while preventing leaks and accidental release. Regular use and replacement at truck stations and bus depots support its leading position.
Why do Heavy-duty trucks lead Application?
Heavy-duty trucks are estimated to represent 30.0% share in 2026.
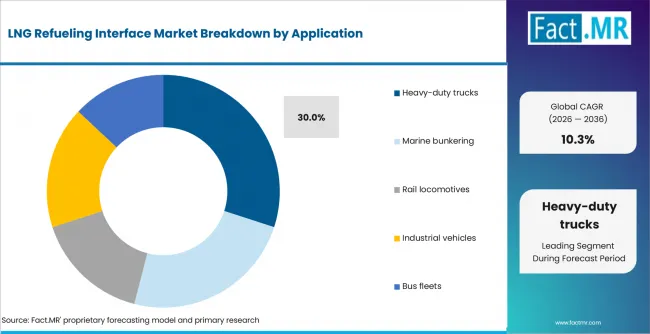
Lng Refueling Interface Market Analysis By Application | Source: Fact.MR
Long-haul trucks usually follow regular freight routes and use the same refueling corridors. This creates steady LNG demand at stations serving high-mileage fleets. Each fueling lane needs nozzles, receptacles and safety couplings that handle repeated daily use. Marine and rail systems also use these parts, but purchases depend more on individual vessel or infrastructure projects.
Why does Stainless steel 316 lead Material?
Stainless steel 316 is anticipated to capture 36.0% share in 2026.
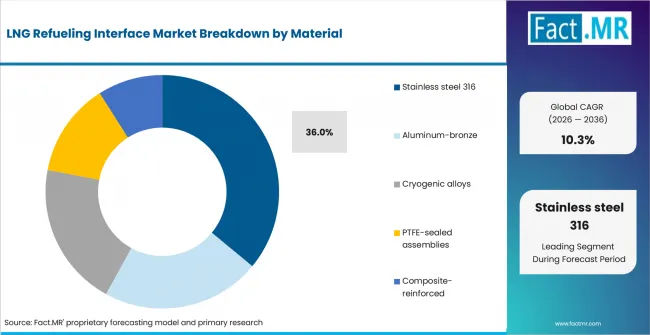
Lng Refueling Interface Market Analysis By Material | Source: Fact.MR
LNG connection parts move between normal outdoor temperatures and very low LNG temperatures. Stainless steel 316 keeps its strength under these conditions and resists damage from moisture, weather and cleaning. It also works well for sealing surfaces and common welded or threaded joints. This mix of strength, long life and easy manufacturing supports wider use.
Why does Low pressure below 10 bar lead Pressure Class?
Low pressure below 10 bar is forecast to make up 30.0% share in 2026.
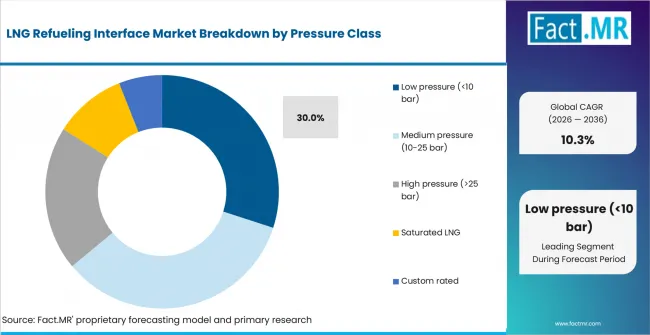
Lng Refueling Interface Market Analysis By Pressure Class | Source: Fact.MR
Many LNG truck and bus stations use lower-pressure transfer systems. These sites already have familiar layouts and well-known connection methods. Replacement demand comes from the large number of nozzles, receptacles and breakaway parts already in use. Higher-pressure systems serve fewer applications and require more specialized equipment.
Why do Fleet operators lead End User?
Fleet operators are projected to represent 29.0% share in 2026.
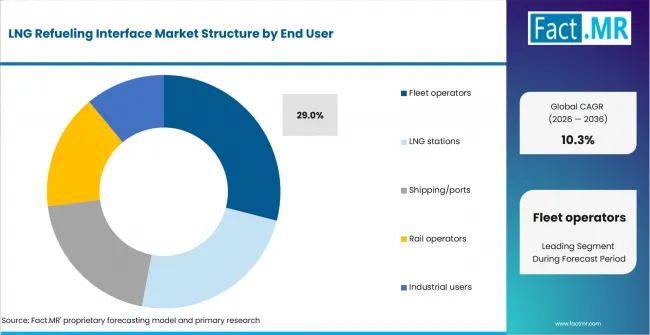
Lng Refueling Interface Market Analysis By End User | Source: Fact.MR
Fleet operators control how often vehicles are refueled and face direct delays when a connection part fails. Many manage several vehicles and stations under one maintenance plan, creating regular demand for seals, nozzles and breakaway parts. Using the same connection system across the fleet also makes staff training and spare-part storage easier. Ports and rail operators use similar equipment, but their orders are usually less frequent.
What is accelerating LNG Refueling Interface Market adoption, and what is holding it back?
Heavy-duty vehicle fueling is anticipated to expand LNG Refueling Interface Market demand, while infrastructure concentration is expected to restrain wider adoption.
Drivers Impact Analysis
| DRIVER | (~) % IMPACT ON CAGR | GEOGRAPHIC RELEVANCE | IMPACT TIMELINE |
|---|---|---|---|
| Heavy-duty vehicle fueling | +3.0% | USA, China and Europe | Short term (<=2 years) |
| Marine bunkering growth | +2.2% | Europe and Asia | Medium term (2-4 years) |
| Faster turnaround | +1.6% | Fleet stations | Short term (<=2 years) |
| Safety standardization | +1.0% | Global | Medium term (2-4 years) |
Source: Fact.MR analysis. Updated Jul 22, 2026
- Heavy-duty vehicle fueling: LNG interfaces are expected to benefit where fleets value range and short refueling windows. Each active truck station creates repeat demand for nozzles, seals and replacement connection parts.
- Marine bunkering growth: Ports are expected to need certified cryogenic connection hardware as LNG-fueled vessels use shore-side transfer systems. This supports bunkering interfaces and heavy-duty couplings.
- Faster turnaround: Dry-disconnect connectors are expected to reduce manual handling during connection and disconnection. Faster cycles help stations serve more vehicles without adding the same level of labor.
- Safety standardization: Breakaway couplings are expected to remain required in specifications that address drive-away risk. Keyed systems also reduce the chance of a mismatched connection.
Opportunity Impact Analysis
| OPPORTUNITY | (~) % IMPACT ON CAGR | GEOGRAPHIC RELEVANCE | IMPACT TIMELINE |
|---|---|---|---|
| Condition-monitored couplings | +1.8% | China and UAE | Medium term (2-4 years) |
| Multi-standard adapters | +1.3% | China and UAE | Medium term (2-4 years) |
| Low-methane-slip transfer | +1.0% | China and UAE | Short term (<=2 years) |
Source: Fact.MR analysis. Updated Jul 22, 2026
- Condition-monitored couplings: Temperature, pressure and connection-state sensing are expected to support planned maintenance. This is useful where a failed interface can stop a station lane or bunkering operation.
- Multi-standard adapters: Fleets and ports are expected to need safer transition hardware when connector formats differ across vehicle or vessel platforms. Adapter demand is tied to mixed installed bases.
- Low-methane-slip transfer: Improved sealing and purge sequence designs are expected to reduce venting during connection changes. This is most relevant where operators track fuel loss and site emissions.
Restraints Impact Analysis
| RESTRAINT | (~) % IMPACT ON CAGR | GEOGRAPHIC RELEVANCE | IMPACT TIMELINE |
|---|---|---|---|
| Infrastructure concentration | -2.3% | Global | Short term (<=2 years) |
| Cryogenic seal wear | -1.7% | Global | Medium term (2-4 years) |
| Competing fuel pathways | -1.2% | Global | Short term (<=2 years) |
Source: Fact.MR analysis. Updated Jul 22, 2026
- Infrastructure concentration: Interface demand depends on where LNG stations and bunkering terminals are built. Suppliers have limited control over the timing of those infrastructure decisions.
- Cryogenic seal wear: Repeated thermal cycling places stress on elastomers and metal sealing surfaces. Operators are expected to delay adoption when maintenance frequency becomes hard to predict.
- Competing fuel pathways: Battery-electric and hydrogen fuel-cell projects are expected to redirect some fleet and public infrastructure spending. This can slow LNG interface orders in markets with limited fueling budgets.
Which countries are scaling LNG Refueling Interface Market fastest?
A global growth rate represents the weighted average of all countries included in the analysis. The worldwide 10.3% CAGR therefore sits between the country rates covered in the full study. UAE remain above this figure while the USA is closely aligned with it. Japan, the United Kingdom and Germany remain below the global rate. The six countries shown are illustrative examples, and their comparison with the worldwide figure makes these differences visible.
- The countries are distinguished less by their CAGRs and more by the type of LNG fueling activity creating demand.
- Each additional fueling lane requires compatible nozzles, receptacles and breakaway devices. The UAE develops through ports and LNG bunkering, where ship-to-shore transfer depends on certified cryogenic couplings and heavy-duty connection systems.
- The USA and Japan remain closely aligned but follow different operating patterns. USA demand combines established truck routes with selected marine projects. Japan places greater weight on shipbuilding knowledge and port-side interfaces used for LNG-powered vessels.
- The United Kingdom and Germany form a measured lower group within the comparison. UK demand is more closely linked to port transfer while truck conversion remains selective. Germany depends more on fleet growth and replacement of seals, nozzles and other connection parts already in service.
- Markets with broadly similar CAGRs can therefore follow substantially different development paths. Station construction, port investment, connector compatibility and access to replacement parts determine when interface orders move forward.
The full report examines these dynamics for every market included in the study. It provides country-level CAGR analysis across North America, Latin America, Europe, East Asia, South Asia, Oceania, and the Middle East and Africa.
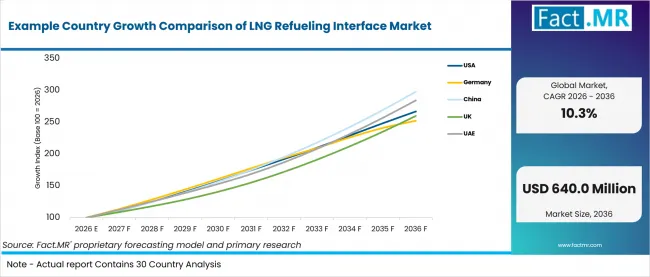
Example Country Growth Comparison Of Lng Refueling Interface Market | Source: Fact.MR
| COUNTRY | CAGR (2026 to 2036) |
|---|---|
| UAE | 11.0% |
| USA | 10.3% |
| Japan | 10.2% |
| United Kingdom | 10.0% |
| Germany | 9.7% |
Source: Fact.MR analysis. Updated Jul 22, 2026
How is the UAE scaling demand?
11.0% CAGR, shaped by strict LNG fueling procedures at major oil and gas ports.
Demand in the UAE comes mainly from port rules that treat LNG fueling as a carefully managed transfer. ADNOC requires work to take place in approved locations and under Harbour Master permission. Projects must also meet national and international safety rules. This increases demand for tested couplings, emergency shutoff parts and ship-to-shore connections that show safe performance before use.
What supports the USA outlook?
10.3% CAGR, linked to long-distance truck fleets that need longer range and fixed fueling locations.
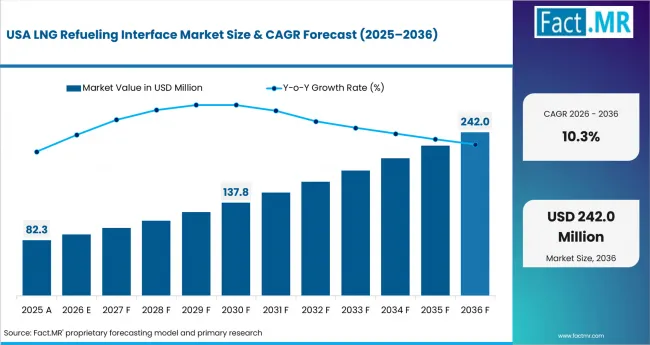
Lng Refueling Interface Market Country Value Analysis | Source: Fact.MR
The USA has a clear use case in Class 7 and Class 8 trucks that travel long distances. The Department of Energy notes that LNG stores more energy on the vehicle than compressed natural gas. This makes it suitable for high-mileage fleets that return to regular fueling points. Demand for connection parts follows these routes, where fast fueling and reliable nozzles help keep trucks on the road.
What underpins Japan’s growth?
10.2% CAGR, driven by more operating options for marine LNG fueling.
Japan is allowing LNG-powered vessels to receive fuel under a wider range of conditions. Updated national guidance now covers nighttime fueling and fueling while vessels are at anchor. Safety reviews still examine weather, vessel movement and working steps. This creates more use for ship-to-ship connections and raises the importance of well-matched parts and reliable emergency release systems.
How is the United Kingdom developing demand?
10.0% CAGR, supported by strict safety checks at terminals and ports.
Growth in the United Kingdom depends heavily on approval around coastal LNG sites. The Health and Safety Executive reviews terminal design, construction and daily operation, while port authorities manage vessel movement. Connection equipment is therefore judged on leak control, safe use in gas areas and clear operating steps instead of the number of new stations alone.
What shapes Germany’s outlook?
9.7% CAGR, tied to an existing alternative-fuel network and regular replacement of worn parts.
Germany already has LNG fueling points and natural-gas heavy trucks within its alternative-fuel network. This means demand comes less from building first-time routes and more from keeping current stations working. Nozzles, seals and breakaway couplings wear over time because of repeated cold exposure and daily handling. Easy access to replacement parts and planned maintenance therefore play a larger role in equipment choice.
Who leads the LNG Refueling Interface Market?
OPW Clean Energy Solutions has a wide position across LNG fueling equipment. MannTek and JC Carter are more focused on low-temperature transfer connections. Parker Hannifin adds strength in valves and couplings, while Cryostar offers complete fueling stations and dispensers.
OPW Clean Energy Solutions provides the CryoMac LNG fueling nozzle along with valves and other LNG handling parts. Its wider range supports truck fueling and other LNG transfer work. MannTek focuses on dry couplings, breakaway parts and emergency release systems used in LNG loading and marine fueling. JC Carter offers LNG nozzles and matching receptacles for vehicle fueling. These parts use separate shutoff valves if the connection is pulled apart. Parker Hannifin provides low-temperature couplings and valve parts for larger gas-handling systems. Cryostar serves the market through LNG and LCNG stations with dispensers for vehicle fueling.
Through 2036, companies are expected to compete on safe and reliable connection during repeated LNG use. Truck stations are likely to check nozzle freezing, seal life and how the equipment responds if a vehicle pulls away too soon. Ports will place more focus on whether couplings fit different systems and release safely during an emergency. Companies that offer tested parts, repair help and easy access to replacements are likely to receive more repeat orders.
Which companies are the key providers?
Key companies include OPW Clean Energy Solutions; Parker Hannifin; Mann Tek; Cryostar; JC Carter.
- OPW Clean Energy Solutions
- Parker Hannifin
- Mann Tek
- Cryostar
- JC Carter
Bibliography
- Ministry of Land, Infrastructure, Transport and Tourism. (2024, May 31). LNG bunkering guidelines revised toward supplying LNG fuel to ships at night. Ministry of Land, Infrastructure, Transport and Tourism.
- U.S. Energy Information Administration. (2024). Liquefied natural gas explained. U.S. Energy Information Administration.
- U.S. Pipeline and Hazardous Materials Safety Administration. (2025, October). Pipeline safety: Liquefied natural gas facilities public meeting 2025. U.S. Department of Transportation.
- European Commission. (2025, April 11). Commission enhances interoperability and transparency of alternative fuels infrastructure data. European Commission.
- International Maritime Organization. (2024, November 11). Advancing training for seafarers on LNG-fuelled ships. International Maritime Organization.
This Report Addresses
- The report provides strategic intelligence on LNG Refueling Interface Market across Interface Type and Application choices that shape purchasing decisions.
- Segment analysis covers Refueling nozzles as the share leader within the 2026 market structure.
- Regional outlook evaluates UAE alongside USA and Japan, while UK and Germany complete the growth comparison.
- Competitive analysis profiles OPW Clean Energy Solutions and Parker Hannifin alongside Mann Tek, followed by additional active providers.
- Use-case assessment covers the categories and applications that shape LNG Refueling Interface Market demand across the forecast period.
What does the LNG Refueling Interface Market cover?
Cryogenic connection hardware is used to transfer LNG safely between a fuel supply system and a truck, bus, vessel or industrial asset.
The LNG Refueling Interface Market covers the equipment that forms, secures and releases the fueling connection. Coverage includes refueling nozzles and receptacles alongside cryogenic and breakaway couplings. Dry-disconnect connectors, bunkering interfaces, seals and interface-specific safety assemblies are included. These products are designed to limit leakage, prevent unsafe hose separation and maintain connection performance at very low temperatures.
The market differs from the wider LNG infrastructure sector because commercial value comes from the final connection assembly. Complete storage and dispensing systems remain outside the boundary. The market focuses on hardware handled or activated during fuel transfer rather than every component used to store, pump or transport LNG.
What is included in the scope?
LNG refueling interfaces are used across heavy-duty truck stations, marine bunkering sites, bus depots, rail operations and industrial fueling facilities.
The scope includes Interface Type and Application alongside Material, Pressure Class and End User. Interface coverage spans refueling nozzles, cryogenic couplings, breakaway couplings, dry-disconnect connectors and bunkering interfaces. Materials include stainless steel 316, aluminium-bronze, cryogenic alloys, PTFE-sealed assemblies and composite-reinforced designs. Pressure coverage ranges from low-pressure and medium-pressure systems to high-pressure, saturated-LNG and custom-rated interfaces.
End-user coverage includes fleet operators, LNG stations, shipping and port operators, rail companies and industrial users. Seals, receptacles and safety devices remain within the scope when they are supplied as part of the LNG connection system.
What is excluded from the scope?
Broader LNG storage, delivery and vehicle-fuel systems remain outside the scope of this market.
The scope excludes complete LNG storage tanks, pumps, vaporizers and full dispensers. Onboard fuel tanks and terminal-construction spending are also excluded. Hoses sold without interface hardware remain outside the boundary, along with piping and other equipment that does not form or protect the final fueling connection.
How Was the Analysis Built?
The analysis draws on 120+ sources, 35+ company portfolios, 25+ countries, and more than 20 industry interviews.
- Primary Research: Primary research includes discussions with manufacturers, service providers, technology developers, distributors, end users, procurement teams, and subject-matter experts. These conversations examine purchasing priorities, product adoption, operational challenges, approval requirements, competitive positioning, and the factors that influence wider market acceptance.
- Desk Research: Desk research covers government statistics, regulatory publications, company filings, trade data, technical studies, industry associations, standards, public policy, and other authoritative sources. Every source used in the analysis is documented in the bibliography.
- Market Sizing and Forecasting: Market estimates combine historical performance, demand indicators, pricing and volume trends, segment shares, company participation, country-level growth, adoption patterns, investment activity, and barriers to market expansion.
- Data Validation and Update Cycle: Findings are validated by comparing primary interviews with public data, company activity, regulatory changes, trade patterns, and industry developments. Regular updates review new product launches, capacity changes, partnerships, approvals, procurement trends, and shifts in commercial adoption.
Segmentation
What is the report's scope and coverage?
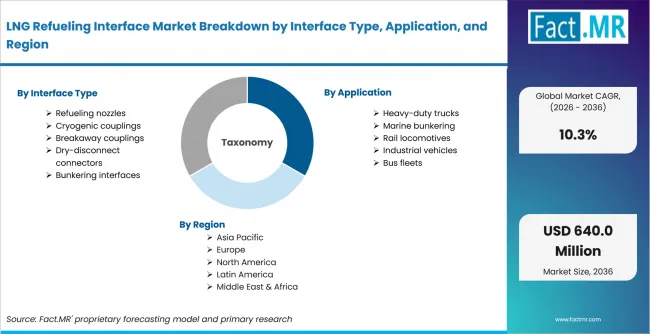
Lng Refueling Interface Market Breakdown By Interface Type, Application, And Region | Source: Fact.MR
| Attribute | Details |
|---|---|
| Quantitative Units | USD Million |
| Market Definition | An LNG refueling interface is the safety-critical connection assembly used between an LNG fuel supply and the asset being fueled. |
| Interface Type | Refueling nozzles; Cryogenic couplings; Breakaway couplings; Dry-disconnect connectors; Bunkering interfaces |
| Application | Heavy-duty trucks; Marine bunkering; Rail locomotives; Industrial vehicles; Bus fleets |
| Material | Stainless steel 316; Aluminum-bronze; Cryogenic alloys; PTFE-sealed assemblies; Composite-reinforced |
| Pressure Class | Low pressure (<10 bar); Medium pressure (10-25 bar); High pressure (>25 bar); Saturated LNG; Custom rated |
| End User | Fleet operators; LNG stations; Shipping/ports; Rail operators; Industrial users |
| Regions Covered | North America; Latin America; Europe; East Asia; South Asia & Oceania; Middle East & Africa |
| Countries Covered | USA; Canada; Brazil; Mexico; Germany; U.K.; France; Italy; Spain; South Korea; Japan; Australia & New Zealand; GCC Countries; South Africa; UAE |
| Key Companies Profiled | OPW Clean Energy Solutions; Parker Hannifin; Mann Tek; Cryostar; JC Carter |
| Forecast Period | 2026 to 2036 |
| Approach | Hybrid top-down and bottom-up approach using demand indicators across Interface Type, Application, Material, Pressure Class and End User; country-level growth; company participation; and adoption trends |
Source: Fact.MR analysis. Updated Jul 22, 2026
How is the market segmented?
-
By Interface Type:
- Refueling nozzles
- Cryogenic couplings
- Breakaway couplings
- Dry-disconnect connectors
- Bunkering interfaces
-
By Application:
- Heavy-duty trucks
- Marine bunkering
- Rail locomotives
- Industrial vehicles
- Bus fleets
-
By Material:
- Stainless steel 316
- Aluminum-bronze
- Cryogenic alloys
- PTFE-sealed assemblies
- Composite-reinforced
-
By Pressure Class:
- Low pressure (<10 bar)
- Medium pressure (10-25 bar)
- High pressure (>25 bar)
- Saturated LNG
- Custom rated
-
By End User:
- Fleet operators
- LNG stations
- Shipping/ports
- Rail operators
- Industrial users
-
By Region:
- North America
- USA
- Canada
- Latin America
- Brazil
- Mexico
- Rest of Latin America
- Europe
- Germany
- U.K.
- France
- Italy
- Spain
- Rest of Europe
- East Asia
- South Korea
- Japan
- South Asia & Oceania
- Australia & New Zealand
- Rest of South Asia & Oceania
- Middle East & Africa
- GCC Countries
- South Africa
- UAE
- Rest of Middle East & Africa
- North America
Frequently Asked Questions
Which Interface Type leads the LNG Refueling Interface Market?
Which Application leads the LNG Refueling Interface Market?
Which Material leads the LNG Refueling Interface Market?
Which Pressure Class leads the LNG Refueling Interface Market?
Which End User leads the LNG Refueling Interface Market?
How does UAE perform in the LNG Refueling Interface Market?
How does USA perform in the LNG Refueling Interface Market?
What is the primary driver in the LNG Refueling Interface Market?
What is the main restraint in the LNG Refueling Interface Market?
Who worked on this report


Preview the report firsthand - request a free sample
Free SampleGet the brochure for pricing and purchase details
Download PDF