- Market Value (2025): USD 6.8 Bn
- Estimated Value (2026): USD 7.6 Bn
- Forecast Value (2036): USD 24.9 Bn
- CAGR (2026-2036): 12.6%
What is the Marketing Performance Management Mpm Software Market forecast to be worth by 2036?
USD 7.6 billion in 2026 to USD 24.9 billion by 2036, at 12.6% CAGR.
- Demand is projected to increase from USD 7.6 billion in 2026 to USD 24.9 billion by 2036.
- The market is forecast to record a 12.6% CAGR from 2026 to 2036 as marketing and finance teams replace disconnected planning, budget, and reporting processes with governed software workflows.
- Purchasing decisions are expected to favor platforms that can reconcile planned spend with commitments and actuals, connect campaign activity to business outcomes, and preserve data ownership, permissions, and audit history across the marketing lifecycle.
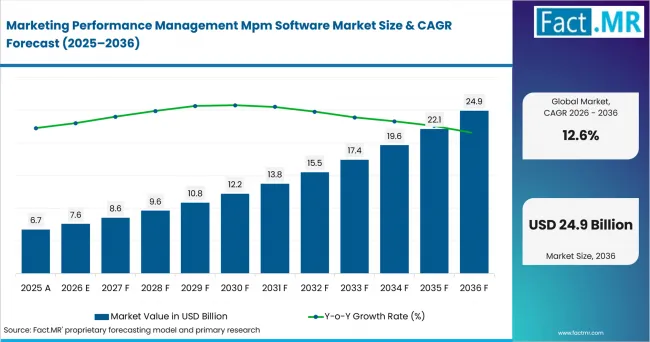
Marketing Performance Management Mpm Software Market Value Analysis | Source: Fact.MR
What are the defining numbers behind Marketing Performance Management Mpm Software Market growth?
USD 17.3 billion absolute opportunity by 2036, led by Software, Cloud-Based deployment, Marketing Planning & Budgeting, Large Enterprises, and Retail & E-commerce.
- Demand Drivers in the Market
- Chief marketing officers and finance leaders need a common planning structure because annual budgets, quarterly reallocations, purchase orders, invoices, campaign plans, and performance metrics often move on different calendars.
- Omnichannel teams need to combine paid media, owned channels, commerce, customer relationship management, events, and offline activity before managers can compare the cost and contribution of a campaign.
- Large enterprises need permissions, approval paths, currency handling, organizational hierarchies, and consistent campaign taxonomies across brands, countries, business units, and agencies.
- Marketing operations teams need faster scenario analysis as AI-assisted forecasting and analytics increase the number of recommendations that must be reviewed, governed, and converted into approved action.
- Key Segments Analyzed
- By Component: Software is expected to hold 68% share in 2026 because recurring platforms contain planning, analytics, workflow, reporting, and data-management functions that remain in use throughout the budget cycle.
- By Deployment: Cloud-Based deployment is projected to account for 76% share in 2026 as distributed teams require browser access, configurable integrations, frequent product updates, and scalable data processing.
- By Application: Marketing Planning & Budgeting is anticipated to capture 29% share in 2026 owing to the need to translate strategy into funded activities and compare budget, forecast, commitments, and actual spending.
- By Enterprise Size: Large Enterprises are estimated to represent 63% share in 2026 because global and multinational organizations carry the greatest planning complexity, data volume, governance burden, and integration requirement.
- By End User: Retail & E-commerce is forecast to account for 26% share in 2026 driven by frequent promotions, high channel activity, large transaction datasets, and continuous budget reallocation across acquisition and retention programs.
- Analyst Opinion at Fact.MR
- Shambhu Nath Jha, Sr. Consultant at Fact.MR, states: “Marketing performance management is becoming a control-system decision rather than a reporting-software purchase. Buyers should test whether a platform can carry one plan from objective and budget through commitment, execution, actual cost, attribution, and management review. Fact.MR is of the opinion that vendors will gain durable accounts where marketing workflows reconcile with finance data and customer systems without forcing users back into manual planning files for the final answer.”
- Strategic Implications
- Chief marketing officers should define the management decisions the system must support before comparing dashboards, including reallocation thresholds, forecast cadence, approval rights, and acceptable attribution evidence.
- Finance and marketing operations teams should agree on account mappings, campaign identifiers, currency rules, accrual treatment, and plan-to-actual timing before implementation starts.
- Software providers should package connectors, migration tools, planning templates, and change-management support around the customer’s existing finance, CRM, media, commerce, and work-management environment.
- Retailers and other high-frequency marketers should separate operational optimization metrics from finance-grade performance measures so rapid campaign changes do not weaken governance or executive trust.
South Korea is projected to record the fastest profiled CAGR at 13.64%, supported by mobile-commerce intensity and fast campaign feedback. The USA follows at 13.05% as large enterprises manage broad channel and software estates. Canada is expected to advance at 12.71% as AI-enabled marketing automation and cloud adoption expand. The UK is forecast at 12.44% and Australia at 12.39% as online sales and digital business activity increase measurement requirements. Germany is projected at 12.17% through enterprise cloud adoption, while Japan is expected to post 11.82% as large B2C and B2B e-commerce ecosystems create demand for more consistent planning and performance control.
How does the Marketing Performance Management Mpm Software Market break down by segment?
Software leads Component at 68%, Cloud-Based deployment leads at 76%, Marketing Planning & Budgeting leads Application at 29%, Large Enterprises lead Enterprise Size at 63%, and Retail & E-commerce leads End User at 26% in 2026.
Why does Software lead Component?
Software holds 68% share in 2026.
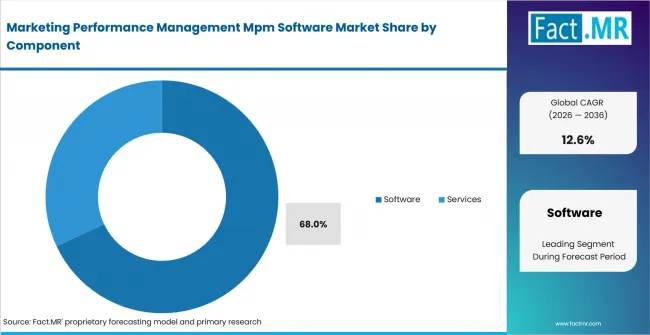
Marketing Performance Management Mpm Software Market Analysis By Component | Source: Fact.MR
Software is expected to hold 68% share in 2026 because the principal commercial value comes from a persistent platform that stores plans, governs budgets, consolidates data, and produces repeatable analysis. Adobe Workfront connects campaign planning to execution workflows, while Salesforce Marketing Cloud Intelligence is designed to connect, harmonize, visualize, and act on marketing data. Services remain necessary for consulting, implementation, integration, and support, particularly when finance codes, campaign taxonomies, and historical data differ across business units. The Software lead is sustained when customers can configure the platform without turning every planning-cycle change into a new services project.
Why does Cloud-Based lead Deployment?
Cloud-Based deployment accounts for 76% share in 2026.
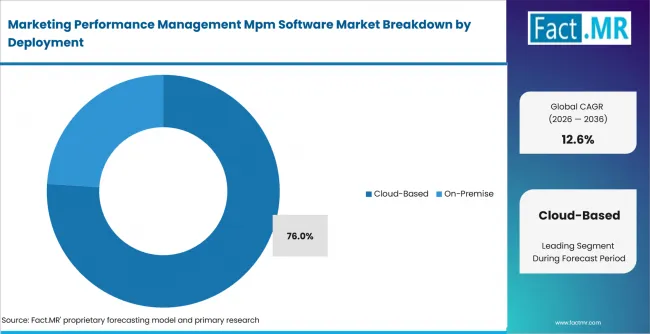
Marketing Performance Management Mpm Software Market Analysis By Deployment | Source: Fact.MR
Cloud-Based deployment is projected to account for 76% share in 2026 because marketing teams work across locations, agencies, channels, and time zones while data arrives from multiple software services. Oracle describes cloud EPM as a standard route for planning and reporting, and Germany’s Federal Statistical Office reported in November 2025 that 54% of enterprises with at least ten employees used paid cloud services, rising to 86% among large enterprises. On-Premise deployment continues where private data centers, enterprise infrastructure, residency rules, or deeply customized systems shape architecture. Cloud leadership still depends on security review, integration performance, identity controls, and credible data-export options.
Why does Marketing Planning & Budgeting lead Application?
Marketing Planning & Budgeting represents 29% share in 2026.
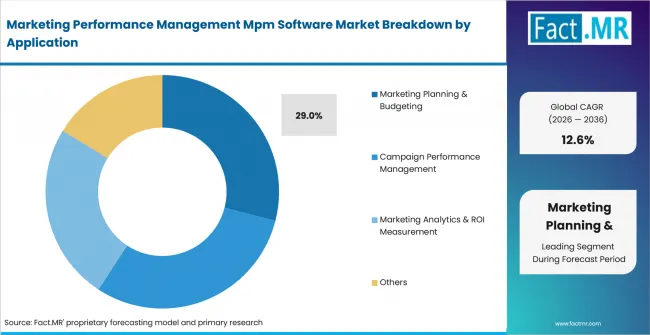
Marketing Performance Management Mpm Software Market Analysis By Application | Source: Fact.MR
Marketing Planning & Budgeting is anticipated to capture 29% share in 2026 because it creates the funded operating baseline against which campaigns and performance are assessed. SAP’s Q2 2026 Marketing Planning package includes budget planning, demand planning, campaign planning, campaign analysis, and performance analysis, with plan, budget, and actual variance views. Campaign Performance Management follows where teams optimize multi-channel programs during execution. Marketing Analytics & ROI Measurement serves attribution and KPI dashboard needs, while Marketing Resource Management and Compliance & Governance extend the workflow. Planning leads when the platform can translate objectives into approved money, timing, owners, and measurable expected outcomes.
Why do Large Enterprises lead Enterprise Size?
Large Enterprises hold 63% share in 2026.
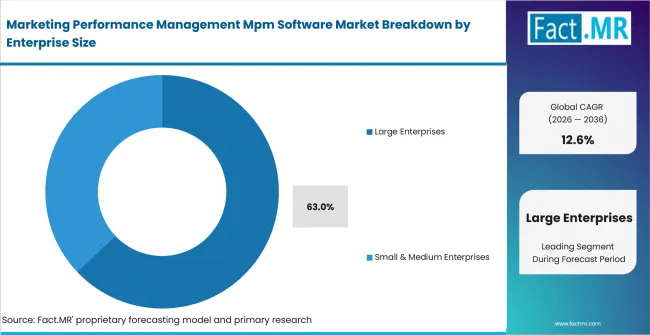
Marketing Performance Management Mpm Software Market Analysis By Enterprise Size | Source: Fact.MR
Large Enterprises are estimated to represent 63% share in 2026 because global and multinational organizations must coordinate multiple brands, legal entities, currencies, regions, agencies, and approval levels. Planful positions marketing performance management around a connected plan that aligns marketing and finance on budgets, forecasts, campaign plans, ROI, and business outcomes. Large organizations also have more systems to integrate and more historical data to reconcile, which raises implementation effort but increases the value of standardized governance. Small & Medium Enterprises remain an important expansion route where prebuilt connectors, guided templates, and lower-administration cloud packages reduce the cost of replacing manual planning files and point tools.
Why does Retail & E-commerce lead End User?
Retail & E-commerce accounts for 26% share in 2026.
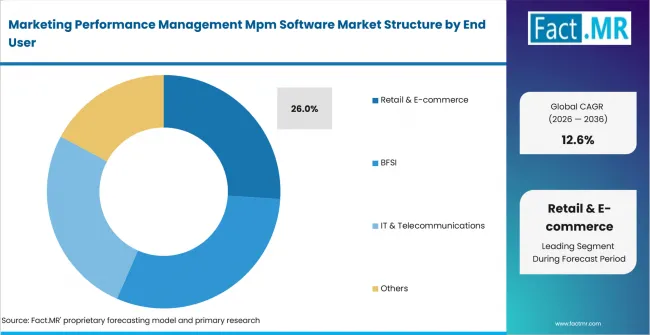
Marketing Performance Management Mpm Software Market Analysis By End User | Source: Fact.MR
Retail & E-commerce is forecast to account for 26% share in 2026 because omnichannel retailers and online marketplaces run frequent promotions and can observe campaign response through transaction, traffic, product, loyalty, and channel data. The U.S. Census Bureau estimated first-quarter 2026 retail e-commerce sales at USD 326.7 billion, up 9.8% year over year on a seasonally adjusted basis, while online sales represented 16.9% of total retail sales. BFSI demand is shaped by governance and customer-data controls. IT & Telecommunications teams manage subscription, pipeline, and channel metrics, while healthcare, manufacturing, media, consumer goods, and government buyers apply the software to different planning cadences. Retail leadership depends on turning high-frequency signals into controlled budget decisions rather than another layer of campaign reporting.
What is accelerating Marketing Performance Management Mpm Software Market adoption, and what is holding it back?
Finance-grade marketing accountability, omnichannel data complexity, cloud integration, and AI-assisted analysis support adoption, while fragmented data, attribution uncertainty, implementation burden, and privacy controls slow enterprise conversion.
Drivers Impact Analysis
| DRIVER | COMMERCIAL EFFECT | GEOGRAPHIC RELEVANCE | IMPACT TIMELINE |
|---|---|---|---|
| Finance-grade marketing planning and budget accountability | Moves plans, forecasts, commitments, actuals, and performance review into a controlled workflow | USA, UK, Germany, and Canada | Current forecast period |
| Omnichannel and e-commerce measurement complexity | Expands demand for data harmonization, campaign comparison, attribution, and KPI governance | USA, UK, Japan, South Korea, and Australia | Current forecast period |
| Cloud data integration across distributed marketing teams | Supports recurring software use, remote collaboration, and faster connector deployment | Global, with large-enterprise emphasis | Current forecast period |
| AI-assisted analytics, forecasting, and workflow automation | Increases scenario volume and the need to govern recommendations before budget or campaign changes | Canada, Australia, USA, and South Korea | Medium term |
| Executive pressure to connect marketing activity to business outcomes | Broadens MPM from campaign reporting into planning and decision support | Global large enterprises | Medium term |
Source: Fact.MR analysis. Updated Aug 5, 2026
- Finance-grade planning and accountability: The CMO Survey reported in April 2025 that 63% of surveyed marketing leaders faced increased pressure from CFOs to demonstrate results. MPM software converts that pressure into system requirements for shared assumptions, approval history, spend visibility, and variance analysis. Revenue expands when the platform reduces reconciliation work and gives finance a defensible link from budget to outcome.
- Omnichannel measurement complexity: The need is strongest where digital commerce and media activity produce frequent decisions. The UK Office for National Statistics reported that online spending values rose 14.4% year over year in June 2026 and represented 29.4% of retail sales. More channel activity increases the value of common campaign identifiers and consistent performance definitions across planning and execution.
Opportunity Impact Analysis
| OPPORTUNITY | COMMERCIAL EFFECT | GEOGRAPHIC RELEVANCE | IMPACT TIMELINE |
|---|---|---|---|
| Unified marketing system of record across plans, budgets, work, and results | Creates a broader recurring platform role and reduces duplicate planning structures | Global enterprise accounts | Current to medium term |
| Privacy-aware first-party measurement and governed attribution | Supports performance analysis under stricter consent, tracking, and data-use controls | Europe, UK, USA, and Australia | Current forecast period |
| Packaged MPM workflows for mid-sized businesses | Widens adoption through templates, faster onboarding, and lower integration burden | USA, Canada, UK, and Australia | Medium term |
| Industry-specific planning models for retail, BFSI, and technology accounts | Improves time to value through relevant metrics, calendars, controls, and data mappings | USA, Japan, Germany, and South Korea | Medium to long term |
Source: Fact.MR analysis. Updated Aug 5, 2026
- Unified marketing system of record: Adobe Workfront and Uptempo both describe planning systems that connect campaigns, budgets, work, and performance. The revenue opportunity becomes real when customers retire duplicate manual planning files and point tools rather than add another dashboard. Vendors must prove data ownership, workflow fit, integration stability, and administrator control before the platform becomes the accepted management record.
- Privacy-aware measurement: The UK Information Commissioner’s Office stated in January 2025 that its online-tracking strategy would address tracking across websites, apps, and connected devices, while continuing enforcement of consent requirements for targeted advertising. MPM vendors can create value by recording permitted data uses, separating aggregated and person-level analysis, and giving buyers transparent lineage for metrics used in budget decisions.
Restraints Impact Analysis
| RESTRAINT | COMMERCIAL EFFECT | GEOGRAPHIC RELEVANCE | IMPACT TIMELINE |
|---|---|---|---|
| Fragmented data and inconsistent campaign taxonomies | Delays trusted reporting and increases mapping, cleansing, and governance work | Global multi-system organizations | Current forecast period |
| Attribution uncertainty across walled gardens and offline channels | Weakens confidence when software presents modeled contribution as direct causation | Global omnichannel marketers | Current forecast period |
| Integration, implementation, and change-management cost | Extends deployment and limits adoption where process ownership is unclear | Large enterprises and cost-sensitive SMEs | Medium term |
| Privacy, security, and data-residency controls | Adds architecture review, permissions work, and limits on person-level measurement | Europe, UK, Canada, and Australia | Medium to long term |
Source: Fact.MR analysis. Updated Aug 5, 2026
- Fragmented data and taxonomies: A platform cannot reconcile marketing performance when business units use different campaign names, fiscal calendars, cost categories, channel definitions, and customer identifiers. Implementation slows while teams decide which definitions become standard and which local exceptions remain. Services revenue may rise, but software expansion is delayed until users trust the resulting numbers.
- Attribution uncertainty: Multi-touch models, experiments, media-platform reporting, CRM opportunity data, and offline outcomes answer different questions. MPM software loses credibility when it hides those differences behind one ROI number. Buyers therefore require model documentation, comparison views, and clear separation between observed, allocated, and modeled results.
- Implementation and change burden: Statistics Canada reported that 40.1% of businesses using AI developed new workflows and 18.2% used vendors or consulting services to install or integrate AI. MPM adoption carries a similar organizational burden because planning ownership, approvals, and reporting routines must change with the software. Projects stall when no executive owns the operating model after go-live.
- Privacy, security, and residency controls: Marketing performance systems can combine customer, campaign, financial, and employee workflow data. Security teams must review access, retention, export, subprocessors, and regional hosting. These checks are necessary, but they can lengthen procurement and narrow the data available for attribution or personalization.
Which countries are scaling Marketing Performance Management Mpm Software Market fastest?
South Korea 13.64%, USA 13.05%, Canada 12.71%, UK 12.44%, Australia 12.39%, Germany 12.17%, and Japan 11.82% through 2036.
Regional analysis covers North America, Europe, Asia Pacific, Central & South America, and the Middle East & Africa. Country commentary below focuses on the seven profiled markets.
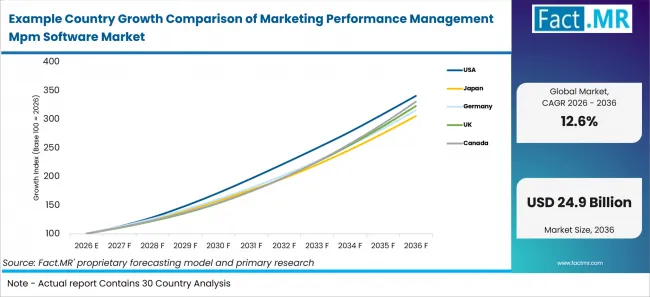
Example Country Growth Comparison Of Marketing Performance Management Mpm Software Market | Source: Fact.MR
| COUNTRY | CAGR (2026-2036) |
|---|---|
| South Korea | 13.64% |
| USA | 13.05% |
| Canada | 12.71% |
| UK | 12.44% |
| Australia | 12.39% |
| Germany | 12.17% |
| Japan | 11.82% |
Source: Fact.MR analysis. Updated Aug 5, 2026
What is driving South Korea's growth through 2036?
13.64% CAGR through 2036.
South Korea records the highest profiled CAGR because marketers operate in an environment where online and mobile transactions provide frequent performance signals. The Ministry of Data and Statistics reported online shopping transaction value of KRW 24.2904 trillion in December 2025, including KRW 18.7991 trillion through mobile shopping. Mobile therefore represented roughly three-quarters of online transaction value. Retailers, marketplaces, telecom operators, and consumer brands need planning systems that can compare channels and revise budgets without losing the approval and financial record. The market is projected to advance at 13.64% CAGR through 2036, with conversion depending on local integrations, Korean-language workflows, and reliable links between campaign metrics and enterprise reporting.
How is the USA scaling MPM software demand?
13.1% CAGR through 2036.
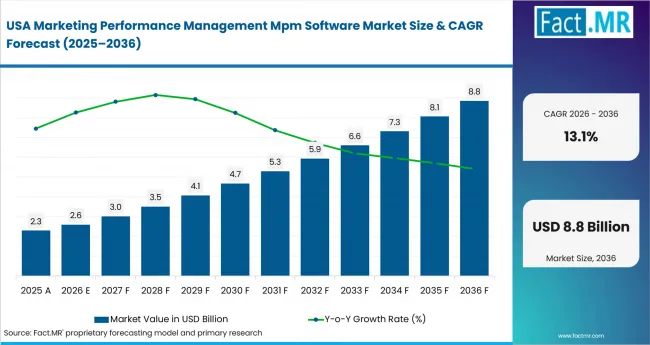
Marketing Performance Management Mpm Software Market Country Value Analysis | Source: Fact.MR
The USA combines a large enterprise buyer base with extensive use of cloud marketing, CRM, commerce, media, and analytics platforms. The U.S. Census Bureau estimated seasonally adjusted retail e-commerce sales of USD 326.7 billion in the first quarter of 2026, up 9.8% from the first quarter of 2025 and equal to 16.9% of total retail sales. High digital activity creates a strong need for campaign comparison and budget reallocation, but it also increases data duplication and attribution disputes. Demand is expected to record a 13.1% CAGR through 2036.
What supports Canada's outlook?
12.71% CAGR through 2036.
Canada’s path is influenced by the operational changes that accompany AI and cloud adoption rather than by marketing automation alone. Statistics Canada reported that 12.2% of businesses used AI in the second quarter of 2025, twice the level a year earlier. Among AI users, 23.1% reported marketing automation, 26.4% used data analytics, and 25.7% purchased cloud services or storage after implementation. These patterns support demand for platforms that place AI-supported analysis inside approved planning and budget workflows. The market is projected to grow at 12.71% CAGR through 2036.
How is the UK developing MPM software demand?
12.44% CAGR through 2036.
The UK combines a high online share of retail with active regulatory attention to tracking and direct marketing. The Office for National Statistics reported that online sales values rose 14.4% year over year in June 2026 and represented 29.4% of retail sales, the highest proportion since April 2021. This gives retailers and consumer brands a large stream of campaign and transaction signals, but the Information Commissioner’s Office continues to enforce consent requirements for targeted advertising and online tracking. Demand is anticipated to post a 12.44% CAGR through 2036.
What shapes Australia's growth?
12.39% CAGR through 2036.
Australia offers a broad digital-business base across retail, services, finance, media, and technology. The Australian Bureau of Statistics reported that 12% of businesses used AI in 2024-25, while the same release found that 51% used social media for an online presence and 32% received orders online. These activities create demand for consistent campaign definitions and reporting across paid, social, commerce, and customer channels. The market is forecast to advance at 12.39% CAGR through 2036.
What is driving Germany's growth through 2036?
12.17% CAGR through 2036.
Germany’s opportunity is concentrated in large and internationally active organizations that require rigorous planning, permissions, and data governance. Destatis reported in November 2025 that 54% of enterprises with at least ten employees used paid cloud services, rising to 86% among enterprises with 250 or more employees. This supports Cloud-Based MPM deployment, especially where marketing teams already use cloud office, storage, CRM, or ERP services. The market is expected to expand at 12.17% CAGR through 2036.
How is Japan building MPM software demand?
11.82% CAGR through 2036.
Japan has substantial digital transaction activity across consumer and business markets. The Ministry of Economy, Trade and Industry reported that the domestic B2C e-commerce market reached JPY 26.1 trillion in 2024, up 5.1%, while B2B e-commerce reached JPY 514.4 trillion, up 10.6%. Large retailers, manufacturers, technology companies, and financial institutions therefore manage marketing plans across products, distributors, digital channels, and long customer journeys. Demand is estimated to record an 11.82% CAGR through 2036.
Who leads the Marketing Performance Management Mpm Software Market?
Adobe Inc. and the remaining profiled companies compete through marketing planning, budget control, data harmonization, analytics, workflow, customer engagement, and finance integration capabilities.
Adobe Inc. is an active provider and participates through Adobe Workfront, which connects campaign planning with objectives, resource allocation, execution workflows, budget status, and project completion. Salesforce, Inc. contributes Marketing Cloud Intelligence for connecting, harmonizing, visualizing, and acting on marketing data. Oracle Corporation and SAP SE link marketing planning to broader enterprise performance and financial processes, while Microsoft Corporation connects customer data, journeys, analytics, and business applications. These providers are compared on integration breadth, finance alignment, data governance, workflow depth, reporting flexibility, and the ability to support large multi-entity deployments.
Which companies are the key providers?
Adobe Inc. is an active provider. Salesforce, Oracle, SAP, HubSpot, Microsoft, Workfront, Planful, Allocadia (Uptempo), and Aprimo are among other key players.
- Adobe Inc.
- Salesforce, Inc.
- Oracle Corporation
- SAP SE
- HubSpot, Inc.
- Microsoft Corporation
- Workfront (Adobe)
- Planful, Inc.
- Allocadia (Uptempo)
- Aprimo LLC
Bibliography
- Adobe. (2024, August 22). Marketing Campaign Planning Tools | Adobe Workfront. Adobe.
- Aprimo LLC. (n.d.). Aprimo Plan & Spend. Aprimo.
- Australian Bureau of Statistics. (2026, June 25). Characteristics of Australian Business, 2024-25 financial year. ABS.
- Destatis. (2025, November 24). Jedes zweite Unternehmen nutzt kostenpflichtige Cloud-Services. Federal Statistical Office of Germany.
- HubSpot, Inc. (n.d.). Marketing Analytics & Dashboard Software. HubSpot.
- Information Commissioner’s Office. (2025, January 23). Our strategy for levelling the playing field for online tracking in 2025. ICO.
- Microsoft. (2026, May 18). Journeys overview: Dynamics 365 Customer Insights. Microsoft Learn.
- Ministry of Data and Statistics, Republic of Korea. (2026, February 2). Online Shopping in December 2025. MODS.
- Ministry of Economy, Trade and Industry, Japan. (2025, August 26). Results of FY2024 E-Commerce Market Survey Compiled. METI.
- Office for National Statistics. (2026, July 24). Retail sales, Great Britain: June 2026. ONS.
- Oracle Corporation. (n.d.). What is enterprise performance management? Oracle.
- Planful, Inc. (n.d.). Marketing Performance Management Made Easy. Planful.
- Planful, Inc. (2025, May 14). Planful Announces AI-Enabled Product Innovations to Help CFOs Address Talent Shortages and Drive Performance. Planful.
- Salesforce, Inc. (n.d.). Marketing Cloud Intelligence. Salesforce Help.
- SAP SE. (2026, Q2). Marketing Planning. SAP Analytics Cloud Content Package User Guide, Version 2026.8. SAP Help Portal.
- Statistics Canada. (2025, June 16). Analysis on artificial intelligence use by businesses in Canada, second quarter of 2025. Government of Canada.
- The CMO Survey. (2025, April 1). Marketers Claim a Broader Role and Increased Influence Amid Pressures. Duke University, Deloitte, and American Marketing Association.
- U.S. Census Bureau. (2026, May 18). Quarterly Retail E-Commerce Sales: First Quarter 2026. U.S. Department of Commerce.
- Uptempo. (n.d.). Allocadia is now Uptempo. Uptempo.
- Uptempo. (n.d.). Enterprise Marketing Planning Software: A Single System of Record for Planning. Uptempo.
This Report Answers
- The report provides strategic intelligence on MPM software across Component and Deployment choices that shape platform selection, recurring software value, and implementation requirements.
- Segment analysis covers Software and Cloud-Based deployment as the stated share leaders within the 2026 market structure.
- Application and buyer analysis evaluates Marketing Planning & Budgeting and Large Enterprises while discussing alternative uses and organization sizes without assigning unsupported shares.
- Regional outlook evaluates USA, Japan, Germany, UK, Canada, Australia, and South Korea using the country growth rates presented in this report.
- Competitive analysis evaluates Adobe Inc. and reviews nine additional profiled providers.
- End-user assessment covers Retail & E-commerce, BFSI, IT & Telecommunications, healthcare, manufacturing, media, consumer goods, and government buying environments.
What does the Marketing Performance Management Mpm Software Market cover?
Software and related qualifying services used to plan marketing investment, control budgets, manage campaigns and resources, consolidate performance data, and evaluate business contribution.
The market covers Software for Marketing Planning, Performance Analytics, Marketing Planning & Budgeting, Campaign Performance Management, Marketing Analytics & ROI Measurement, Marketing Resource Management, and Compliance & Governance. It includes Cloud-Based and On-Premise deployment, along with Consulting and Implementation & Support services when those services are purchased to configure or operate a qualifying MPM platform.
The market differs from general marketing automation because counted value centers on planning, financial control, work coordination, and performance management rather than message delivery alone. It also differs from broad enterprise performance management, CRM, business intelligence, project management, and digital asset management where the purchased product is not principally configured for marketing planning and performance. Advertising inventory, agency media fees, creative production charges, and finished marketing services are outside the software revenue boundary.
What is included in the scope?
MPM software subscriptions, licenses, and attached implementation or support services across the stated deployment, application, enterprise-size, and end-user structure.
The scope includes platforms used by marketing, finance, marketing operations, channel, analytics, procurement, and executive teams to set objectives, build plans, allocate budgets, forecast expenses, manage commitments, coordinate campaigns, compare actual spending, monitor KPIs, and evaluate attributed or modeled contribution. Data connectors, workflow configuration, migration, training, and administrative support are included when sold as part of the qualifying MPM software package. Public Cloud, Hybrid Cloud, private data-center, and enterprise-infrastructure deployments are included where the software performs the defined marketing performance function.
What is excluded from the scope?
Advertising media, agency services, stand-alone CRM, generic analytics, and unrelated enterprise software are outside the core market boundary.
The scope excludes paid-media inventory, search and social advertising charges, agency retainers, creative production, events, sponsorships, and other marketing program expenditure that the software plans or measures. It excludes CRM, ERP, EPM, business intelligence, customer data, marketing automation, project management, digital asset management, and collaboration products when they are not sold or configured principally for marketing planning and performance management. Stand-alone consulting is excluded when it does not implement, integrate, or support a qualifying MPM platform.
How Was the Analysis Built?
120+ sources, 40+ company portfolios, 25+ countries, 20+ interviews.
- Primary Research: Primary research includes interviews with MPM software providers, marketing operations leaders, chief marketing officers, finance and FP&A teams, campaign managers, analytics specialists, enterprise architects, procurement managers, implementation partners, and end users. Discussions test planning ownership, budgeting cycles, data integration, attribution, workflow, pricing, deployment, security, adoption, and supplier-selection criteria.
- Desk Research: Desk research reviews official digital-commerce and business-technology statistics, privacy and online-tracking guidance, marketing and financial planning documentation, software product portfolios, company releases, implementation materials, and public technical documentation. Research distinguishes dedicated MPM value from adjacent CRM, EPM, marketing automation, analytics, work-management, and agency-service activity.
- Market-Sizing and Forecasting: Market sizing combines the stated 2026 and 2036 values with software subscription and license value, services attachment, cloud and on-premise deployment, enterprise-size adoption, application mix, end-user demand, implementation timing, renewal behavior, country growth rates, and average platform value. Forecasting also considers movement from manual planning files and point tools toward integrated planning and performance systems.
- Data Validation and Update Cycle: The analysis combines primary interviews with structured review of public company disclosures, official statistics, regulatory material, and sector publications. Forecast interpretation considers market conditions, adoption requirements, competitive positioning, and regional operating context.
Segmentation
What is the report's scope and coverage?
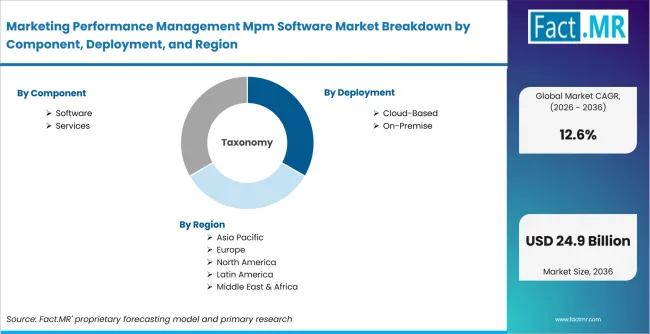
Marketing Performance Management Mpm Software Market Breakdown By Component, Deployment, And Region | Source: Fact.MR
| Attribute | Details |
|---|---|
| Quantitative Units | USD 7.6 Billion in 2026 to USD 24.9 Billion by 2036 at 12.6% CAGR |
| Market Definition | Software subscriptions, licenses, and qualifying implementation or support services used to plan marketing activity, allocate and control budgets, manage campaigns and resources, consolidate performance data, and measure marketing contribution |
| Component | Software; Services |
| Deployment | Cloud-Based; On-Premise |
| Application | Marketing Planning & Budgeting; Campaign Performance Management; Marketing Analytics & ROI Measurement; Others |
| Enterprise Size | Large Enterprises; Small & Medium Enterprises |
| End User | Retail & E-commerce; BFSI; IT & Telecommunications; Others |
| Regions Covered | North America; Europe; Asia Pacific; Central & South America; Middle East & Africa |
| Countries Covered | USA; Japan; Germany; UK; Canada; Australia; South Korea |
| Key Companies Profiled | Adobe Inc.; Salesforce, Inc.; Oracle Corporation; SAP SE; HubSpot, Inc.; Microsoft Corporation; Workfront (Adobe); Planful, Inc.; Allocadia (Uptempo); Aprimo LLC |
| Forecast Period | 2026 to 2036 |
| Approach | Hybrid top-down and bottom-up assessment using marketing software adoption; subscription and license value; services attachment; cloud and on-premise deployment; planning, campaign, analytics, enterprise-size, and end-user demand; country growth rates and supplier validation |
Source: Fact.MR analysis. Updated Aug 5, 2026
How is the market segmented?
-
By Component:
- Software
- Marketing Planning
- Performance Analytics
- Services
- Consulting
- Implementation & Support
- Software
-
By Deployment:
- Cloud-Based
- Public Cloud
- Hybrid Cloud
- On-Premise
- Private Data Centers
- Enterprise Infrastructure
- Cloud-Based
-
By Application
- Marketing Planning & Budgeting
- Budget Allocation
- Forecasting
- Campaign Performance Management
- Multi-Channel Campaigns
- Campaign Optimization
- Marketing Analytics & ROI Measurement
- Attribution Analytics
- KPI Dashboards
- Others
- Marketing Resource Management
- Compliance & Governance
- Marketing Planning & Budgeting
-
By Enterprise Size
- Large Enterprises
- Global Enterprises
- Multinational Corporations
- Small & Medium Enterprises
- Mid-Sized Businesses
- Small Businesses
- Large Enterprises
-
By End User:
- Retail & E-commerce
- Omnichannel Retailers
- Online Marketplaces
- BFSI
- Banking
- Insurance
- IT & Telecommunications
- Software Companies
- Telecom Operators
- Others
- Healthcare
- Manufacturing
- Media & Entertainment
- Consumer Goods
- Government
- Retail & E-commerce
-
By Region:
- North America
- United States
- Canada
- Europe
- Germany
- United Kingdom
- France
- Italy
- Spain
- Asia Pacific
- Japan
- South Korea
- Australia
- Central & South America
- Brazil
- Argentina
- Mexico
- Chile
- Middle East & Africa
- UAE
- Saudi Arabia
- South Africa
- North America
Frequently Asked Questions
Which Component leads the Marketing Performance Management Mpm Software Market?
Which Deployment leads the market?
Which Application leads the market?
Which Enterprise Size leads the market?
Which End User leads the market?
Which companies are active in the market?
Which country records the highest CAGR?
How does the USA perform in the market?
How does Canada perform in the market?
How does the UK perform in the market?
How does Australia perform in the market?
How does Germany perform in the market?
How does Japan perform in the market?
Who worked on this report


Preview the report firsthand - request a free sample
Free SampleGet the brochure for pricing and purchase details
Download PDF