- Market Value (2025): USD 270.8 Mn
- Estimated Value (2026): USD 320.0 Mn
- Forecast Value (2036): USD 1700.0 Mn
- CAGR (2026-2036): 18.2%
What is the Mass-Balanced Polyamides Market forecast to be worth by 2036?
USD 320 million in 2026 to USD 1,700.0 million by 2036 at 18.2% CAGR.
- The mass-balanced polyamides market reached USD 270.8 million in 2025. This shows that lower-carbon and mass-balanced polyamide grades already have a small but active customer base.
- Market value is projected to rise from USD 320.0 million in 2026 to USD 1,700.0 million by 2036. Automotive and electrical uses are expected to create the first wave of demand. Industrial parts and films are likely to follow where the required records match existing resin approvals.
- The market is estimated to grow at an 18.2% CAGR from 2026 to 2036. PA6 and PA66 users are asking for clear proof of lower-carbon raw materials without moving away from resin grades they already use.
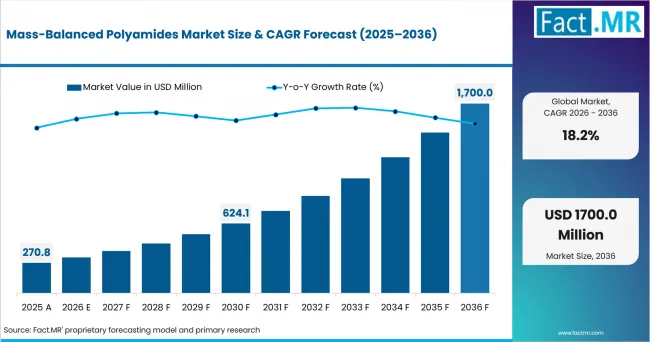
Mass Balanced Polyamides Market Value Analysis | Source: Fact.MR
What are the defining numbers behind Mass-Balanced Polyamides Market growth?
USD 1,380.0 million absolute opportunity by 2036 led by PA6 and Automotive components within their respective segments.
- Demand Drivers in the Market
- Automotive companies are likely to start with connectors and housings that already use polyamide. Under-hood and structural parts may take longer because they require more testing and approval records.
- Electrical and electronics companies will focus on keeping the same insulation and heat performance during a material change. Size stability and fire resistance also remain important during approval.
- Resin pellets and ready-made compounds can bring lower-carbon claims into existing molding and extrusion lines. Compounding and fiber production may follow where the material record stays clear from production to delivery.
- ISCC PLUS and REDcert provide the main proof that raw material claims are tracked through the supply chain. Carbon records and approval from vehicle makers may also support specific programs.
- Key Segments Analyzed
- By Polyamide Type: PA6 is projected to hold 34.0% share in 2026 supported by its broad converting base and established use across automotive, electrical, industrial, and film applications.
- By Application: Automotive Components are estimated to account for 33.0% share in 2026 driven by vehicle programs seeking material-level carbon evidence from component manufacturers.
- By Carbon Route: Bio-feedstock Allocation is anticipated to hold 32.0% share in 2026 owing to the fit of renewable inputs with integrated chemical assets and certified accounting systems.
- By Processing Form: Resin Pellets are forecast to account for 55.0% share in 2026 attributable to their compatibility with established compounding, molding, extrusion, and spinning routes.
- By Certification: ISCC PLUS is estimated to hold 49.0% share in 2026 supported by a chain-of-custody suited to chemical networks sharing intermediates and production assets.
- Analyst Opinion at Fact.MR
- Shambhu Nath Jha, Senior Analyst at Fact.MR, states, "Mass-balanced polyamides are sold within resin groups that customers already use. Sales depend on matching the right polymer grade and keeping clear records of how the lower-carbon material is counted. Companies also have to explain exactly what each claim includes."
- Strategic Implications
- Resin companies can state which plants and polymer grades are covered before selling a product as mass-balanced. The compound type and certificate limits also have to be clear before the claim reaches customers.
- Parts makers may start with high-volume components that already use stable material grades. This keeps testing work lower and makes the benefit easier to repeat across regular orders.
- Compound makers have to match resin certificates with the fillers and reinforcing materials used in the final product. Additives and production scrap also belong in the records because they change the compound being sold.
- Vehicle makers are better placed to record mass-balance claims and product carbon data as separate items. Recycled content and physical bio-based content also need their own approval fields so the claims do not overlap.
The United States is projected to grow at a 20.0% CAGR from 2026 to 2036, led by automotive and electrical uses. Industrial and consumer products may add further demand where local technical support is available. Germany is estimated to record a 19.6% CAGR as its strong compounding base works with strict certification rules. France is forecast to grow at a 19.2% CAGR, supported by its specialty polyamide industry and experience with certified grades. Japan is anticipated to reach an 18.9% CAGR because demanding applications place high value on steady material quality. South Korea is projected to post a 17.8% CAGR, helped by electronics, mobility, and other industrial uses.
How does the Mass-Balanced Polyamides Market break down by segment?
PA6 leads at 34.0% by Polyamide Type, while Automotive components lead at 33.0% by Application in 2026.
Which Polyamide Type dominates?
PA6 holds 34.0% share in 2026.
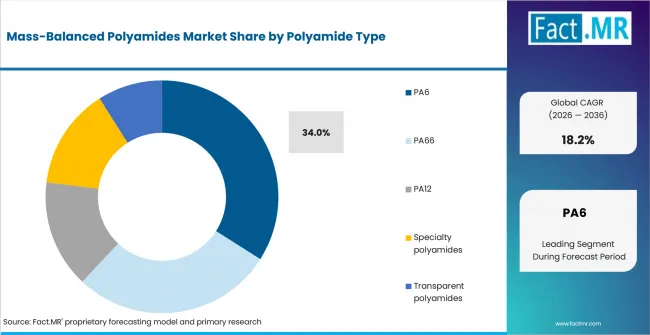
Mass Balanced Polyamides Market Analysis By Polyamide Type | Source: Fact.MR
PA6 is projected to hold 34.0% share in 2026 because it is already widely used in molded parts, electrical items, industrial products, fibers, and films. Many PA6 grades already have approval records, which makes it easier to introduce certified mass-balanced options. Existing production lines can also use these grades without major changes.
What leads the Application segment?
Automotive Components account for 33.0% share in 2026.
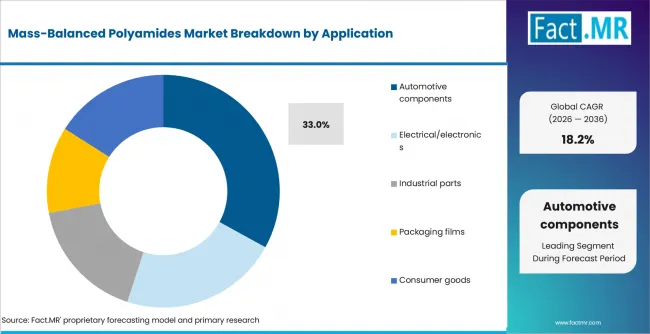
Mass Balanced Polyamides Market Analysis By Application | Source: Fact.MR
Automotive components are anticipated to account for 33.0% share in 2026. Polyamides are already used in connectors, housings, brackets, cable parts, and under-hood systems. Vehicle companies are asking for clearer carbon records from parts makers. Certified grades are easier to approve when strength, heat resistance, and electrical performance stay close to the existing material.
Which Carbon Route holds the largest share?
Bio-feedstock Allocation represents 32.0% share in 2026.
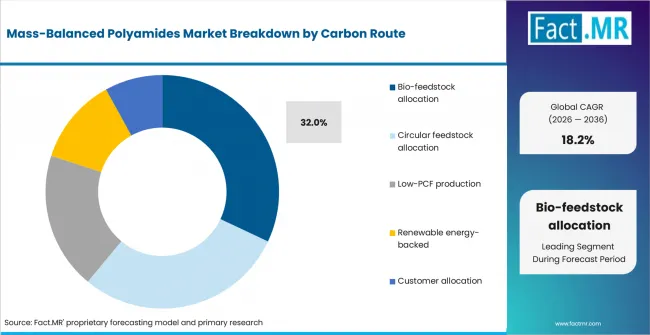
Mass Balanced Polyamides Market Analysis By Carbon Route | Source: Fact.MR
Bio-feedstock allocation is forecast to represent 32.0% share in 2026. This method works well in chemical plants that use the same raw materials and equipment for several products. Certified renewable inputs are linked to an equal amount of polyamide output through an approved record system. The method lowers reported fossil-material use without requiring every pellet to contain separate bio-based material.
What leads the Processing Form segment?
Resin Pellets hold 55.0% share in 2026.
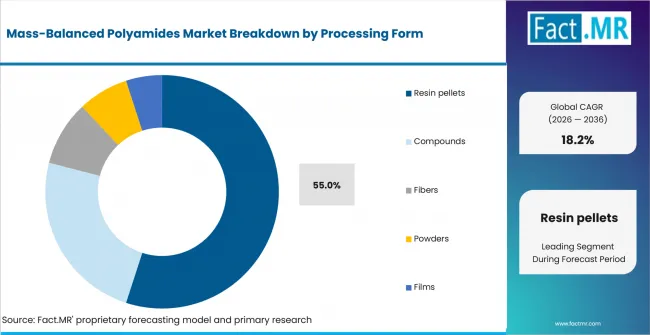
Mass Balanced Polyamides Market Analysis By Processing Form | Source: Fact.MR
Resin pellets are projected to hold 55.0% share in 2026 because they fit many production methods. Companies use them in compounding, molding, extrusion, and fiber making. Certified pellets can enter existing recipes and handling systems with little change. This makes them more widely used than compounds, fibers, powders, and films, which serve more limited applications.
Which Certification dominates?
ISCC PLUS accounts for 49.0% share in 2026.
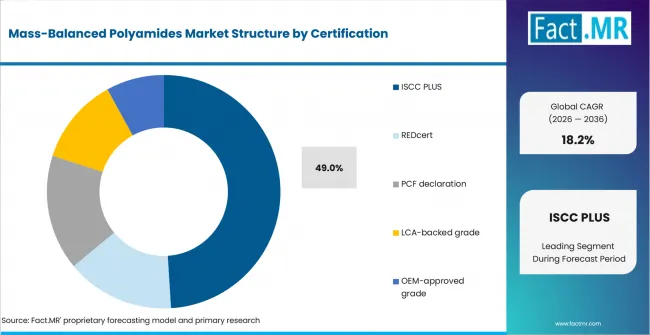
Mass Balanced Polyamides Market Analysis By Certification | Source: Fact.MR
ISCC PLUS is estimated to account for 49.0% share in 2026. It gives chemical companies a clear way to track certified raw materials through shared plants and production steps. The system links approved inputs with the final claimed output. Its wide use also gives producers and customers one common method for checking mass-balanced polyamide claims.
What is accelerating Mass-Balanced Polyamides Market adoption, and what is holding it back?
Grade continuity is expected to drive adoption, while compound accounting and certificate scope are anticipated to restrain approval speed.
Drivers Impact Analysis
| DRIVER | (~) % IMPACT ON CAGR | GEOGRAPHIC RELEVANCE | IMPACT TIMELINE |
|---|---|---|---|
| Automotive material targets | +2.7% | Germany; United States; France; Japan; South Korea | Medium term (2-4 years) |
| PA6 certified supply | +2.4% | Europe and North America | Short term (<= 2 years) |
| Electronics qualification continuity | +2.0% | Japan; South Korea; Germany; United States | Long term (>= 4 years) |
| Compounder chain of custody | +1.6% | Global automotive and industrial supply chains | Medium term (2-4 years) |
| Specialty PA12 programs | +1.3% | Germany; Japan; United States; high-performance industrial markets | Long term (>= 4 years) |
- Automotive material targets: Vehicle manufacturers are expected to translate carbon goals into resin and compound specifications. Long-running parts create a stable base for recurring attributed purchases once a material file has cleared internal approval.
- PA6 certified supply: Certified PA6 production is projected to increase the number of conventional grades that receive a qualifying allocation. Availability near compounding clusters is expected to shorten qualification loops because test batches can move faster into customer trials.
- Electronics qualification continuity: Connectors and housings depend on closely controlled compound properties during molding and service. Electrical parts are expected to favor attribute-based feedstock changes when the approved formulation remains consistent.
Opportunity Impact Analysis
| OPPORTUNITY | (~) % IMPACT ON CAGR | GEOGRAPHIC RELEVANCE | IMPACT TIMELINE |
|---|---|---|---|
| OEM-nominated compounds | +1.5% | Germany; United States; Japan; South Korea | Medium term (2-4 years) |
| Low-PCF and allocation portfolios | +1.3% | Europe; North America; export-oriented Asian markets | Short term (<= 2 years) |
| Traceable film and fiber grades | +1.1% | Japan; South Korea; Europe | Long term (>= 4 years) |
| Circular-input contracts | +0.9% | Global | Long term (>= 4 years) |
- OEM-nominated compounds: A resin producer and compounder are expected to qualify an attributed version of an existing OEM grade. Nomination creates durable demand through a common approved material reference.
- Low-PCF and allocation portfolios: Customers differ on feedstock origin and final product footprint. Circular input and energy evidence are reviewed separately in customer files. A separated portfolio lets customers select one route without mixing claim boundaries or creating conflicting sales documentation.
- Traceable film and fiber grades: Films and fibers are projected to extend mass-balanced polyamides beyond molded parts. Claims must survive extrusion and drawing before the material moves through conversion and custody transfer.
Restraints Impact Analysis
| RESTRAINT | (~) % IMPACT ON CAGR | GEOGRAPHIC RELEVANCE | IMPACT TIMELINE |
|---|---|---|---|
| Complex compound accounting | -1.3% | Global | Short term (<= 2 years) |
| Certificate-grade mismatch | -1.0% | Global | Medium term (2-4 years) |
| OEM change control | -0.8% | Automotive and electrical supply chains | Medium term (2-4 years) |
| Alternative-input constraints | -0.6% | Global | Long term (>= 4 years) |
- Complex compound accounting: Glass fiber and mineral filler change the mass and footprint of the sold compound. Modifiers and pigments add further calculation work before a finished compound claim is passed downstream. Resin-only attribution is not enough once the sold material includes other formulation inputs.
- Certificate-grade mismatch: A site certificate does not automatically cover every polymer line or formulation. Late discovery of scope gaps is expected to slow qualification because customers must reopen the claim review.
- OEM change control: OEM systems are expected to require declarations and drawing updates before approval. Testing and manufacturer approval are anticipated to add more work for safety-sensitive or warranty-sensitive parts.
Which countries carry mass-balanced polyamide adoption?
United States 20.0%, Germany 19.6%, France 19.2%, Japan 18.9%, South Korea 17.8%.
The regional review covers North America, Europe, and Asia Pacific. The country analysis gives more attention to the United States and Germany because vehicle companies and their parts networks are likely to adopt certified mass-balanced materials first. France and Japan are included for their strong specialty resin industries, while South Korea is covered due to demand from electronics and manufacturers.
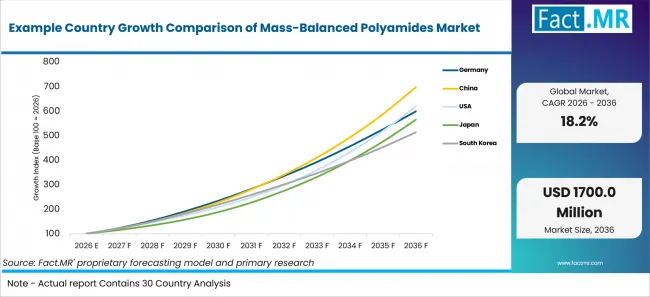
Example Country Growth Comparison Of Mass Balanced Polyamides Market | Source: Fact.MR
| COUNTRY | CAGR |
|---|---|
| United States | 20.0% |
| Germany | 19.6% |
| France | 19.2% |
| Japan | 18.9% |
| South Korea | 17.8% |
What is driving United States growth through 2036?
20.0% CAGR, supported by automotive and electrical programs seeking certified lower-footprint materials.
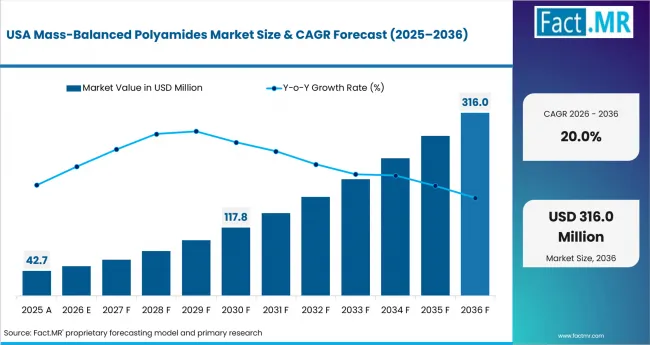
Mass Balanced Polyamides Market Country Value Analysis | Source: Fact.MR
The United States opportunity depends on how quickly certified material claims move from resin producers into approved automotive and electrical parts. Domestic technical support, compound-level carbon records, and clear grade equivalence will shape adoption. The market is expected to record a 20.0% CAGR through 2036, with industrial and consumer applications following after early programs complete qualification.
How will Germany shape supplier requirements?
19.6% CAGR, driven by established compounding networks and strict material documentation.
Germany’s market reflects the needs of an established automotive and compounding base. Customers are likely to review mass balance, low-PCF production, LCA evidence, and OEM approval as separate parts of the same material file. Demand is projected to expand at a 19.6% CAGR from 2026 to 2036 as suppliers align certificate scope with the exact reinforced grade purchased by component manufacturers.
Why is France a natural fit for mass-balanced polyamides?
19.2% CAGR, supported by specialty polyamide production and existing PA12 applications.
France benefits from an established specialty polyamide base, particularly materials linked to castor-derived PA12. Automotive, sporting-goods, and other high-value applications already use specialty grades with detailed performance records. The market is estimated to grow at a 19.2% CAGR through 2036 as certified attributed materials move into qualified products without requiring major changes to existing performance specifications.
What supports Japan’s specialty polyamide outlook?
18.9% CAGR, owing to high-reliability applications and controlled material qualification.
Japan’s market is shaped by long approval cycles across automotive and electronics programs where consistency carries more weight than rapid substitution. Attributed PA12 and other specialty grades are expected to progress when documentation is complete and supply changes are tightly controlled. The market is anticipated to record an 18.9% CAGR from 2026 to 2036 as approved materials move into repeat production.
How is South Korea developing mass-balanced polyamide demand?
17.8% CAGR, supported by electronics, mobility, and export-oriented component production.
South Korea is expected to deploy mass-balanced polyamides through electronics, mobility, and export-focused component programs. Material claims must meet strict electrical, thermal, dimensional, and appearance requirements, which makes local validation important. The market is forecast to post a 17.8% CAGR through 2036 as compounders transfer allocation evidence into the exact grades purchased by component manufacturers.
Who leads the Mass-Balanced Polyamides Market?
Evonik and BASF hold strong positions in mass-balanced and lower-carbon polyamides. Envalior GmbH adds strength through its bio-based specialty polyamides.
Evonik supplies lower-carbon polyamide grades for automotive, electrical, and industrial uses. BASF supports customers with certified mass-balance options and clear carbon records for engineering plastics. These companies compete through trusted certificates, matching grades, clear test records, and support during product approval.
Through 2036, competition is likely to focus on trusted material records, exact grade matching, clear carbon data, and local help during customer testing.
Which companies are the key providers?
The company set includes Evonik and BASF alongside Envalior GmbH for polyamide and lower-footprint materials evidence and DOMO Chemicals complete the profiled company group.
- Evonik
- BASF
- Envalior GmbH
- DOMO Chemicals
Bibliography
- BASF. (2024, April 22). BASF now offering polyamides for the textile industry according to Recycled Claim Standard (RCS).
- Evonik Industries AG. (2025, October 1). Evonik to showcase latest innovations and sustainability initiatives in polymer chemistry at K 2025.
- European Commission. (2025, February 26). The Clean Industrial Deal: A joint roadmap for competitiveness and decarbonisation.
- HM Revenue & Customs. (2025, November 26). Plastic Packaging Tax—mass balance approach and removal of pre-consumer plastic. UK Government.
- U.S. Department of Energy, Industrial Efficiency and Decarbonization Office. (2025, January). Scaling sustainable chemistry for an industrial transformation forum and roundtable.
This Report Addresses
- The report reviews bio-based input allocation, circular input allocation, and low-carbon production as separate routes. Renewable-energy support and customer-specific allocation are also covered on their own.
- The regional section compares the United States and Germany within a study of more than 30 countries. France and Japan are included for their strong specialty polyamide industries. South Korea is covered because of demand from electronics and mobility products.
- The company review covers Evonik, BASF, and Envalior GmbH for their work in polyamides and lower-carbon materials. DOMO Chemicals complete the company group.
- The product review includes PA6, PA66, and PA12. Specialty and transparent polyamides are also studied across five product forms.
- The application section focuses on automotive parts and electrical or electronic products, where material approval is important. Industrial parts, packaging films, and consumer goods are covered as smaller areas of use.
- The market forecast is based on the amount of approved raw material available from certified plants. Final compound testing, vehicle-maker approval, and material tracking are reviewed before any higher price linked to the mass-balanced claim is included.
What does the Mass-Balanced Polyamides Market cover?
Attributed and lower-PCF polyamides sold under an auditable product and site claim with quantity records.
The report measures five source polyamide types across application and carbon route within the defined market boundary. Processing form and certification are evaluated as separate classification fields. It captures qualifying polymer and compound revenue under auditable attribution routes. Finished components and downstream product value remain outside the sizing boundary to avoid overstating market size.
What is included in the scope?
Eligible supply includes certified mass-balanced resin and the defined low-PCF routes used in qualifying transactions. Energy-backed routes and LCA-backed grades are reviewed with PCF and OEM-approved routes.
PA6 and PA66 are included when a qualifying route attaches to the sold material. PA12 and Specialty polyamides are included under the same condition across specialty applications. Transparent polyamides are included when the claim applies to pellets or compounds. Fibers and films are counted when custody records remain attached to the material. Direct resin and compounder-mediated transactions are captured without double counting the same polymer mass.
What is excluded from the scope?
Ordinary polyamide sales and allocation claims without certification are excluded from the market boundary. Finished-product value is excluded to prevent double counting across molded parts and downstream goods.
A certified plant's conventional output remains outside the market unless an eligible attribute is assigned to the sale. Mechanical recycling and bio-based content are counted only where they fit the defined product route.
How Was the Analysis Built?
The analysis draws on 120+ sources, 35+ company portfolios, 25+ countries, and more than 20 industry interviews.
- Primary Research: Primary research includes discussions with manufacturers, service providers, technology developers, distributors, end users, procurement teams, and subject-matter experts. These conversations examine purchasing priorities, product adoption, operational challenges, approval requirements, competitive positioning, and the factors that influence wider market acceptance.
- Desk Research: Desk research covers government statistics, regulatory publications, company filings, trade data, technical studies, industry associations, standards, public policy, and other authoritative sources. Every source used in the analysis is documented in the bibliography.
- Market Sizing and Forecasting: Market estimates combine historical performance, demand indicators, pricing and volume trends, segment shares, company participation, country-level growth, adoption patterns, investment activity, and barriers to market expansion.
- Data Validation and Update Cycle: Findings are validated by comparing primary interviews with public data, company activity, regulatory changes, trade patterns, and industry developments. Regular updates review new product launches, capacity changes, partnerships, approvals, procurement trends, and shifts in commercial adoption.
What is the report’s scope and coverage?
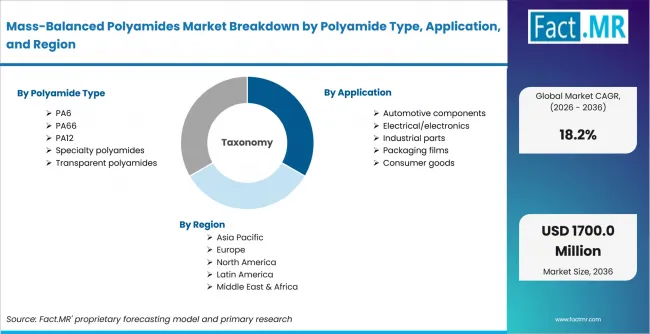
Mass Balanced Polyamides Market Breakdown By Polyamide Type, Application, And Region | Source: Fact.MR
| Attribute | Details |
|---|---|
| Quantitative Units | USD million in 2026 to USD million by 2036 at a CAGR |
| Market Definition | PA6, PA66, PA12, specialty polyamides, and transparent polyamides sold through certified mass-balanced, attributed, or qualifying lower-PCF routes |
| Polyamide Type | PA6; PA66; PA12; Specialty Polyamides; Transparent Polyamides |
| Application | Automotive Components; Electrical/Electronics; Industrial Parts; Packaging Films; Consumer Goods |
| Carbon Route | Bio-feedstock Allocation; Circular Feedstock Allocation; Low-PCF Production; Renewable Energy-backed; Customer Allocation |
| Processing Form | Resin Pellets; Compounds; Fibers; Powders; Films |
| Certification | ISCC PLUS; REDcert; PCF Declaration; LCA-backed Grade; OEM-approved Grade |
| Regions Covered | North America; Europe; Asia Pacific; Latin America; Middle East and Africa |
| Countries Covered | United States; Germany; France; Japan; South Korea |
| Key Companies Profiled | t |
| Forecast Period | 2026 to 2036 |
| Approach | Hybrid top-down and bottom-up approach using certified plant availability; approved polyamide grades; carbon-route allocation; application demand; processing-form adoption; chain-of-custody records; compound-level carbon accounting; and OEM qualification; |
How is the market segmented?
-
By Polyamide Type
- PA6
- PA66
- PA12
- Specialty polyamides
- Transparent polyamides
-
By Application
- Automotive components
- Electrical/electronics
- Industrial parts
- Packaging films
- Consumer goods
-
By Carbon Route
- Bio-feedstock allocation
- Circular feedstock allocation
- Low-PCF production
- Renewable energy-backed
- Customer allocation
-
By Processing Form
- Resin pellets
- Compounds
- Fibers
- Powders
- Films
-
By Certification
- ISCC PLUS
- REDcert
- PCF declaration
- LCA-backed grade
- OEM-approved grade
-
By Region
- North America
- United States
- Europe
- Germany
- France
- Asia Pacific
- Japan
- South Korea

