- Market Value (2025): USD 614.7 Mn
- Estimated Value (2026): USD 638.1 Mn
- Forecast Value (2036): USD 926.5 Mn
- CAGR (2026-2036): 3.8%
What is the Military Hats Market forecast to be worth by 2036?
USD 638.1 million in 2026 to USD 926.6 million by 2036 at a 3.8% CAGR.
- The military hats market was valued at USD 614.7 million in 2025, with helmets and army issue forming the core of spending.
- Revenue will move from USD 638.1 million in 2026 to USD 926.5 million by 2036 as allied forces recruit more soldiers and refresh protective kit.
- Over the decade the market will compound at 3.8% CAGR, since larger defense budgets in Europe and the Indo-Pacific widen issue volumes.
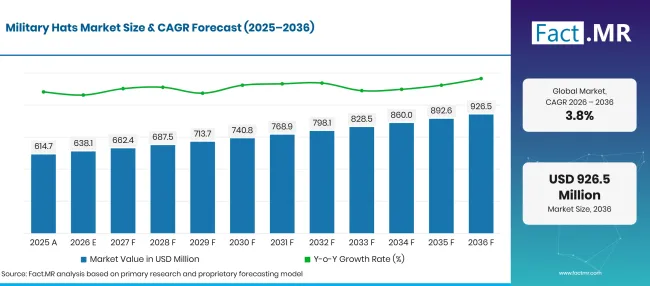
Factmr Military Hats Market Forecast Global | Source: Fact.MR
| Year | Basis | Market Value (USD million) |
|---|---|---|
| 2025 | Actual | 614.7 |
| 2026 | Estimate | 638.1 |
| 2036 | Forecast | 926.5 |
| CAGR 2026 to 2036 | Forecast period | 3.8% |
Source: Fact.MR analysis. Updated Oct 22, 2026
What are the defining numbers behind Military Hats Market growth?
Between 2026 and 2036, USD 288.5 million in new value will be added, much of it tied to helmet upgrades and army headcount.
- Demand Drivers in the Market
- Defense budgets are rising across most regions. SIPRI reported that world military expenditure grew 2.9% in real terms to USD 2,887 billion in 2025, with Europe up 14% to USD 864 billion [1]. Part of every increase funds personal equipment, and headwear is issued to each new recruit.
- NATO members have agreed a higher spending floor. At The Hague in June 2025, Allies committed to invest 5% of GDP annually on defence by 2035, with at least 3.5% on core requirements [2]. A longer funding horizon lets ministries plan multi-year helmet and uniform buys.
- Troop targets are now written into law. Germany’s new military service plan, passed by the Bundestag in December 2025 and planned to take effect in January 2026, aims for more than 260,000 active soldiers and 200,000 reservists by 2035 [3]. Each extra soldier needs a helmet, a beret or cap and a field hat.
- Domestic sourcing rules shape where orders go. U.S. defense acquisition rules restrict purchases of clothing and of synthetic fabric that is not produced in the United States, with limited exceptions [4]. Qualified local mills and cap makers therefore hold a protected position with the Department of Defense.
- Pattern and helmet changes trigger fresh issue. When a force adopts a new camouflage or a lighter helmet shell, older stock becomes non-compliant and must be replaced across whole units.
- Key Segments Analyzed
- By Product Type: Helmets will hold 38.5% share in 2026, since each ballistic shell costs many times more than a cloth cap.
- By Material: Synthetic will account for 44.2% share in 2026 on the strength of nylon, polyester and aramid used in both helmets and field caps.
- By End-User: Army will capture 48.3% share in 2026, given that ground forces outnumber naval and air personnel in most countries.
- By Distribution Channel: Military Surplus Stores will take 35.8% share in 2026 through steady sales of issue-pattern headwear to reservists, cadets and veterans.
- Analyst Opinion at Fact.MR
- Shambhu Nath Jha, Principal Consultant at Fact.MR, states, “Value in this market follows the helmet, while volume follows the beret and the cap. Recruiting drives in Canada, the United States and Australia, plus troop targets in Germany and Turkey, will add heads to equip every year to 2036. Suppliers that clear national sourcing rules and can switch fabric or shell specifications quickly will win the repeat orders.”
- Strategic Implications
- Helmet makers should keep lighter shell materials and accessory rails ready for testing, as ministries replace older helmets in tranches tied to new standards.
- Soft headwear producers should document fiber content, colorfastness and country of origin for every model, so contracting officers can match items to sourcing rules [4].
- Surplus and specialty retailers should hold current issue patterns in full size runs, given that reservists and cadets often buy their own replacements.
- Fabric mills should qualify flame-resistant and near-infrared-compliant synthetic blends early, since a new camouflage standard can change cap and helmet cover orders at short notice.
Turkey heads the group at 4.8% as a large conscript force and a growing domestic defense industry keep issue volumes high. South Korea follows at 4.4%, where a budget rise of 7.5% for 2026 funds soldier equipment. Canada posts 3.9% on its strongest recruiting in three decades. Growth in the United States will reach 3.6%, resting on a vast force and strict domestic sourcing. Australia records 3.1% with a larger defence budget for 2026-27. Germany closes the list at 2.7%, as a big installed base of issued headwear tempers new demand from its troop build-up.
How does the Military Hats Market break down by segment?
Helmets will lead Product Type at 38.5%; Synthetic will top Material at 44.2%; Army will head End-User at 48.3%; Military Surplus Stores will hold first place in Distribution Channel at 35.8%.
Which Product Type comes first?
Helmets take 38.5% of 2026 sales.
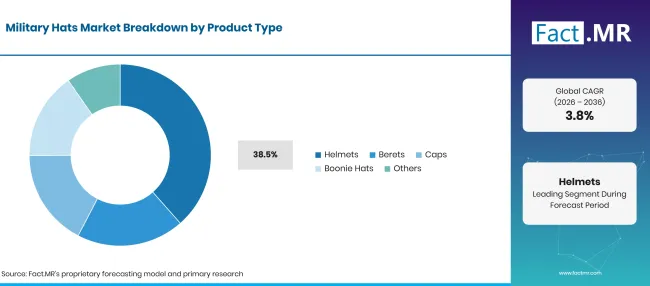
Factmr Military Hats Market Breakdown Product Type | Source: Fact.MR
| Product Type | Share (2026) |
|---|---|
| Helmets (Leading segment) | 38.5% |
| Other segments combined | 61.5%* |
| Total | 100.0% |
Source: Fact.MR analysis. Updated Oct 22, 2026
Protective helmets carry the heaviest price per unit of any headwear a soldier receives. A ballistic shell needs layered fiber, a suspension system and mounts for night vision and communications, and buyers test every lot. Makers of military helmets also sell spare pads, covers and upgrade kits through the service life. In January 2025, Team Wendy Ceradyne received a delivery order worth about USD 18 million from the Defense Logistics Agency for the Next Generation Integrated Head Protection System [5]. Berets mark unit identity and are bought in steady lots. Caps cover daily duty, and boonie hats serve hot-climate and training use at a lower unit cost.
What leads the Material segment?
Synthetic materials make up 44.2% of 2026 sales.
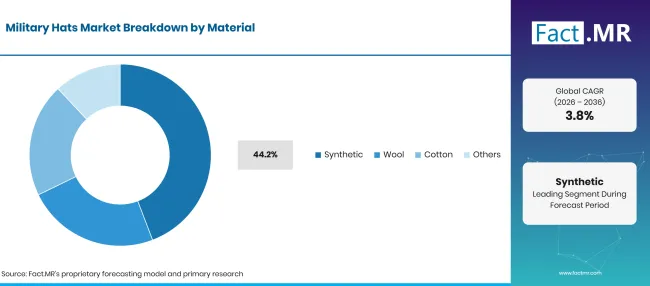
Factmr Military Hats Market Breakdown Material | Source: Fact.MR
| Material | Share (2026) |
|---|---|
| Synthetic (Leading segment) | 44.2% |
| Other segments combined | 55.8%* |
| Total | 100.0% |
Source: Fact.MR analysis. Updated Oct 22, 2026
Fiber engineering decides how light and protective a helmet can be. Shells use aramid fiber or ultra-high molecular weight polyethylene, and covers and caps use ripstop blends that dry quickly and hold camouflage prints. Wool remains the fabric of choice for berets and dress caps, because felted wool keeps its shape and color for years. Cotton suits field caps and boonie hats in hot climates, often blended with nylon for strength and abrasion resistance.
How does End-User shape demand?
Army buyers account for 48.3% of 2026 sales.
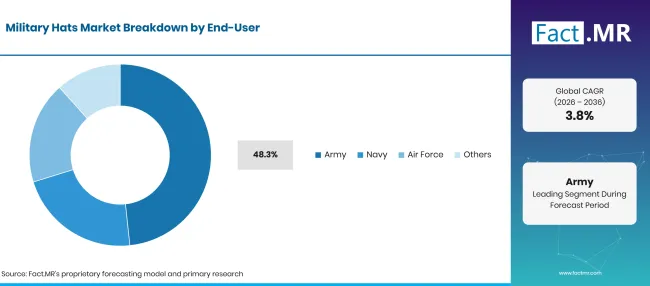
Factmr Military Hats Market Breakdown End User | Source: Fact.MR
| End-User | Share (2026) |
|---|---|
| Army (Leading segment) | 48.3% |
| Other segments combined | 51.7%* |
| Total | 100.0% |
Source: Fact.MR analysis. Updated Oct 22, 2026
Ground troops wear helmets in training and on operations, and they need more styles than sailors or aircrew. A soldier may hold a combat helmet, a beret, a patrol cap and a boonie hat at once, and each item follows its own replacement cycle. Navy demand centers on service caps, working caps and deck helmets. Air forces buy flight helmets, which cost more per unit but serve far fewer crew. Both services follow fixed uniform rules, so their orders change mainly when a new pattern or dress standard is issued.
What supports Military Surplus Stores within Distribution Channel?
Military Surplus Stores represent 35.8% of 2026 sales.
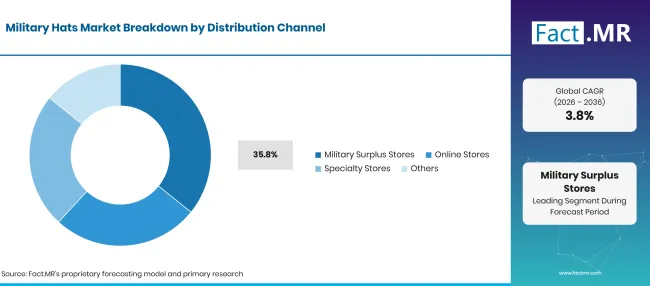
Factmr Military Hats Market Breakdown Distribution Channel | Source: Fact.MR
| Distribution Channel | Share (2026) |
|---|---|
| Military Surplus Stores (Leading segment) | 35.8% |
| Other segments combined | 64.2%* |
| Total | 100.0% |
Source: Fact.MR analysis. Updated Oct 22, 2026
Reservists, cadets, veterans and outdoor users look for authentic issue-pattern headwear at a fair price, and surplus stores keep both released stock and new production in common sizes. Personnel often replace a lost beret or cap from their own pocket instead of waiting for stores to reissue it. Online stores widen reach to buyers far from a base, and they let brands list full size runs and patterns. Specialty stores serve officers and regiments that want fitted dress caps and badges. Some outlets also stock items linked to personal protective equipment, such as bump caps and helmet covers.
What is accelerating Military Hats Market adoption, and what is holding it back?
Larger defense budgets, recruiting drives and new helmet standards are lifting orders across both soft and protective headwear. Tight equipment budgets that favor weapons and vehicles, long test cycles for helmets and swings in fiber prices slow purchases.
Drivers Impact Analysis
| DRIVER | (~) % IMPACT ON CAGR | GEOGRAPHIC RELEVANCE | IMPACT TIMELINE |
|---|---|---|---|
| Higher defense budgets in Europe and the Indo-Pacific funding personal equipment | +1.2% | Western Europe, East Asia, North America | Short term (<= 2 years) |
| Recruiting drives and troop targets widening the base of personnel to equip | +0.9% | Global | Medium term (2-4 years) |
| Helmet modernization toward lighter shells with accessory mounts | +0.7% | North America, Western Europe | Medium term (2-4 years) |
| Camouflage and uniform rule changes that make serviceable headwear non-compliant | +0.4% | Global | Long term (>= 4 years) |
Source: Fact.MR analysis. Updated Oct 22, 2026
Opportunity Impact Analysis
| OPPORTUNITY | (~) % IMPACT ON CAGR | GEOGRAPHIC RELEVANCE | IMPACT TIMELINE |
|---|---|---|---|
| Local sourcing rules and multi-year framework contracts for domestic producers | +0.5% | North America, Middle East & Africa | Medium term (2-4 years) |
| Flame-resistant and near-infrared-compliant synthetic headwear | +0.4% | North America, Western Europe | Medium term (2-4 years) |
| Online and surplus sales to reservists, cadets and veterans | +0.3% | North America, Western Europe | Short term (<= 2 years) |
| Cadet and reserve programs expanding uniform issue | +0.2% | Global | Long term (>= 4 years) |
Source: Fact.MR analysis. Updated Oct 22, 2026
Restraints Impact Analysis
| RESTRAINT | (~) % IMPACT ON CAGR | GEOGRAPHIC RELEVANCE | IMPACT TIMELINE |
|---|---|---|---|
| Budget priority going to weapons, vehicles and munitions ahead of uniform items | -0.3% | Global | Short term (<= 2 years) |
| Long ballistic testing and approval cycles for new helmets | -0.3% | Global | Medium term (2-4 years) |
| Swings in aramid, nylon, wool and cotton prices squeezing supplier margins | -0.2% | Global | Short term (<= 2 years) |
Source: Fact.MR analysis. Updated Oct 22, 2026
Which countries are scaling the Military Hats Market through 2036?
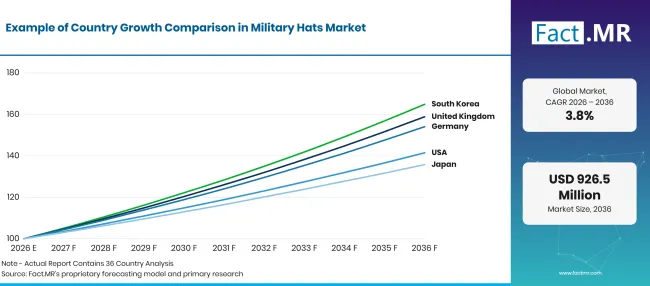
Factmr Military Hats Market Growth Index | Source: Fact.MR
| Country | CAGR (2026 to 2036) |
|---|---|
| Turkey | 4.8% |
| South Korea | 4.4% |
| Canada | 3.9% |
| United States | 3.6% |
| Australia | 3.1% |
| Germany | 2.7% |
Source: Fact.MR analysis. Updated Oct 22, 2026
What supports Turkey’s adoption?
4.8% CAGR, driven by a large conscript force and rising military spending.
SIPRI reported that Turkey’s military expenditure reached USD 30.0 billion in 2025, an increase of 7.2% from 2024 [1]. NATO estimates put Turkish military personnel at about 494,500 in 2025 [6]. Short conscript terms mean a constant flow of new soldiers, and each intake receives a full set of headwear.
How is South Korea scaling demand?
4.4% CAGR, backed by a 2026 defense budget increase and steady conscript intake.
The Ministry of National Defense set the 2026 defense budget at KRW 65,864 billion, up 7.5% from 2025, the sharpest rise of the past five years [7]. Conscription keeps the army as the main buyer of helmets, caps and field hats. A larger budget gives the army room to renew helmets and field kit on schedule.
How is Canada developing demand?
3.9% CAGR, on the back of record recruitment and a larger defence budget.
National Defence reported that the Canadian Armed Forces enrolled 7,310 Regular Force members in fiscal 2025/26, beating a target of 6,957 and marking the strongest intake in more than 30 years [8]. SIPRI put Canada’s military spending at USD 37.5 billion in 2025, or 1.6% of GDP [1]. New members need full uniform sets, including berets, toques and helmets.
How does the United States perform?
3.6% CAGR, reflecting a vast force and Berry Amendment sourcing rules.
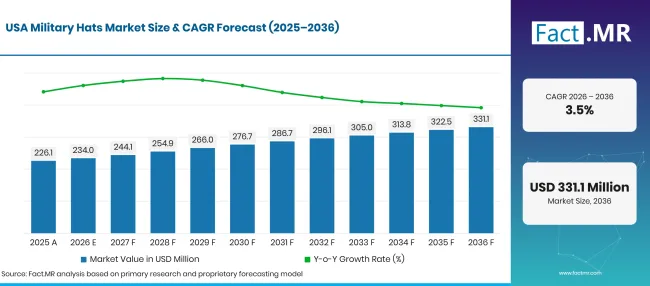
Factmr Military Hats Market Forecast Usa | Source: Fact.MR
SIPRI recorded a 7.5% fall in U.S. military spending to USD 954 billion in 2025, mainly because overseas military aid from supplemental appropriations fell sharply [1]. Recruiting has recovered. The U.S. Army met its fiscal 2025 recruiting goals four months early, with more than 61,000 future soldiers under contract [9]. Domestic cap makers and helmet producers fill these orders under federal sourcing law.
What supports Australia’s adoption?
3.1% CAGR, helped by higher defence funding under the 2026 National Defence Strategy.
The Department of Defence set total defence funding at AUD 63.4 billion for 2026-27, with an additional AUD 53 billion committed over the next decade [10]. Part of that sum goes to the workforce, where a larger force raises demand for slouch hats, field hats and helmets. Hot climates keep wide-brim field hats in high use.
What is supporting Germany’s adoption?
2.7% CAGR, as a large existing kit base offsets new hiring.
SIPRI reported that German military spending rose 24% to USD 114 billion in 2025, reaching 2.3% of GDP [1]. The Bundeswehr counted 186,356 personnel in uniform as of 31 August 2026 [11]. Much of the new money goes to vehicles, aircraft and munitions. Headwear demand grows with the gradual rise in headcount and with helmet renewal.
Who leads the Military Hats Market?
Competition splits by product. Helmet specialists compete on weight, ballistic protection and system integration.
Gentex Corporation, through its Ops-Core brand, supplies ballistic and aviation helmet systems, and in July 2026 it received a U.S. Army contract for HGU-56/P rotary wing helmets with a maximum potential value of about USD 44.8 million [12]. Avon Technologies supplies ballistic helmets through Team Wendy Ceradyne, while MKU offers ballistic helmets to forces in many countries. Soft headwear makers compete on specification compliance and delivery. Bernard Cap produces dress uniform headwear in Florida to U.S. Government specifications. TONAK makes military berets in the Czech Republic. Propper International sells military hats, caps and boonie hats, and Helikon-Tex lists headwear within its tactical clothing range. Suppliers that pass national sourcing checks and adapt quickly to new patterns and helmet standards will gain ground.
Which companies are the key providers?
Key companies include Gentex Corporation (Ops-Core); Avon Technologies plc (Team Wendy); MKU Limited; Bernard Cap; TONAK a.s.; Propper International; and Helikon-Tex.
- Gentex Corporation (Ops-Core)
- Avon Technologies plc (Team Wendy)
- MKU Limited
- Bernard Cap
- TONAK a.s.
- Propper International
- Helikon-Tex
Bibliography
- [1] Stockholm International Peace Research Institute. (2026, April). Trends in World Military Expenditure, 2025.
- [2] North Atlantic Treaty Organization. (2025, June 25). The Hague Summit Declaration.
- [3] Federal Government of Germany. (2025, December 5). New attractive military service plan passed.
- [4] Electronic Code of Federal Regulations. (2026, October 15). 48 CFR 225.7002-1: Restrictions.
- [5] Avon Technologies plc. (2025, January 6). Next Generation Integrated Head Protection System Delivery Order.
- [6] North Atlantic Treaty Organization. (2025, August). Defence Expenditure of NATO Countries (2014-2025).
- [7] Ministry of National Defense, Republic of Korea. (2026). Status of the defense budget over the last 5 years.
- [8] National Defence, Government of Canada. (2026, April 20). Canadian Armed Forces reach highest recruitment in 30 years.
- [9] U.S. Army. (2025, June 3). Army meets fiscal year 2025 recruiting goals four months early.
- [10] Department of Defence, Australia. (2026, April). 2026 National Defence Strategy: Budget.
- [11] Bundeswehr. (2026, August 31). Personalzahlen der Bundeswehr [Personnel figures of the Bundeswehr].
- [12] Gentex Corporation. (2026, July 9). Gentex Awarded U.S. Army Contract for HGU-56/P Rotary Wing Helmet Systems and Sustainment Support.
This Report Answers
- How do helmets, berets, caps and boonie hats split military headwear spending?
- Which material, end-user and channel lead their segments, and what buyer needs explain their 2026 shares?
- How do budgets, recruiting and conscription shape demand in the six listed countries?
- Where do helmet specialists and soft headwear makers compete, and on what terms?
- Which sourcing rules and helmet standards decide which suppliers can bid?
What does the Military Hats Market cover?
Military headwear in this study ranges from ballistic and non-ballistic helmets to berets, patrol and service caps, and boonie hats. Each item is built to a military or uniform specification.
Demand is tracked for army, navy and air force users. Revenue is counted at the manufacturer level, whether items reach troops through issue stores, surplus outlets, online sellers or specialty shops.
What is included in the scope?
Combat helmets, flight and aircrew helmets, and helmet covers sold with the helmet count in full. Wool berets, synthetic and cotton caps, and boonie hats made to issue patterns are also included.
Badges and trims fitted at the factory are valued with the hat. Where headwear is sold inside a complete uniform set, only the headwear share is recorded.
What is excluded from the scope?
Civilian fashion hats, costume and replica items, and outdoor caps made without a military specification fall outside the boundary. Headwear for police, fire and private security services is also left out.
Night vision devices, headsets and other electronics mounted on helmets are excluded, as are insignia sold separately and raw fabric or fiber sold before cutting.
How Was the Analysis Built?
The analysis draws on 120+ sources, 35+ company portfolios, 25+ countries, and more than 20 industry interviews.
- Primary Research: Primary research includes discussions with manufacturers, service providers, technology developers, distributors, end users, and subject-matter experts. These conversations examine purchasing priorities, product adoption, operational challenges, approval requirements, competitive positioning, and the factors that influence wider market acceptance.
- Desk Research: Desk research covers government statistics, regulatory publications, company filings, trade data, technical studies, industry associations, standards, public policy, and other authoritative sources. Every source used in the analysis is documented in the bibliography.
- Market Sizing and Forecasting: Market estimates combine historical performance, demand indicators, pricing and volume trends, segment shares, company participation, country-level growth, adoption patterns, investment activity, and barriers to market expansion.
- Data Validation and Update Cycle: Findings are validated by comparing primary interviews with public data, company activity, regulatory changes, trade patterns, and industry developments. Regular updates review new product launches, capacity changes, partnerships, approvals, and shifts in commercial adoption.
Segmentation
What is the report’s scope and coverage?
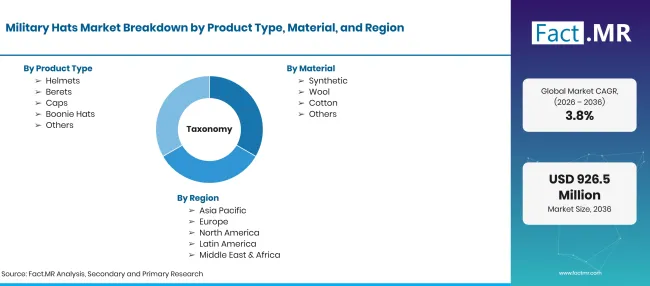
Factmr Military Hats Market Taxonomy | Source: Fact.MR
| Attribute | Details |
|---|---|
| Quantitative Units | USD million in 2026 to USD million by 2036 at CAGR |
| Market Definition | Headwear designed and procured for armed forces, including combat and protective helmets, berets, caps and boonie hats, valued at manufacturer selling price. |
| Product Type | Helmets; Berets; Caps; Boonie Hats |
| Material | Synthetic; Wool; Cotton |
| End-User | Army; Navy; Air Force |
| Distribution Channel | Military Surplus Stores; Online Stores; Specialty Stores |
| Regions Covered | North America; Latin America; Western Europe; Eastern Europe; East Asia; South Asia & Pacific; Middle East & Africa |
| Countries Covered | Turkey; South Korea; Canada; United States; Australia; Germany |
| Companies Profiled | Gentex Corporation (Ops-Core); Avon Technologies plc (Team Wendy); MKU Limited; Bernard Cap; TONAK a.s.; Propper International; Helikon-Tex |
| Forecast Period | 2026 to 2036 |
| Approach | Hybrid top-down and bottom-up approach using armed forces personnel and recruiting intake by country; helmet and soft headwear issue cycles; material and channel mix; and supplier portfolio review. |
Source: Fact.MR analysis. Updated Oct 22, 2026
How is the market segmented?
-
By Product Type
- Helmets
- Berets
- Caps
- Boonie Hats
-
By Material
- Synthetic
- Wool
- Cotton
-
By End-User
- Army
- Navy
- Air Force
-
By Distribution Channel
- Military Surplus Stores
- Online Stores
- Specialty Stores
-
By Region
- North America
- Latin America
- Western Europe
- Eastern Europe
- East Asia
- South Asia & Pacific
- Middle East & Africa
Frequently Asked Questions
How large is the military hats market in 2026?
What growth rate will the military hats market record from 2026 to 2036?
Which product type leads the military hats market?
Which material leads the military hats market?
Which end-user contributes the most to the military hats market?
Which distribution channel leads the military hats market?
Which country will record the strongest growth in the military hats market?
Who are the main companies in the military hats market?
Who worked on this report


Preview the report firsthand - request a free sample
Free SampleGet the brochure for pricing and purchase details
Download PDF