- Market Value (2025): USD 7.6 Bn
- Estimated Value (2026): USD 10.7 Bn
- Forecast Value (2036): USD 339.4 Bn
- CAGR (2026-2036): 41.3%
What is the ModelOps Market forecast to be worth by 2036?
USD 10.7 billion in 2026 to USD 339.4 billion by 2036, at 41.3% CAGR.
- The ModelOps Market crossed a valuation of USD 7.6 billion in 2025 as enterprise AI estates moved beyond small pilot portfolios.
- Demand is projected to increase from USD 10.7 billion in 2026 to USD 339.4 billion by 2036 among enterprise operations teams.
- The market is forecast to record a 41.3% CAGR from 2026 to 2036 as platform teams and risk officers formalize AI lifecycle control.
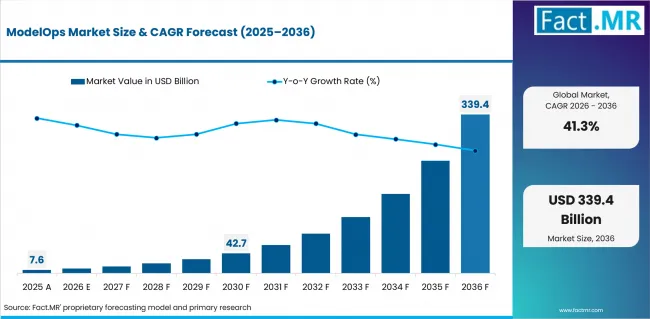
Modelops Market Market Value Analysis | Source: Fact.MR
What are the defining numbers behind ModelOps Market growth?
USD 328.7 billion absolute opportunity by 2036, led by Software and Cloud with BFSI demand.
- Demand Drivers in the Market
- AI platform teams need one asset inventory to control predictive models and agents that enter production through different toolchains.
- Model risk officers need traceable approvals supported by policy evidence that follows every material change from validation into deployment and monitoring.
- MLOps engineers need reliable runtime monitoring owing to drift, performance changes and cost exposure that become harder to isolate within distributed AI estates.
- Compliance teams need exportable audit evidence shaped by multi-cloud deployment and third-party model use in regulated business processes and customer decisions.
- Key Segments Analyzed
- By Component: Software is expected to hold 34.5% share in 2026, driven by demand for common inventory, policy automation and runtime evidence.
- By Deployment: Cloud is projected to account for 41.8% share in 2026, supported by elastic infrastructure and centralized access for distributed AI teams.
- By Organization Size: SMEs are anticipated to capture 47.8% share in 2026, owing to managed tooling and lower entry barriers for production monitoring.
- By Application: Workflow Automation is estimated to represent 31% share in 2026, shaped by agent workflows that require controls for prompts and tool calls.
- By End Use: BFSI is forecast to account for 30.4% share in 2026, attributable to model risk review and evidence-heavy approval processes.
- Analyst Opinion at Fact.MR
- Shambhu Nath Jha, Senior Analyst at Fact.MR states, “ModelOps is becoming the control record for AI estates that no single development platform owns. Adoption is expected to favor systems that inventory every AI asset and connect approval evidence to runtime behavior. Providers should combine open integration and policy automation with clear operating cost visibility throughout production AI portfolios.”
- Strategic Implications
- CIOs should require one enterprise inventory that covers predictive models, generative systems and externally sourced AI services in production environments.
- Model risk heads should connect review evidence to release gates so approved conditions remain visible after a model reaches production.
- Inconsistent signals weaken cross-platform monitoring and incident response, so platform engineering leaders should standardize monitoring fields before adding more AI runtimes.
- Procurement teams should test connector depth and policy export functions before selecting platforms that promise broad control for mixed AI estates.
DataRobot expanded its enterprise AI governance coverage in July 2026 to support policy enforcement and traceability beyond public cloud environments. The release addressed on-premise and edge deployments including isolated and sovereign environments where platform-specific governance leaves operational gaps. The move reflects a wider shift toward control layers that follow AI assets between execution boundaries instead of stopping at one cloud account.
India is expected to record 43.1% CAGR between 2026 and 2036, supported by shared national compute access and a widening enterprise AI delivery base. China is projected to post 42.4% CAGR from 2026 to 2036, driven by industrial AI scale and application programs within technology clusters. Australia is anticipated to advance at 41.1% CAGR during the forecast period, owing to SME adoption and expanding governance needs. The United Kingdom is estimated to record 40.8% CAGR across the 2026 to 2036 period, attributable to faster business AI use and regulatory readiness work. The United States is forecast to post 40.6% CAGR over the forecast horizon, shaped by enterprise model volume and heavy use in knowledge-intensive sectors.
How does the ModelOps Market break down by segment?
Software leads with 34.5%; Cloud accounts for 41.8%.
Which component dominates?
Software accounts for 34.5% share in 2026.
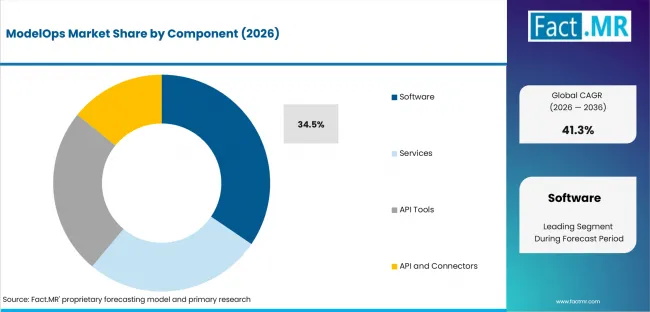
Modelops Market Analysis By Component | Source: Fact.MR
Software is projected to capture 34.5% share in 2026, driven by enterprise demand for shared inventory and policy automation for diverse AI assets. Services remain relevant where implementation teams need operating model design and system integration before production rollout. API Tools support programmatic lifecycle actions within existing development pipelines while preserving release records for governance teams. API Connectors link monitoring and approval records to cloud platforms so operating teams retain one traceable lifecycle view. ModelOp launched its AI Delivery Engine in June 2026 to automate intake and risk analysis before testing and documentation inside governed delivery workflows.
Which deployment is projected to hold the leading share?
Cloud holds 41.8% share in 2026.
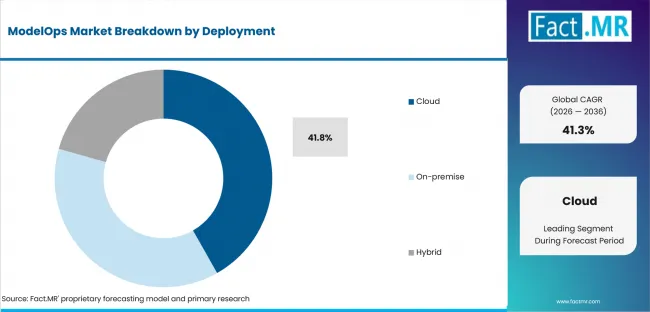
Modelops Market Analysis By Deployment | Source: Fact.MR
Cloud is projected to account for 41.8% share in 2026, supported by centralized access and elastic processing for distributed AI teams. On-premise deployment remains relevant in tightly controlled environments where data movement and network access face strict limits. Hybrid models connect governed internal workloads to cloud development and monitoring services while preserving control over sensitive production data and access boundaries. Eurostat reported in February 2026 that 53% of EU enterprises used paid cloud services during 2025. That installed cloud base gives ModelOps platforms a wider route into existing enterprise architecture programs.
How does Organization Size shape demand?
SMEs account for 47.8% share in 2026.
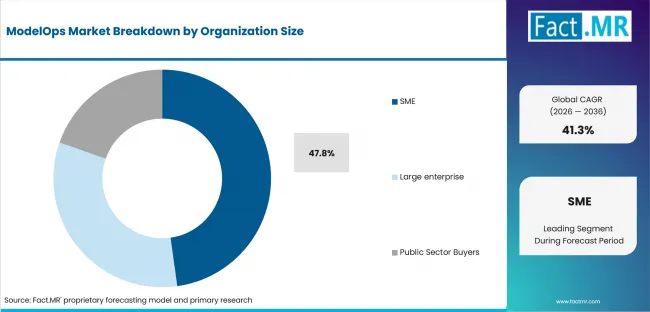
Modelops Market Analysis By Organization Size | Source: Fact.MR
SMEs are anticipated to capture 47.8% share in 2026, owing to managed deployment options and lower entry barriers for monitoring production AI. Model ownership spans business units and risk functions, so large enterprises need broader portfolio controls. Public sector teams emphasize traceability and secure deployment in sensitive workloads where operating evidence must remain available for formal review processes. Australia’s Industry Minister reported in June 2025 that 41% of small and medium enterprises were adopting AI. Wider SME use expands the pool of organizations that need repeatable deployment and monitoring practices.
What supports Workflow Automation growth?
Workflow lead with 31% share in 2026.
Workflow Automation is estimated to represent 31% share in 2026, shaped by agent workflows that combine models and external tools inside business processes. Analytics follows where teams operationalize scoring services that need stable release records and continuing performance review. Governance applications manage approvals and evidence for regulated workflows where accountable owners need traceable decisions from review into production. Integration connects lifecycle records with development platforms and service management systems so incidents remain linked to responsible owners. Domino Data Lab’s June 2025 release added pre-flight checks and approval gates with policy compliance controls for enterprise AI delivery.
Which end-use segment is forecast to hold the leading share?
BFSI holds 30.4% share in 2026.
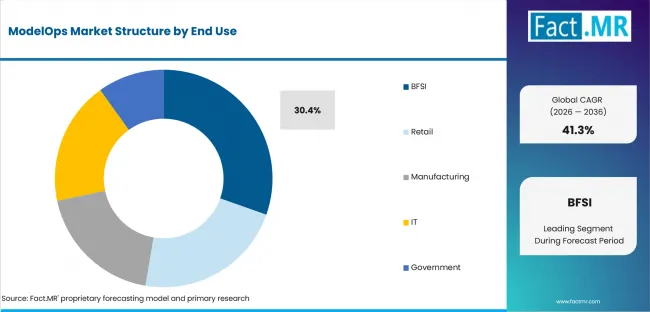
Modelops Market Analysis By End Use | Source: Fact.MR
BFSI is forecast to account for 30.4% share in 2026, attributable to formal model risk programs and evidence-heavy control requirements in customer decisions. Retail organizations apply lifecycle controls to forecasting and personalization systems that influence inventory decisions during frequent releases. Manufacturers monitor quality and maintenance models near operating systems where drift or latency changes affect production decisions. A U.S. Census Bureau working paper published in April 2026 found that AI use reached at least 50% among very large finance firms. That concentration supports ModelOps spending where formal ownership and review processes already shape production AI approval.
What is accelerating ModelOps Market adoption, and what is holding it back?
Production AI estate expansion drives adoption while integration debt and governance complexity restrain rollout within mixed enterprise environments.
Drivers Impact Analysis
| DRIVER | (~) % IMPACT ON CAGR | GEOGRAPHIC RELEVANCE | IMPACT TIMELINE |
|---|---|---|---|
| Rising production AI inventory across models and agents | +1.8% | Global enterprise accounts | Medium term (2-4 years) |
| Regulatory evidence and lifecycle control requirements | +1.5% | Europe and North America | Medium term (2-4 years) |
| Hybrid and multi-cloud AI deployment | +1.2% | Global | Medium term (2-4 years) |
| Agentic workflow expansion inside business operations | +0.9% | United States and China | Long term (>= 4 years) |
| Shared compute access for smaller AI teams | +0.7% | India and Australia | Short term (<= 2 years) |
Source: Fact.MR analysis. Updated Jul 8, 2026
- Production AI inventory: Enterprise teams now manage predictive models together with generative systems and agents that enter production through separate pipelines. The U.S. Census Bureau reported in May 2026 that overall business AI use stayed below 20% from December 2025 to May 2026. Adoption is expected to increase demand for inventories that connect ownership and runtime status for different AI assets.
- Governance evidence: AI oversight is moving closer to operating workflows to give policy teams proof that controls remain active after deployment. Eurostat reported in December 2025 that 20.0% of EU enterprises used AI during the year. Platform demand is projected to expand where governance evidence must connect model design and release approval to live behavior.
- Hybrid deployment: AI workloads increasingly cross cloud services and internal environments where security boundaries differ by workload. Eurostat reported in February 2026 that 65.5% of paid-cloud users used cloud security software applications during 2025. ModelOps adoption is anticipated to broaden as platform teams need common controls in cloud and internal runtimes.
- Agentic workflows: Prompts and tool calls change runtime behavior beyond a single model endpoint, creating new operating objects for agent systems. Microsoft reported in May 2025 that more than 230,000 organizations had used Copilot Studio to build AI agents and automations. Control demand is estimated to deepen where enterprises need traceable agent actions and release gates within workflow automation.
- Shared compute access: Public compute programs reduce infrastructure barriers for smaller development teams and increase the number of production AI projects. India’s Press Information Bureau reported in February 2026 that the national compute portal also provided access to 1,050 TPUs. Managed ModelOps demand is forecast to widen as more teams move from experimentation into monitored production use.
Opportunity Impact Analysis
| OPPORTUNITY | (~) % IMPACT ON CAGR | GEOGRAPHIC RELEVANCE | IMPACT TIMELINE |
|---|---|---|---|
| Cross-platform AI inventory and control records | +1.1% | Global | Medium term (2-4 years) |
| Agent monitoring and runtime policy enforcement | +0.9% | United States and United Kingdom | Medium term (2-4 years) |
| Regulated BFSI governance automation | +0.8% | North America and Europe | Medium term (2-4 years) |
| Managed ModelOps packages for SMEs | +0.6% | India and Australia | Long term (>= 4 years) |
Source: Fact.MR analysis. Updated Jul 8, 2026
- Cross-platform inventory: Enterprises have room to replace isolated registries with one control record that follows models and agents between environments. IBM announced agent orchestration and governance capabilities with infrastructure automation in October 2025 for enterprise production environments. Opportunity is expected to expand for control layers that follow AI assets without depending on one development platform.
- Agent monitoring: Autonomous workflows require visibility into tool use and changing runtime behavior over many execution steps. Fiddler AI announced a USD 30 million Series C round in January 2026 to develop its control plane for AI agents. Opportunity is projected to concentrate around continuous evaluation and policy enforcement that works inside live agent paths.
- BFSI governance automation: Financial institutions already operate formal model risk processes that provide a clear route for automated evidence collection. In January 2026 the Financial Conduct Authority cited a November 2024 Bank of England survey showing 75% of firms already used AI. Demand is anticipated to favor workflow controls that connect validation evidence to production monitoring and keep remediation ownership visible after deployment.
- SME operating packages: Smaller teams need deployment controls that support reliable production use without requiring large internal platform engineering groups. Australia’s June 2025 AI Adoption Tracker update found that 22% of businesses reported faster decision-making after adopting AI. Opportunity is estimated to widen for managed ModelOps bundles that combine deployment templates and monitoring with policy evidence.
Restraints Impact Analysis
| RESTRAINT | (~) % IMPACT ON CAGR | GEOGRAPHIC RELEVANCE | IMPACT TIMELINE |
|---|---|---|---|
| Toolchain integration debt across AI platforms | -1.0% | Global | Medium term (2-4 years) |
| Skills gaps in AI implementation and governance | -0.8% | United Kingdom and Europe | Medium term (2-4 years) |
| Inconsistent monitoring signals and model behavior | -0.6% | Global enterprise accounts | Medium term (2-4 years) |
| Compute cost visibility across distributed workloads | -0.5% | United States and Asia Pacific | Long term (>= 4 years) |
Source: Fact.MR analysis. Updated Jul 8, 2026
- Toolchain integration debt: ModelOps platforms must connect development tools and runtime services that expose different metadata and approval concepts. Integration work slows rollout when ownership fields and monitoring definitions do not match between systems. Adoption is expected to remain selective where connector depth requires extensive custom engineering before operational teams gain portfolio visibility.
- Skills gaps: Operating AI in production requires technical delivery skills and governance judgment that many organizations still lack. A UK government employer survey published in January 2026 found that 25% of employers said missing AI specialists affected business goals. Platform adoption is projected to slow where teams cannot assign clear ownership for monitoring and remediation.
- Operating signal mismatch: Model drift and agent behavior remain difficult to compare when teams collect incompatible signals between runtimes. H2O.ai expanded its Super Agent platform in March 2026 for long-running agent systems in sovereign and regulated deployment environments. Adoption is anticipated to favor platforms that normalize operating evidence without forcing development teams onto one model framework.
- Compute cost visibility: AI operating costs span inference services and supporting infrastructure that procurement teams often track in separate systems. A UK government study published in February 2026 found that 76% of businesses reporting high AI costs rated them as a significant barrier. Investment is estimated to face closer scrutiny where lifecycle tools cannot connect operating cost to business use cases.
Which countries are scaling ModelOps Market fastest?
India 43.1%; China 42.4%; Australia 41.1%; United Kingdom 40.8%; United States 40.6%; Germany 40.3%; Japan 40.0%
Regional analysis covers North America, Europe, East Asia, South Asia & Pacific, and the Middle East & Africa.
| COUNTRY | CAGR |
|---|---|
| India | 43.1% |
| China | 42.4% |
| Australia | 41.1% |
| United Kingdom | 40.8% |
| United States | 40.6% |
| Germany | 40.3% |
| Japan | 40.0% |
Source: Fact.MR analysis. Updated Jul 8, 2026
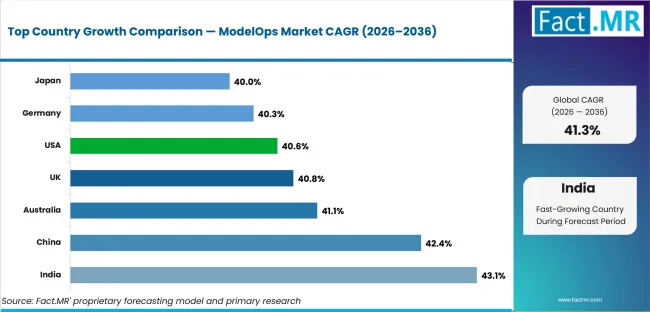
Modelops Market Cagr Analysis By Country | Source: Fact.MR
What is powering India's growth?
43.1% CAGR, driven by shared compute access and expanding enterprise AI delivery.
India’s ModelOps market is gaining momentum because shared compute access is moving AI development beyond large enterprises and into broader production teams. In February 2026 the Press Information Bureau reported that the IndiaAI Compute Portal provided access to more than 38,000 GPUs. The market is expected to record a 43.1% CAGR during the forecast period, supported by shared infrastructure and rising demand for managed governance services. Providers can improve commercial access when startups and engineering teams can develop models without maintaining dedicated computing infrastructure.
How is China scaling ModelOps demand?
42.4% CAGR, supported by industrial AI scale and expanding application programs.
China’s ModelOps demand is accelerating as a large AI supplier base pushes more models from experimentation into managed industrial deployment. In March 2026, China’s State Council reported that the country had more than 6,200 AI companies during 2025. The market is projected to post a 42.4% CAGR between 2026 and 2036, driven by deployment scale and local integration across technology clusters. ModelOps providers can improve enterprise access where industrial AI programs require repeatable deployment controls and continuous performance monitoring across distributed operations.
What supports the Australia outlook?
41.1% CAGR, owing to wider business AI adoption and expanding governance requirements.
Australia’s ModelOps opportunity is broadening as business AI adoption creates a larger installed base that requires monitoring and governance support. The Australian Bureau of Statistics reported in June 2026 that 12% of businesses used AI during the 2024–25 financial year. The market is anticipated to advance at a 41.1% CAGR during the forecast period, owing to wider production use and demand for packaged governance services. Providers can gain traction by offering deployment controls that smaller enterprises can adopt without building dedicated internal ModelOps teams.
What underpins United Kingdom growth?
40.8% CAGR, backed by rising business AI use and compliance readiness.
United Kingdom demand is strengthening as AI moves into routine business operations and creates recurring requirements for deployment evidence and model oversight. Office for National Statistics reporting in July 2026 found that 29% of businesses used at least one AI technology during June 2026. The market is estimated to record a 40.8% CAGR over the forecast horizon, attributable to faster adoption and recurring evidence requirements within regulated business processes. Vendors can strengthen positioning when deployment records and monitoring workflows support internal review across multiple business functions.
How is the United States developing ModelOps demand?
40.6% CAGR, supported by enterprise AI scale and broad adoption across larger organizations.
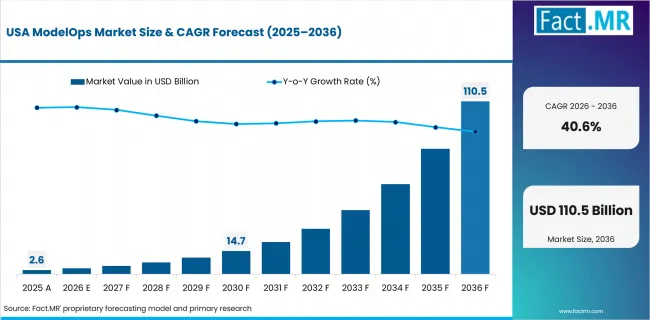
Modelops Market Country Value Analysis | Source: Fact.MR
United States demand is deepening as larger enterprises expand AI use across multiple departments and require consistent operating controls for growing model portfolios. U.S. Census Bureau reporting in May 2026 found that 37% of firms with at least 250 employees used AI in business operations. The market is forecast to post a 40.6% CAGR across the 2026 to 2036 period, shaped by portfolio scale and demand for consistent runtime evidence among decentralized teams. ModelOps platforms gain importance when enterprises need common monitoring rules across cloud environments and internal application portfolios.
Who leads the ModelOps Market?
ModelOp and IBM anchor direct enterprise lifecycle coverage while DataRobot and Domino Data Lab strengthen hybrid governance and controlled AI delivery.
ModelOp focuses on enterprise-wide inventory and governance for machine learning models and generative applications together with agent workflows through its command-center approach. IBM combines lifecycle governance with hybrid operations tooling for enterprises that manage diverse models in cloud and internal environments. SAS announced AI Navigator in April 2026 to centralize visibility over models and agents with AI use cases throughout enterprise programs. Competition among these providers centers on control depth for mixed assets and the ability to translate policy requirements into repeatable operating steps.
DataRobot provides governance for cloud and isolated environments while Domino Data Lab combines development and lifecycle controls within one enterprise delivery platform. H2O.ai supports deployment and monitoring for predictive model workflows while Fiddler AI focuses on evaluations and enforceable runtime policy for model and agent systems. Competition is expected to be shaped by cross-platform inventory and evidence automation with runtime cost visibility for mixed enterprise AI estates.
Which companies are the key providers?
ModelOp, IBM, SAS, DataRobot, Domino Data Lab, H2O.ai, Fiddler AI
- ModelOp
- IBM
- SAS
- DataRobot
- Domino Data Lab
- H2O.ai
- Fiddler AI
Bibliography
- Australian Bureau of Statistics. (2026, June 25). Characteristics of Australian business, 2024–25 financial year. Australian Bureau of Statistics.
- DataRobot. (2026, July 2). DataRobot unifies AI governance beyond the cloud. DataRobot.
- Department for Science, Innovation and Technology. (2026, January 28). AI skills for life and work: Employer survey findings. Government of the United Kingdom.
- Department for Science, Innovation and Technology. (2026, February 13). AI adoption research. Government of the United Kingdom.
- Domino Data Lab. (2025, June 19). Domino’s Spring 2025 release supercharges enterprise AI delivery with speed, scale, and trust. Domino Data Lab.
- Eurostat. (2025, December 11). 20% of EU enterprises use AI technologies. European Commission.
- Eurostat. (2026, February 3). 53% of EU enterprises used paid cloud services in 2025. European Commission.
- Financial Conduct Authority. (2026, January 30). The FCA’s long-term review into AI and retail financial services: Designing for the unknown. Financial Conduct Authority.
- Fiddler AI. (2026, January 27). Fiddler raises $30M Series C to deliver the first control plane for AI. Fiddler AI.
- H2O.ai. (2026, March 16). H2O.ai expands H2O Super Agent platform to support autonomous, self-evolving agents with NVIDIA. H2O.ai.
- IBM. (2025, October 7). IBM unveils advancements across software and infrastructure to help enterprises operationalize AI. IBM Newsroom.
- Microsoft. (2025, May 20). Microsoft Build 2025: The age of AI agents and building the open agentic web. Microsoft Source.
- Minister for Industry and Innovation and Science. (2025, June 4). Australian AI Adoption Tracker report shows business harnessing AI. Australian Government.
- ModelOp. (2026, June 2). Introducing ModelOp’s AI Delivery Engine. ModelOp.
- Office for National Statistics. (2026, July 2). Business insights and impact on the UK economy: 2 July 2026. Office for National Statistics.
- Press Information Bureau. (2026, February 4). India AI Stack: Powering intelligence at scale. Government of India.
- SAS. (2026, April 28). SAS AI Navigator to bring order to AI chaos. SAS.
- State Council of the People’s Republic of China. (2026, March 5). China’s core AI industry scale tops 1.2 trillion yuan in 2025: Official. State Council of the People’s Republic of China.
- U.S. Census Bureau. (2026, April 25). The microstructure of AI diffusion: Evidence from firms, business functions, and worker tasks. U.S. Census Bureau.
- U.S. Census Bureau. (2026, May 26). Large firms with at least 20 employees biggest AI users. U.S. Census Bureau.
This Report Addresses
- The report provides strategic intelligence on Component and Deployment choices that shape enterprise ModelOps architecture and clarify control ownership for production AI estates.
- Segment analysis identifies Software and Cloud as the leading segments in the 2026 structure and evaluates the commercial logic behind adoption.
- Regional outlook evaluates India and China with Australia included as a separate adoption case while the United Kingdom and United States complete comparison.
- Competitive analysis profiles ModelOp and IBM with SAS and DataRobot while Domino Data Lab, H2O.ai and Fiddler AI complete the verified provider set.
- Component assessment covers Software and Services with API Tools and API Connectors used to operate AI assets from development into controlled production environments.
- Application assessment covers Workflow Automation and Analytics together with Governance and Integration functions that connect release controls to continuing production evidence.
- The analysis reviews BFSI and Retail as well as Manufacturing, IT and Government demand where model portfolios require different control depth and operating evidence.
What does the ModelOps Market cover?
Software and Services with API Tools and API Connectors used to govern enterprise AI assets throughout deployment and production lifecycles.
The ModelOps Market covers software and services that manage AI inventory, deployment controls and monitoring throughout production lifecycles. Coverage includes lifecycle records for predictive models and generative systems with agent workflows that require approval and runtime evidence.
Commercial value centers on operational control after models enter formal enterprise workflows, separating this market from general data science platforms. Model development environments and standalone monitoring tools remain outside the boundary unless they provide lifecycle governance or production control functions used throughout an AI portfolio.
What is included in the scope?
ModelOps systems used for enterprise AI deployment and governance with monitoring and workflow control in complex production estates.
The scope covers Software and Services together with API Tools and API Connectors under Cloud and On-premise deployment. Hybrid environments are included when shared lifecycle controls connect internal systems with hosted services between operating boundaries. Organization coverage spans SMEs and Large Enterprises while Public Sector Buyers remain included under distinct control requirements. Application coverage includes Workflow Automation and Analytics together with Governance and Integration functions connecting release decisions to production evidence. BFSI and Retail are covered with Manufacturing and IT operations while Government use remains included for public services. Adjacent adaptive AI systems inform monitoring context in production environments where system behavior changes after deployment. Cloud managed services provide infrastructure context for outsourced operating responsibilities without entering ModelOps revenue automatically.
What is excluded from the scope?
Standalone model development platforms and general infrastructure monitoring tools remain outside the scope unless they provide explicit AI lifecycle control functions.
The scope excludes data labeling tools and standalone model training environments that stop before governed production operation. General infrastructure monitoring and software distribution platforms remain outside the boundary unless the sold package includes AI asset inventory and lifecycle control. Foundation model access fees remain excluded unless sold inside a ModelOps package that manages deployment approval and ongoing evidence.
How was the analysis built?
140+ sources, 45+ company portfolios, 30+ countries, 24+ interviews.
- Primary Research: Primary research includes interviews with enterprise AI platform leaders and MLOps engineers responsible for production delivery. Interviews also cover model risk officers and governance specialists as well as cloud architects and procurement heads evaluating integration effort and evidence export requirements.
- Desk Research: Desk research reviews official business AI adoption statistics and regulator material with provider product documentation and release notes. Portfolio mapping covers model registries and deployment controls together with monitoring systems and agent governance functions that define the ModelOps boundary.
- Market-Sizing and Forecasting: Forecasting uses production AI project counts and software adoption rates together with deployment mix and enterprise spending patterns. The model also considers governance intensity and connector requirements as well as managed service penetration across organization sizes and regulated end uses.
- Data Validation and Update Cycle: Forecasts are validated through provider checks and technical interviews that test assumptions on adoption timing and operating ownership. Portfolio mapping and country adoption evidence help confirm direction while quarterly review of company releases and official statistics supports forecast updates.
Segmentation
What is the report’s scope and coverage?
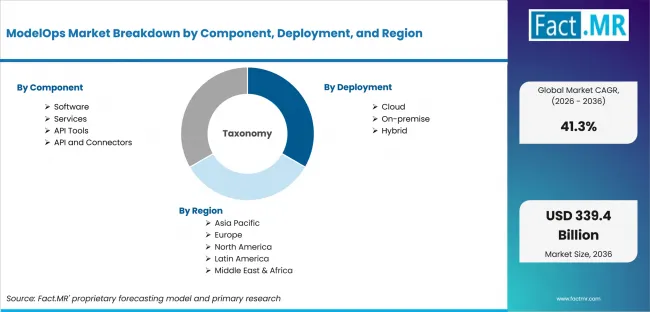
Modelops Market Breakdown By Component, Deployment, And Region | Source: Fact.MR
| Attribute | Details |
|---|---|
| Quantitative Units | USD billion |
| Market Definition | ModelOps software and services used to govern AI asset inventory and deployment controls across production lifecycles while maintaining monitoring evidence for enterprise AI operations |
| Component | Software; Services; API Tools; API Connectors |
| Deployment | Cloud; On-premise; Hybrid |
| Organization Size | SMEs; Large Enterprises; Public Sector Buyers |
| Application | Workflow Automation; Analytics; Governance; Integration |
| End Use | BFSI; Retail; Manufacturing; IT; Government |
| Regions Covered | North America; Europe; East Asia; South Asia & Pacific; Middle East & Africa |
| Countries Covered | India; China; Australia; United Kingdom; United States |
| Key Companies Profiled | ModelOp; IBM; SAS; DataRobot; Domino Data Lab; H2O.ai; Fiddler AI |
| Forecast Period | 2026 to 2036 |
| Approach | Hybrid top-down and bottom-up approach using production AI project counts; software adoption rates; deployment mix; enterprise spending patterns; governance intensity; connector requirements; managed service penetration; provider checks and enterprise interviews |
Source: Fact.MR analysis. Updated Jul 8, 2026
How is the market segmented?
-
By Component:
- Software
- Services
- API Tools
- API Connectors
-
By Deployment:
- Cloud
- On-premise
- Hybrid
-
By Organization Size:
- SMEs
- Large Enterprises
- Public Sector Buyers
-
By Application:
- Workflow Automation
- Analytics
- Governance
- Integration
-
By End Use:
- BFSI
- Retail
- Manufacturing
- IT
- Government
-
By Region:
- North America
- United States
- Canada
- Europe
- Germany
- United Kingdom
- France
- Italy
- Spain
- Asia Pacific
- India
- China
- Japan
- South Korea
- Australia
- Latin America
- Brazil
- Argentina
- Mexico
- Chile
- Middle East & Africa
- UAE
- Saudi Arabia
- South Africa
- North America
Frequently Asked Questions
Why is Software projected to lead in 2026?
What share is Cloud estimated to garner in 2026?
Why are SMEs predicted to dominate in 2026?
What share is Workflow Automation forecast to hold in 2026?
What share is BFSI expected to represent in 2026?
Which country is projected to record the highest CAGR?
What CAGR is China anticipated to post?
At what rate is Australia estimated to expand?
How fast is the United Kingdom forecast to grow?
What CAGR is expected for the United States?
Which factor is projected to drive ModelOps demand most?
Which restraint is estimated to limit ModelOps adoption most?
Why is Software projected to remain important?
Why is BFSI expected to sustain substantial demand?
Who worked on this report


Preview the report firsthand - request a free sample
Free SampleGet the brochure for pricing and purchase details
Download PDF