- Market Value (2025): USD 47.0 Mn
- Estimated Value (2026): USD 58.0 Mn
- Forecast Value (2036): USD 470.0 Mn
- CAGR (2026-2036): 23.3%
What is the Wafer Defect VQA Market forecast to be worth by 2036?
USD 58.0 million in 2026 to USD 470.0 million by 2036 at 23.3% CAGR.
- The wafer defect VQA market reached USD 47.0 million in 2025 as fabs tested visual question-answering workflows for review stations and yield rooms.
- Demand is projected to increase from USD 58.0 million in 2026 to USD 470.0 million by 2036.
- The market is forecast to record 23.3% CAGR from 2026 to 2036 owing to stricter defect classification, root-cause traceability and fab-level AI review controls.
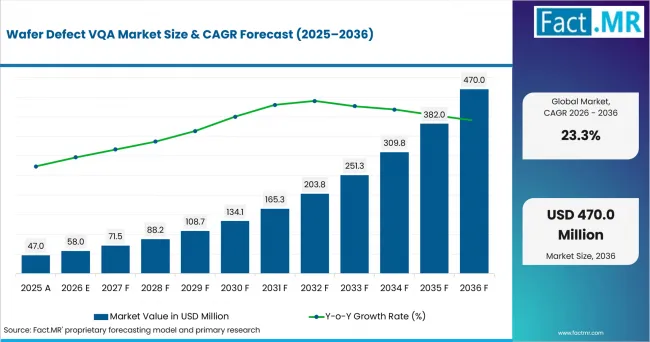
Wafer Defect Vqa Market Value Analysis | Source: Fact.MR
What are the defining numbers behind Wafer Defect VQA Market growth?
USD 412.0 million absolute opportunity by 2036, led by Vision-language transformers and On-prem/edge deployment alongside Defect classification and Foundries.
- Demand Drivers in the Market
- Fab process engineers need image-grounded answers that explain whether a defect pattern is random, systematic or linked to a recent recipe change.
- Yield teams use VQA to shorten review loops when optical inspection creates dense candidate maps that still require eBeam confirmation.
- Manufacturing IT teams favor controlled deployment since wafer images, recipes and lot histories often remain inside restricted fab networks.
- Key Segments Analyzed
- By Model Type: Vision-language transformers are expected to hold 47.0% share in 2026 because they connect image features with natural-language defect reasoning.
- By Deployment: On-prem/edge is projected to account for 52.0% share in 2026 since fabs keep sensitive wafer images close to inspection and yield systems.
- By Use Case: Defect classification is anticipated to capture 36.0% share in 2026 due to its direct role in review triage and excursion screening.
- By End User: Foundries are estimated to represent 42.0% share in 2026 owing to multi-customer flows that require faster explanation of defect signatures.
- Analyst Opinion at Fact.MR
- Shambhu Nath Jha, Principal Consultant at Fact.MR, states, “Wafer defect VQA is drawing attention because defect review teams need answers that remain tied to the image, lot and process step. Production use is expected to depend on model confidence, fab data controls and clear handoff to yield engineers. Stronger providers combine semiconductor context, image evidence and controlled deployment without turning the tool into a generic chatbot.”
- Strategic Implications
- Fab operators should define which defect classes receive VQA assistance before the model reaches daily review work.
- Software providers should prove how visual answers remain traceable to the original wafer image and tool event.
- Inspection vendors should align VQA modules with review queues so engineers do not shift between separate screens.
- Investors should separate fab-qualified visual reasoning platforms from broad AI analytics tools that lack wafer-image grounding.
The USA is projected to record 25.18% CAGR through 2036 due to digital-twin investment and secure fab data requirements. Taiwan is expected to post 24.86% as pilot-line work links chip design and production. South Korea is forecast to advance at 24.82% owing to memory output and ICT export depth. China is anticipated to reach 24.74% as integrated-circuit production expands. Germany is estimated to post 24.62% through microelectronics policy. Israel is projected to reach 24.61% because deep-tech funding supports semiconductor software and sensing capability.
How does the Wafer Defect VQA Market break down by segment?
Vision-language transformers lead at 47.0%; On-prem/edge leads at 52.0%.
Which Model Type dominates?
Vision-language transformers are projected to account for 47.0% share in 2026.
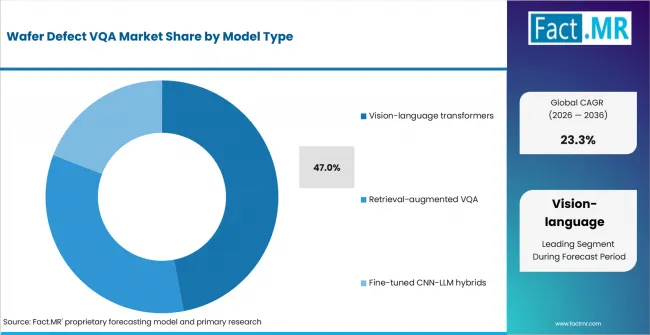
Wafer Defect Vqa Market Analysis By Model Type | Source: Fact.MR
Vision-language transformers are expected to lead Model Type because they read wafer images and return direct answers to engineering questions. Retrieval-augmented VQA follows at 29.0% share by adding recipe context and past excursion records. Fine-tuned CNN-LLM hybrids hold 24.0% share where fabs use narrower defect libraries.
What leads the Deployment segment?
On-prem/edge is expected to hold 52.0% share in 2026.
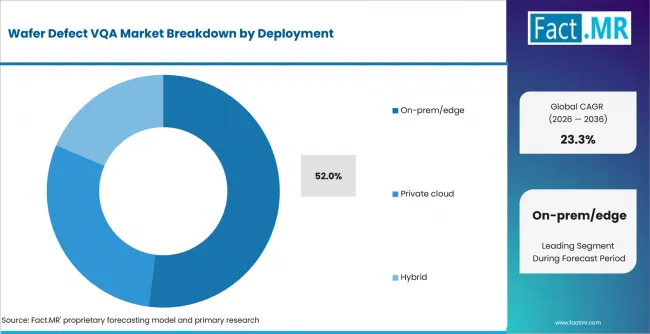
Wafer Defect Vqa Market Analysis By Deployment | Source: Fact.MR
On-prem/edge deployment is projected to lead because wafer images and process settings are sensitive production data. Private cloud holds 33.0% share where enterprises centralize analytics under governance controls. Hybrid deployment accounts for 15.0% share when fabs split local image processing from shared retrieval.
How does Use Case shape demand?
Defect classification is anticipated to lead with 36.0% share in 2026.
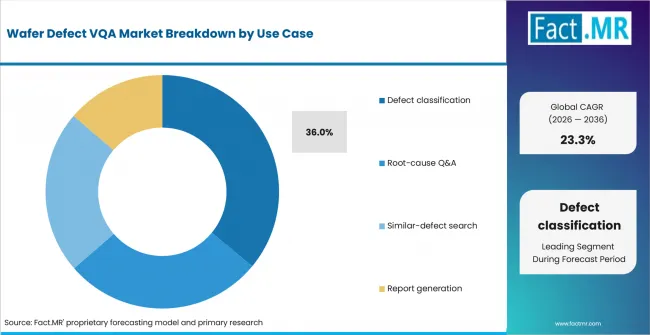
Wafer Defect Vqa Market Analysis By Use Case | Source: Fact.MR
Defect classification is forecast to lead because it is the first decision point after inspection flags a suspicious pattern. Root-cause Q&A follows at 28.0% share as engineers ask which tool, step or condition is likely to explain the defect. Similar-defect search accounts for 21.0% share by helping teams compare new images with past events. Report generation represents 15.0% share where fabs need short summaries that preserve evidence for customer and yield-review discussions.
What supports Foundries within End User?
Foundries are forecast to hold 42.0% share in 2026.
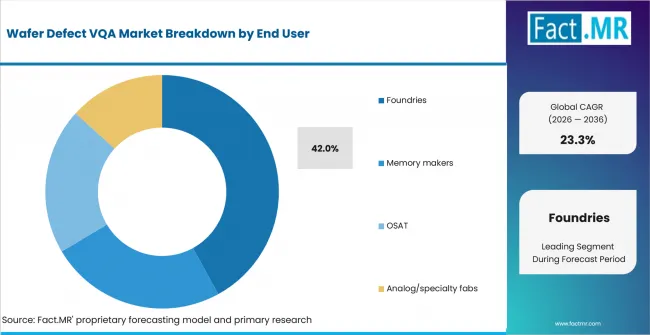
Wafer Defect Vqa Market Analysis By End User | Source: Fact.MR
Foundries are estimated to lead the End User segment because they manage multi-customer wafer flows and must explain defect signatures quickly. Memory makers hold 26.0% share as high-volume devices depend on stable classification. OSAT providers account for 18.0% share where defect review reaches package issues and assembly records. Analog and specialty fabs hold 14.0% share because smaller lots still require clean qualification evidence before process changes are accepted.
What is accelerating Wafer Defect VQA Market adoption, and what is holding it back?
Image-grounded defect reasoning drives it; model trust and data controls restrain it.
Drivers Impact Analysis
| DRIVER | (~) % IMPACT ON CAGR |
GEOGRAPHIC RELEVANCE | IMPACT TIMELINE |
|---|---|---|---|
| Vision-language defect reasoning | +5.4% | USA, Taiwan, South Korea | Short term (<= 2 years) |
| On-site data security | +4.3% | USA, Germany, Israel | Short term (<= 2 years) |
| Root-cause documentation | +3.8% | Foundry and memory clusters | Medium term (2-4 years) |
| eBeam review overload | +3.1% | Advanced-node fabs | Medium term (2-4 years) |
| Multi-site yield learning | +2.0% | Global fab networks | Long term (>= 4 years) |
Source: Fact.MR analysis. Updated Aug 13, 2026
- Vision-language defect reasoning: VQA lets engineers ask what a defect resembles and where process attention should begin. The capability is expected to reduce handoff between image review and yield analysis when answers cite visible patterns and lot history.
- On-site data security: On-premise and edge systems gain preference when images and lot histories must stay inside the fab. Engineering teams are expected to favor systems that answer questions without moving restricted images outside approved networks.
- Root-cause documentation: Fabs need short answers that cite the image and process context. Adoption is anticipated to improve when reports preserve a clear path from the defect image to the suspected process event.
- eBeam review overload: Advanced optical inspection creates more review candidates than engineers manually classify. VQA is expected to support triage before specialist review while keeping final decisions with fab engineers.
- Multi-site yield learning: Large manufacturers want site lessons without exposing sensitive data. Federated knowledge workflows are forecast to allow similar-defect search while keeping account and recipe details separated.
Opportunity Impact Analysis
| OPPORTUNITY | (~) % IMPACT ON CAGR |
GEOGRAPHIC RELEVANCE | IMPACT TIMELINE |
|---|---|---|---|
| Recipe-linked VQA | +2.4% | USA and Taiwan | Medium term (2-4 years) |
| Private retrieval layers | +1.8% | Germany and Israel | Medium term (2-4 years) |
| Package defect Q&A | +1.4% | Taiwan and South Korea | Long term (>= 4 years) |
| Audit-ready reports | +1.1% | Regulated customer flows | Long term (>= 4 years) |
Source: Fact.MR analysis. Updated Aug 13, 2026
- Recipe-linked VQA: The primary opportunity is concentrated in systems that connect defect images with recipe changes and tool events. Suppliers are expected to gain ground when answers point to evidence instead of broad probability scores.
- Private retrieval layers: Retrieval-augmented VQA is expected to gain value where fabs keep procedures and past incidents in controlled repositories. The method reduces the risk of answers that cannot be traced back to a fab source.
- Package defect Q&A: OSAT and advanced packaging teams need image answers for cracks, voids and alignment issues. Demand is projected to improve where assembly inspection data can be linked with process records. In January 2025, the U.S. Department of Commerce finalized USD 1.4 billion in CHIPS NAPMP awards for advanced packaging, including USD 1.1 billion for Natcast's packaging piloting facility.
- Audit-ready reports: Customers expect traceable corrective-action records. VQA tools that export concise evidence-linked summaries into quality systems are likely to improve review speed.
Restraints Impact Analysis
| RESTRAINT | (~) % IMPACT ON CAGR |
GEOGRAPHIC RELEVANCE | IMPACT TIMELINE |
|---|---|---|---|
| Model confidence limits | -2.1% | Global | Short term (<= 2 years) |
| Tool-data fragmentation | -1.7% | Multi-vendor fabs | Short term (<= 2 years) |
| Customer IP controls | -1.3% | Foundries | Medium term (2-4 years) |
| Qualification time | -0.9% | Pilot lines and specialty fabs | Medium term (2-4 years) |
Source: Fact.MR analysis. Updated Aug 13, 2026
- Model confidence limits: VQA answers must show confidence and evidence before engineers use them in release decisions. The restraint is expected to remain until fabs test answers across defect classes and process nodes.
- Tool-data fragmentation: Inspection images, process events and test results often remain in different systems. VQA vendors are anticipated to face longer implementation cycles when fabs use several inspection and manufacturing platforms.
- Customer IP controls: Foundries handle customer-specific layouts and process data. These controls are likely to favor private model tuning and retrieval setups over broad shared datasets.
- Qualification time: New VQA systems need proof across defect classes and process nodes. Long approval cycles are expected to keep pilots smaller until answer accuracy and audit trails are repeatable.
Which countries are scaling Wafer Defect VQA Market fastest?
USA 25.18%; Taiwan 24.86%; South Korea 24.82%; Germany 24.62%; Israel 24.61%.
- The country comparison spans 0.57 percentage points and forms one tight growth band across advanced semiconductor software hubs.
- The USA remains 0.32 percentage point above Taiwan through digital-twin programs and secure fab-data controls.
- Taiwan remains 0.04 percentage point above South Korea as pilot-line work links design, manufacturing and testing.
- South Korea remains 0.08 percentage point above China because memory output keeps defect-learning cycles active.
- Germany remains 0.01 percentage point above Israel through microelectronics strategy, wafer capacity and equipment expertise.
Comparable CAGRs create different entry conditions because fab scale, data policy and local engineering depth shape VQA adoption.
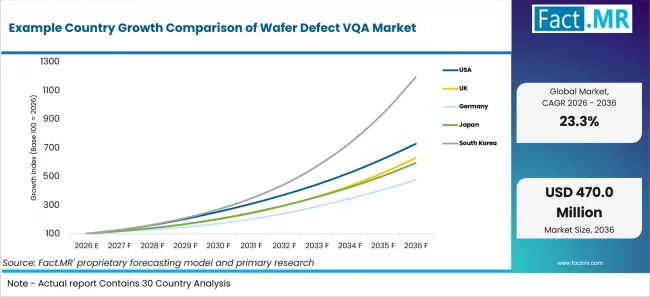
Example Country Growth Comparison Of Wafer Defect Vqa Market | Source: Fact.MR
| Country | CAGR (2026-2036) |
|---|---|
| USA | 25.18% |
| Taiwan | 24.86% |
| South Korea | 24.82% |
| Germany | 24.62% |
| Israel | 24.61% |
Source: Fact.MR analysis. Updated Aug 13, 2026
What supports USA adoption?
25.18% CAGR, supported by digital-twin programs and secure fab analytics.
The USA accounts for 28.1% share and has the broadest listed value base. NIST reported in January 2025 that SMART USA received USD 285.0 million to build a digital-twin institute for semiconductor manufacturing. That environment supports on-site VQA for dense defect queues.
What is driving Taiwan’s growth from 2026 to 2036?
24.86% CAGR, backed by pilot-line depth and foundry qualification.
Taiwan accounts for 20.1% share and benefits from foundry scale. Taiwan’s Ministry of Economic Affairs said in February 2026 that its first research-led 12-inch advanced pilot line involves NT$3.77 billion of investment. The line targets AI, silicon photonics and quantum technology, placing image-linked review closer to advanced process testing.
How is South Korea developing demand?
24.82% CAGR, driven by memory manufacturing and ICT export strength.
South Korea accounts for 17.8% share and remains tied to memory manufacturing. The manufacturing base supports on-prem VQA tools that connect defect review with local process controls.
How does Germany perform?
24.62% CAGR, led by microelectronics strategy and wafer-capacity depth.
Germany accounts for 9.0% share and serves customers that need traceable defect evidence. The federal government adopted its microelectronics strategy in October 2025 and stated that Germany holds around 30% of European wafer capacities. VQA adoption is expected to depend on data-protection review and proof that answers remain tied to approved records.
What supports Israel’s growth?
24.61% CAGR, shaped by deep-tech funding and semiconductor software capability.
Israel accounts for 10.4% share and benefits from semiconductor software teams. The Israel Innovation Authority launched a September 2025 deep-tech program totaling about ₪250.0 million, or USD 70.0 million, with semiconductors included. That funding base supports VQA and retrieval-layer experimentation, while security-sensitive accounts require strict image controls.
Who leads the Wafer Defect VQA Market?
PDF Solutions and Applied Materials show the clearest direct relevance, while KLA Corporation, Synopsys, Inc., Athinia and DR YIELD broaden the semiconductor analytics field.
PDF Solutions fits the market through fab data infrastructure and generative-AI collaboration for process context. Applied Materials has direct relevance through AI-enabled SEMVision H20 defect review. KLA Corporation adds chip telemetry and health-monitoring analytics that can feed defect reasoning. Synopsys, Inc. supports process optimization software for manufacturing teams. Athinia contributes secure data collaboration for semiconductor manufacturing. DR YIELD brings yield-management software used by fabs that need structured issue tracking.
Which companies are the key providers?
Key companies include PDF Solutions, Applied Materials, KLA Corporation, Synopsys, Inc., Cohu, Inc., and DR YIELD.
- PDF Solutions
- Applied Materials
- KLA Corporation
- Synopsys, Inc.
- Cohu, Inc.
- DR YIELD
Bibliography
- Applied Materials, Inc. (2025, February 19). Applied Materials accelerates chip defect review with next-gen eBeam system.
- Federal Government of Germany. (2025, October 15). Federal Government microelectronics strategy adopted.
- Israel Innovation Authority. (2025, September 9). Israel Innovation Authority launches a new incentive program to invest ₪250 million directly in Deep Tech under the YOZMA Fund.
- Department of Industrial Technology, Ministry of Economic Affairs. (2026, February 11). MOEA breaks ground on Advanced Semiconductor R&D Center: Taiwan’s first 12-inch pilot line to target AI, silicon photonics, and quantum technology.
- Ministry of Trade, Industry and Resources, & Ministry of Science and ICT. (2026, January 15). ICT exports post record annual performance in 2025.
- National Institute of Standards and Technology. (2025, January 3). Biden-Harris Administration awards Semiconductor Research Corporation Manufacturing Consortium Corporation $285M for new CHIPS Manufacturing USA Institute for Digital Twins, headquartered in North Carolina.
- PDF Solutions, Inc. (2025, October 2). PDF Solutions announces collaboration with Lavorro to provide context-aware, generative AI-assisted option for semiconductor fabs.
- DR YIELD. (2025, March 31). 20 years of product development: From Smart Alerts to the new Defect Module.
This Report Answers
- The report provides intelligence on the Wafer Defect VQA Market across Model Type and Deployment choices.
- Segment analysis covers Vision-language transformers and On-prem/edge deployment as the share leaders within the 2026 market.
- Country outlook evaluates the USA and Taiwan alongside South Korea, China, Germany and Israel.
- Competitive analysis profiles PDF Solutions and Applied Materials alongside KLA Corporation and Synopsys, Inc.. Athinia and DR YIELD complete the provider set.
- Use-case assessment covers Defect classification, Root-cause Q&A, Similar-defect search and Report generation.
What does the Wafer Defect VQA Market cover?
Wafer defect VQA platforms answer visual and process questions tied to defect images and wafer maps. Coverage overlaps with semiconductor defect inspection equipment when inspection outputs feed the question-answering layer. It also connects with e-beam wafer inspection systems where nanoscale review images require explanation.
The market extends to software that interprets images from optical review and process-control databases. Related demand appears near metrology and inspection equipment and profilometer equipment when measurement outputs need local explanation. Systems that only classify defects without engineer questions remain outside the core market.
What is included in the scope?
The scope includes model types that connect wafer images with language-based review. It covers on-premise edge environments, private cloud and hybrid setups. Related workflows include HBM stack inspection and backside via inspection when engineers query image evidence. Coverage also includes backside power metrology when bonded-wafer checks need answers.
The end-user scope includes foundries, memory makers, OSAT providers and analog or specialty fabs. VQA software can work beside semiconductor robot systems when wafer movement and review systems share context. Inclusion depends on visual question-answering, retrieval and defect-reasoning capability.
What is excluded from the scope?
General image-classification tools are excluded when they do not answer engineer questions or link responses to wafer evidence. Hardware-only systems such as semiconductor diffusion equipment and semiconductor CVD equipment remain outside the scope unless a separate VQA software layer is sold. Broad enterprise chatbots are excluded when they lack wafer-image grounding.
How Was the Analysis Built?
The analysis draws on 120+ sources, 35+ company portfolios, 25+ countries, and more than 20 industry interviews.
- Primary Research: Primary research includes discussions with manufacturers, service providers, technology developers, distributors, end users, procurement teams, and subject-matter experts. These conversations examine purchasing priorities, product adoption, operational challenges, approval requirements, competitive positioning, and the factors that influence wider market acceptance.
- Desk Research: Desk research covers government statistics, regulatory publications, company filings, trade data, technical studies, industry associations, standards, public policy, and other authoritative sources. Every source used in the analysis is documented in the bibliography.
- Market Sizing and Forecasting: Market estimates combine historical performance, demand indicators, pricing and volume trends, segment shares, company participation, country-level growth, adoption patterns, investment activity, and barriers to market expansion.
- Data Validation and Update Cycle: Findings are validated by comparing primary interviews with public data, company activity, regulatory changes, trade patterns, and industry developments. Regular updates review new product launches, capacity changes, partnerships, approvals, procurement trends, and shifts in commercial adoption.
Segmentation
What is the report’s scope and coverage?
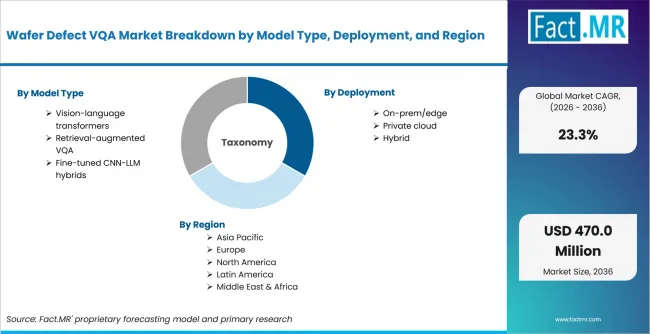
Wafer Defect Vqa Market Breakdown By Model Type, Deployment, And Region | Source: Fact.MR
| Attribute | Details |
|---|---|
| Quantitative Units | USD Million |
| Market Definition | Software platforms that combine wafer defect images, inspection outputs, yield records and natural-language question answering for fab engineering workflows |
| Model Type | Vision-language transformers; Retrieval-augmented VQA; Fine-tuned CNN-LLM hybrids |
| Deployment | On-prem/edge; Private cloud; Hybrid |
| Use Case | Defect classification; Root-cause Q&A; Similar-defect search; Report generation |
| End User | Foundries; Memory makers; OSAT; Analog/specialty fabs |
| Regions Covered | North America; Europe; East Asia; South Asia and Pacific; Middle East and Africa |
| Countries Covered | USA; Taiwan; South Korea; China; Germany; Israel |
| Key Companies Profiled | PDF Solutions; Applied Materials; KLA Corporation; Synopsys, Inc.; Cohu, Inc.; DR YIELD |
| Forecast Period | 2026 to 2036 |
| Approach | Hybrid top-down and bottom-up approach using locked annual values; segment shares; country CAGRs; wafer inspection workflows; fab data-control needs; AI image-reasoning maturity; defect review workload; company portfolio checks |
Source: Fact.MR analysis. Updated Aug 13, 2026
How is the market segmented?
-
By Model Type
- Vision-language transformers
- Retrieval-augmented VQA
- Fine-tuned CNN-LLM hybrids
-
By Deployment
- On-prem/edge
- Private cloud
- Hybrid
-
By Use Case
- Defect classification
- Root-cause Q&A
- Similar-defect search
- Report generation
-
By End User
- Foundries
- Memory makers
- OSAT
- Analog/specialty fabs
-
By Region
- North America
- Latin America
- Western Europe
- Eastern Europe
- East Asia
- South Asia and Pacific
- Middle East & Africa
Frequently Asked Questions
How big is the wafer defect VQA market in 2026?
What is the CAGR of the wafer defect VQA market from 2026 to 2036?
Which model type leads the wafer defect VQA market?
Which deployment leads the wafer defect VQA market?
Who are the leading companies in the wafer defect VQA market?
Who worked on this report


Preview the report firsthand - request a free sample
Free SampleGet the brochure for pricing and purchase details
Download PDF