- Market Value (2025): USD 43.4 Mn
- Estimated Value (2026): USD 49.0 Mn
- Forecast Value (2036): USD 165.0 Mn
- CAGR (2026-2036): 12.9%
What is the MPC-Buoys Market forecast to be worth by 2036?
USD 49 million in 2026 to USD 165 million by 2036, at 12.9% CAGR from 2026 to 2036.
- The MPC-Buoys Market crossed a valuation of USD 43.4 million in 2025, supported by use across selected reservoirs and managed ponds.
- Demand is projected to increase from USD 49.0 million in 2026 to USD 165.0 million by 2036.
- The market is forecast to record a 12.9% CAGR from 2026 to 2036 as utilities and waterbody managers adopt continuous bloom monitoring and remote control systems.
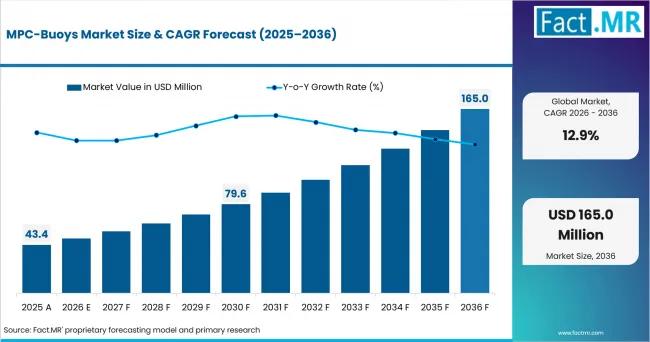
Mpc Buoys Market Value Analysis | Source: Fact.MR
What are the defining numbers behind MPC-Buoys Market growth?
USD 116 million absolute opportunity is projected by 2036, led by Drinking-water reservoirs and Ultrasonic algae inhibition within their respective segments.
- Demand Drivers in the Market
- Drinking-water operators need early warning when harmful algae start to form. This gives intake and treatment staff more time to respond before the bloom becomes difficult to control.
- Solar power and wireless data sharing are expected to support continuous monitoring at remote sites. These systems are useful where grid power is not available and daily site visits are not practical.
- Chlorophyll and phycocyanin readings are expected to show how algae levels are changing. Turbidity, dissolved oxygen, and pH readings can help operators understand the wider condition of the water.
- Subscription and managed-service plans are projected to make these systems available to more organizations. This is especially useful for operators that need alerts but do not have enough staff to study the data or change system settings.
- Key Segments Analyzed
- By Waterbody Type: Drinking-water reservoirs are expected to hold 34.0% share in 2026. Bloom risk affects source-water quality and treatment choices, which makes public-health response part of the buying case.
- By Control Function: Ultrasonic algae inhibition is projected to account for 39.0% share in 2026 because it turns the buoy into an actively managed control platform.
- By Sensor Package: Chlorophyll/phycocyanin is anticipated to hold 28.0% share in 2026 since these sensors provide fluorescence proxies for algal and cyanobacterial biomass trends.
- By Power Architecture: Solar autonomous is estimated to account for 52.0% share in 2026 as remote water locations favor continuous operation without shore-side electrical work.
- By Service Model: Equipment sale is forecast to hold 45.0% share in 2026 because utilities and established operators often want ownership of long-lived monitoring assets.
- Analyst Opinion at Fact.MR
- Shambhu Nath Jha, Senior Analyst at Fact.MR, states, “The MPC-Buoys Market is expected to grow as operators look for earlier bloom warnings and steady water monitoring. Before choosing a system, they are expected to check sensor accuracy, power life, data sharing, and maintenance support. Systems that handle monitoring, alerts, and treatment control through one service are expected to see stronger demand.”
- Strategic Implications
- Before installation, buoy companies are expected to explain how often the system requires calibration and cleaning. Details on communication links, power recovery, and remote support are also important.
- Clear product information helps water utilities separate bloom warning signs from direct toxin readings. This prevents operators from treating a fluorescence reading as proof that toxins are present.
- Sensor companies are expected to develop systems that share data with treatment planning and automatic reporting tools.
- Service companies are expected to list the cost of data review and alarm handling separately. Seasonal removal and reinstallation can affect the value of the system after purchase.
The Netherlands is projected to record a 14.2% CAGR from 2026 to 2036 because water management expertise favors continuous evidence and remotely coordinated operations. The United States is anticipated to post a 13.9% CAGR over the same period on reservoir protection and defensible bloom-response data. Australia is forecast to advance at a 13.4% CAGR from 2026 to 2036 as dispersed reservoirs increase the value of remote oversight. The United Kingdom at 13.2% and Denmark at 12.9% are expected to support European utility monitoring programs across the same forecast period.
How does the MPC-Buoys Market break down by segment?
The leading shares are Drinking-water reservoirs at 34.0% by Waterbody Type and Ultrasonic algae inhibition at 39.0% by Control Function.
Which deployment setting leads the MPC-Buoys Market?
Drinking-water reservoirs hold 34.0% share in 2026.
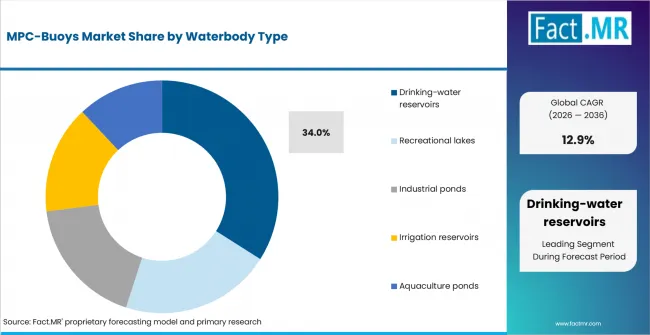
Mpc Buoys Market Analysis By Waterbody Type | Source: Fact.MR
Drinking-water reservoirs are expected to lead with 34.0% share in 2026 because bloom conditions can change raw-water quality and treatment planning. Utilities use these systems to track water changes before they reach the treatment plant. This setting also supports faster action when algae levels rise, making it the largest deployment area for MPC-Buoys.
What leads the Function segment?
Ultrasonic algae inhibition accounts for 39.0% share in 2026.
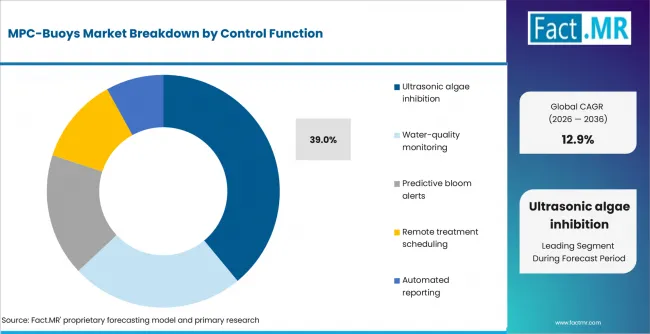
Mpc Buoys Market Analysis By Control Function | Source: Fact.MR
Ultrasonic algae inhibition is projected to lead with 39.0% share in 2026 because it adds an active control function to the buoy. Operators can monitor bloom conditions and respond through the same platform. This reduces the need for repeated site visits and helps water managers act earlier when algae growth begins to affect water quality.
Which sensor package holds the highest share?
Chlorophyll/phycocyanin packages hold 28.0% share in 2026.
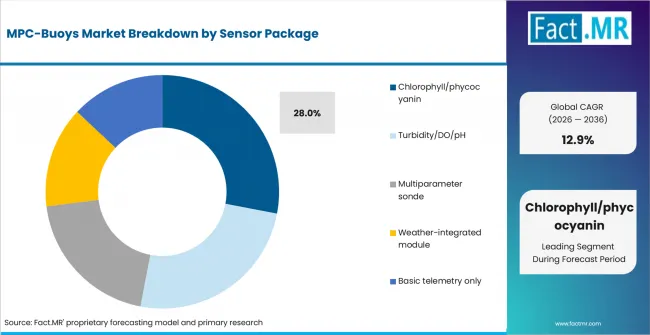
Mpc Buoys Market Analysis By Sensor Package | Source: Fact.MR
Chlorophyll/phycocyanin packages are anticipated to lead with 28.0% share in 2026 because they track pigment signals linked with algae and cyanobacteria. These readings help operators follow bloom changes over time. The sensors also support earlier warnings, especially during warmer months when algae levels can rise quickly and affect reservoir or pond conditions.
What leads the Power Architecture segment?
Solar autonomous systems lead with 52.0% share in 2026.
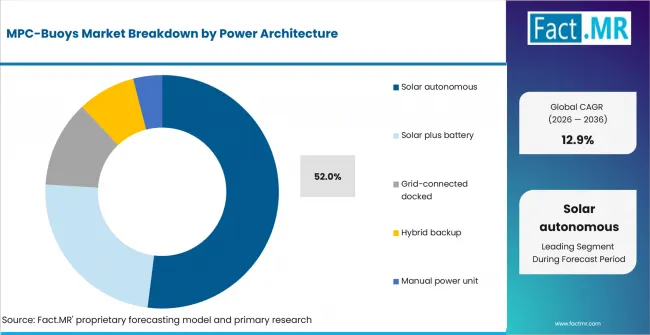
Mpc Buoys Market Analysis By Power Architecture | Source: Fact.MR
Solar autonomous systems are estimated to lead with 52.0% share in 2026 because many reservoirs and ponds are far from shore-side electricity. Solar power supports long operating periods without a grid connection. It also reduces routine power servicing and helps buoy systems remain active in remote locations where regular access may be difficult.
Which service model holds the largest share?
Equipment sales hold 45.0% share in 2026.
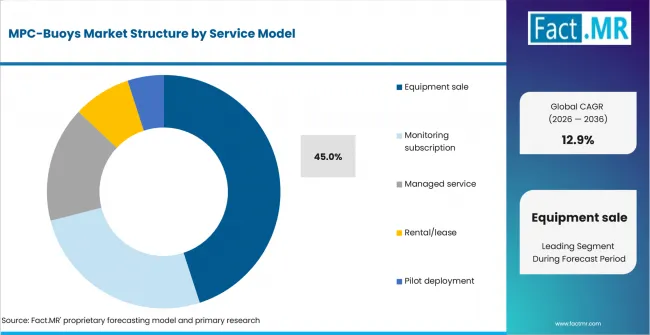
Mpc Buoys Market Analysis By Service Model | Source: Fact.MR
Equipment sales are forecast to lead with 45.0% share in 2026 because utilities and large water operators often prefer full ownership of monitoring assets. Internal field staff can manage calibration, maintenance, and data review. Ownership also gives operators more control over system use, servicing schedules, and long-term deployment across several water sites.
What is accelerating MPC-Buoys Market adoption, and what is holding it back?
The strongest accelerator is expected to be remote monitoring of bloom indicators before operating conditions deteriorate. The main restraint is expected to come from sensor upkeep and data interpretation with site-specific proof of control performance.
Drivers Impact Analysis
| DRIVER | (~) % IMPACT ON CAGR | GEOGRAPHIC RELEVANCE | IMPACT TIMELINE |
|---|---|---|---|
| Source-water risk management | +1.9% | United States and Australia with Europe | Long term (>= 4 years) |
| Autonomous field operation | +1.7% | Global | Medium term (2-4 years) |
| Early-warning analytics | +1.4% | Netherlands and United States with Australia | Medium term (2-4 years) |
| Remote treatment adjustment | +1.2% | Global | Short term (<= 2 years) |
| Environmental data integration | +0.9% | North America and Europe with Asia Pacific | Long term (>= 4 years) |
- Source-water risk management: Cyanobacterial blooms can complicate drinking-water operations and require proactive management, so reservoir operators are expected to invest in persistent observation and documented escalation procedures.
- Autonomous field operation: Solar generation and onboard batteries reduce dependence on shore infrastructure, and cellular or satellite links are expected to expand the pool of sites where continuous sensing is practical.
- Early-warning analytics: A time series of water-quality and weather data is expected to support earlier warning than visual inspection alone. Interest is expected to rise when alerts connect to sampling and treatment workflows.
Opportunity Impact Analysis
| OPPORTUNITY | (~) % IMPACT ON CAGR | GEOGRAPHIC RELEVANCE | IMPACT TIMELINE |
|---|---|---|---|
| Monitoring-as-a-service | +1.0% | Municipal markets globally | Short term (<= 2 years) |
| Modular sensor upgrades | +0.9% | Global | Medium term (2-4 years) |
| Reservoir network deployments | +0.8% | United States and Europe with Australia | Long term (>= 4 years) |
| Pilot-to-performance contracts | +0.6% | Netherlands and other European markets | Medium term (2-4 years) |
- Monitoring-as-a-service: Some operators need verified alerts and reports more than instrument ownership. A managed contract is expected to bundle installation and sensor care with data review and escalation into predictable operating spending.
- Modular sensor upgrades: Buoys with standard communications and physical interfaces can accept new sondes without replacing the entire platform. Upgradeability is expected to protect capital spending as monitoring questions change.
- Reservoir network deployments: Utilities managing several source waters can standardize dashboards and alarms across multiple units. Network sales are expected to add recurring software and service revenue across monitored reservoir groups.
Restraints Impact Analysis
| RESTRAINT | (~) % IMPACT ON CAGR | GEOGRAPHIC RELEVANCE | IMPACT TIMELINE |
|---|---|---|---|
| Biofouling and calibration load | -0.9% | Global | Short term (<= 2 years) |
| Proxy-to-toxin confusion | -0.7% | Global | Medium term (2-4 years) |
| Site-specific control performance | -0.6% | Global | Long term (>= 4 years) |
| Communications and power gaps | -0.5% | Remote regions | Medium term (2-4 years) |
- Biofouling and calibration load: Water-quality sensors require cleaning and verification even when automatic wipers are fitted. Periodic calibration remains necessary because neglected maintenance can create confident-looking data that no longer reflects the waterbody.
- Proxy-to-toxin confusion: Chlorophyll and phycocyanin measurements indicate biomass behavior but do not directly quantify every cyanotoxin. Operators still need suitable sampling and analytical methods when public-health decisions depend on toxin status.
- Site-specific control performance: Depth and circulation influence how control systems perform. Bloom species and nutrient conditions shape the same result. Shoreline geometry affects control coverage and each site is expected to need validation before broader deployment.
Where are MPC-buoys being adopted first?
Netherlands 14.2%, United States 13.9%, United Kingdom 13.2%, Denmark 12.9%, Australia 13.4%
Regional analysis covers North America and Europe with Asia Pacific across the selected country outlook. Country detail includes the Netherlands and the United States alongside the United Kingdom and Denmark. Australia is covered as a separate market and the complete report extends this coverage to more than 30 countries.
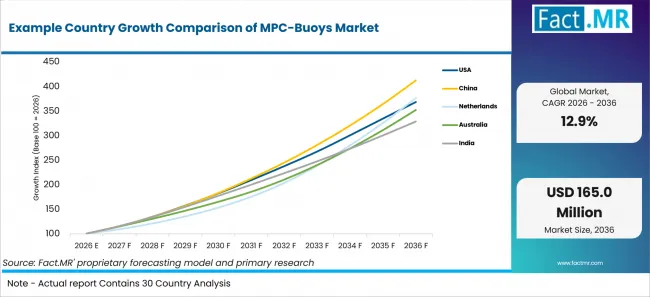
Example Country Growth Comparison Of Mpc Buoys Market | Source: Fact.MR
| COUNTRY | CAGR from 2026 to 2036 |
|---|---|
| Netherlands | 14.2% |
| United States | 13.9% |
| United Kingdom | 13.2% |
| Denmark | 12.9% |
| Australia | 13.4% |
What makes the Netherlands a strong MPC-Buoys Market?
14.2% CAGR, supported by established water boards and connected water-quality programs.
The Netherlands already manages lakes, rivers, and reservoirs through regional water boards and national monitoring systems. MPC buoys add continuous bloom readings between scheduled sampling rounds and allow data to move into existing water-management platforms. The market is projected to expand at a 14.2% CAGR from 2026 to 2036 as authorities link local sensor data with maintenance and treatment planning.
How is United States demand developing for MPC buoys?
13.9% CAGR, driven by reservoir protection and the need for local bloom evidence.
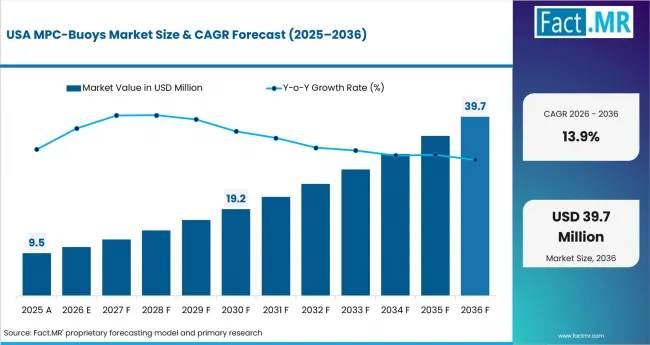
Mpc Buoys Market Country Value Analysis | Source: Fact.MR
The United States uses satellite tools to screen lakes for possible cyanobacteria, but reservoir managers still require site-level readings for operating decisions. MPC buoys provide continuous local measurements and help staff track changing conditions at different depths. Demand is anticipated to record a 13.9% CAGR through 2036 as utilities combine wide-area bloom alerts with field data and remote intervention.
What supports the United Kingdom outlook?
13.2% CAGR, owing to reservoir monitoring and clearer public bloom warnings.
United Kingdom water operators manage reservoirs where algal blooms can affect treatment plans, recreation, and public communication. The Lough Neagh monitoring program already publishes buoy readings for phycocyanin, oxygen, temperature, and turbidity. The market is forecast to grow at a 13.2% CAGR from 2026 to 2036 as water companies connect live bloom indicators with utility dashboards and access decisions.
Why is Denmark adopting autonomous monitoring early?
12.9% CAGR, supported by national lake monitoring and digital environmental reporting.
Denmark has a long-running lake-monitoring framework under the NOVANA program, giving water authorities an established base for adding continuous sensor readings. MPC buoys help fill the time between field surveys when blue-green algae levels can change quickly. The market is expected to post a 12.9% CAGR through 2036 as compact systems feed data into wider environmental monitoring and reporting networks.
Why are autonomous MPC buoys relevant in Australia?
13.4% CAGR, backed by dispersed reservoirs and costly manual site visits.
Australia’s long distances make regular sampling difficult across remote reservoirs and managed lakes. Solar-powered MPC buoys reduce travel while maintaining continuous visibility of bloom indicators, water temperature, and changing site conditions. Demand is projected to rise at a 13.4% CAGR from 2026 to 2036 as operators favour rugged equipment that can handle strong heat, shifting water levels, and limited access.
Who leads the MPC-Buoys Market?
LG Sonic leads the MPC-Buoys Market with its MPC-Buoy system. Xylem Inc., NexSens Technology, and OTT HydroMet also hold strong positions by providing sensors, data transfer systems, and support for field use.
LG Sonic brings algae control, water testing, and remote operation together in one buoy. Its systems are designed for reservoirs, lakes, and managed ponds. Xylem Inc. supports the market with sensors that measure several water conditions at the same time. Competition mainly depends on sensor accuracy, protection against algae and dirt buildup, and steady data transfer from remote sites.
NexSens Technology offers floating platforms that send water data to online systems for regular tracking. OTT HydroMet provides water-testing equipment, communication systems, and field support. Operators also look at alert settings, power supply, and backup communication before choosing a system. Work between algae-treatment companies and sensor makers is expected to grow as water operators look for one complete service covering installation, remote help, and regular maintenance.
Which companies are the key providers?
The provider set includes LG Sonic, treated as the central product line. Xylem Inc. and NexSens Technology are covered alongside OTT HydroMet for telemetry and hydrology monitoring relevance.
- LG Sonic
- Xylem Inc.
- NexSens Technology
- OTT HydroMet
Bibliography
- LG Sonic. (2025, April 24). The science behind interactive algae control: MPC-Buoy.
- U.S. Environmental Protection Agency. (2025, August 18). HAB monitoring and trends.
- World Health Organization. (2024, November 25). Management of cyanobacteria in drinking-water supplies: Information for regulators and water suppliers (2nd ed.).
- Centers for Disease Control and Prevention. (2025, December 11). Building public health capacity for harmful algal blooms.
- National Environmental Satellite, Data, and Information Service. (2026, January 23). NOAA using satellites and AI to map global algal blooms. National Oceanic and Atmospheric Administration.
This Report Addresses
- The report explains how early warnings and remote control affect buying decisions. It also looks at the maintenance work required after the system is installed.
- The country review includes the Netherlands, the United States, the United Kingdom, Denmark, and Australia. The full study covers more than 30 countries.
- The company section reviews LG Sonic, Xylem Inc., NexSens Technology, and OTT HydroMet. OTT HydroMet is included for its work in data transfer and water monitoring.
- The technology section looks at sensor options, power systems, data transfer, and data review as separate parts of the buoy system. Ultrasonic control is covered on its own because it allows the buoy to take action, not just observe water conditions.
- The waterbody section covers drinking-water reservoirs, recreational lakes, industrial ponds, irrigation reservoirs, and aquaculture ponds. Aquaculture ponds are kept as a separate group.
- The forecast links revenue from equipment and services with the number of installed units and paid service plans. Maintenance capacity is reviewed separately. Trial projects are also tracked on their own so they are not counted as full operating systems.
What does the MPC-Buoys Market cover?
Integrated floating systems are used to observe and anticipate algae conditions. The same systems help manage algae conditions in freshwater bodies when control hardware is included.
The report measures equipment and related service value across five defined dimensions covering waterbody type and control function. Sensor package and power architecture are measured separately, and service model is treated as its own dimension. The scope separates monitoring indicators from laboratory toxin confirmation when discussing operational use.
What is included in the scope?
Covered systems combine a buoy platform with sensing and communications. Prediction and reporting are included when they form part of the commercial buoy solution. Control components are included when they are part of the same covered system.
Hardware coverage includes autonomous and assisted power packages with algae and water-quality sensors. Telemetry and data logging are included with mooring and ultrasonic components when they form part of the covered buoy configuration. Commercial coverage includes equipment sales and subscriptions alongside managed service and rental or lease models. Paid pilot deployment is tracked separately to keep trial revenue distinct from operating deployments.
The analysis includes configurations for source-water reservoirs and public lakes alongside industrial waters and irrigation waters. Aquaculture ponds are included without adding waterbody classes outside the defined scope.
What is excluded from the scope?
Standalone laboratory and satellite markets are excluded because they do not represent integrated floating control systems. Chemical-treatment and unrelated buoy markets are also excluded from the scope.
It does not count the full value of water-treatment plants or laboratory toxin assays. Navigation systems and remote-sensing services are excluded unless sold as part of the covered buoy solution. Generic monitoring buoys lacking an algae-management proposition also fall outside the boundary.
How Was the Analysis Built?
The analysis draws on 120+ sources, 35+ company portfolios, 25+ countries, and more than 20 industry interviews.
- Primary Research: Primary research includes discussions with manufacturers, service providers, technology developers, distributors, end users, procurement teams, and subject-matter experts. These conversations examine purchasing priorities, product adoption, operational challenges, approval requirements, competitive positioning, and the factors that influence wider market acceptance.
- Desk Research: Desk research covers government statistics, regulatory publications, company filings, trade data, technical studies, industry associations, standards, public policy, and other authoritative sources. Every source used in the analysis is documented in the bibliography.
- Market Sizing and Forecasting: Market estimates combine historical performance, demand indicators, pricing and volume trends, segment shares, company participation, country-level growth, adoption patterns, investment activity, and barriers to market expansion.
- Data Validation and Update Cycle: Findings are validated by comparing primary interviews with public data, company activity, regulatory changes, trade patterns, and industry developments. Regular updates review new product launches, capacity changes, partnerships, approvals, procurement trends, and shifts in commercial adoption.
What is the report's scope and coverage?
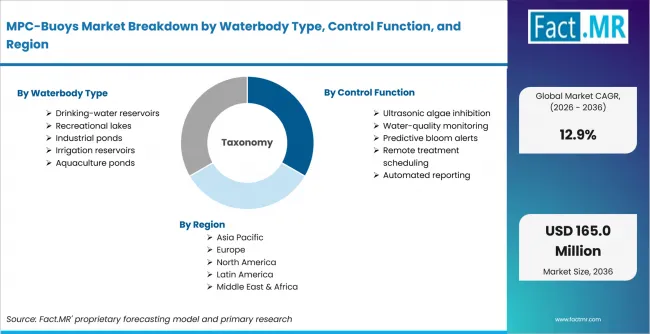
Mpc Buoys Market Breakdown By Waterbody Type, Control Function, And Region | Source: Fact.MR
| ATTRIBUTE | DETAILS |
|---|---|
| Quantitative Units | USD million in 2026 to USD million by 2036 at a CAGR |
| Market Definition | The market covers floating monitor-predict-control systems and associated services that combine water-quality sensing with telemetry and autonomous operation. Analytics and alerts are included alongside optional ultrasonic algae inhibition for managed freshwater bodies. |
| Waterbody Type | Drinking-water reservoirs; Recreational lakes; Industrial ponds; Irrigation reservoirs; Aquaculture ponds |
| Control Function | Ultrasonic algae inhibition; Water-quality monitoring; Predictive bloom alerts; Remote treatment scheduling; Automated reporting |
| Sensor Package | Chlorophyll/phycocyanin; Turbidity/DO/pH; Multiparameter sonde; Weather-integrated module; Basic telemetry only |
| Power Architecture | Solar autonomous; Solar plus battery; Grid-connected docked; Hybrid backup; Manual power unit |
| Service Model | Equipment sale; Monitoring subscription; Managed service; Rental/lease; Pilot deployment |
| Regions Covered | North America; Europe; Asia Pacific; Latin America; Middle East and Africa |
| Countries Covered | Netherlands; United States; United Kingdom; Denmark; Australia, and 30+ countries |
| Key Companies Profiled | LG Sonic; Xylem Inc.; NexSens Technology; OTT HydroMet. |
| Forecast Period | 2026 to 2036 |
| Approach | Sizing combines unit deployments with configured sensor and control value. Software and service revenue are counted with replacement parts and conversion of pilots or rentals into operating fleets. |
How is the market segmented?
-
By Waterbody Type
- Drinking-water reservoirs
- Recreational lakes
- Industrial ponds
- Irrigation reservoirs
- Aquaculture ponds
-
By Control Function
- Ultrasonic algae inhibition
- Water-quality monitoring
- Predictive bloom alerts
- Remote treatment scheduling
- Automated reporting
-
By Sensor Package
- Chlorophyll/phycocyanin
- Turbidity/DO/pH
- Multiparameter sonde
- Weather-integrated module
- Basic telemetry only
-
By Power Architecture
- Solar autonomous
- Solar plus battery
- Grid-connected docked
- Hybrid backup
- Manual power unit
-
By Service Model
- Equipment sale
- Monitoring subscription
- Managed service
- Rental/lease
- Pilot deployment
-
By Region
- North America
- United States
- Europe
- Netherlands
- United Kingdom
- Denmark
- Asia Pacific
- Australia