- Market Value (2025): USD 59.4 Bn
- Estimated Value (2026): USD 62.8 Bn
- Forecast Value (2036): USD 109.3 Bn
- CAGR (2026-2036): 5.7%
What is the Deep Water and Ultra Deep Water Exploration Production EP Market forecast to be worth by 2036?
USD 62.8 billion in 2026 to USD 109.3 billion by 2036 at 5.7% CAGR.
- The deep water and ultra deep water exploration production EP market reached USD 59.4 billion in 2025 as operators continued to plan offshore reserve replacement.
- Demand is projected to increase from USD 62.8 billion in 2026 to USD 109.3 billion by 2036.
- The market is forecast to record 5.7% CAGR from 2026 to 2036.
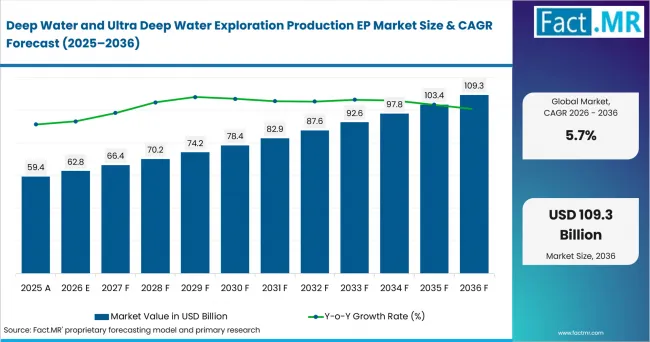
Deep Water And Ultra Deep Water Exploration Production Ep Market Value Analysis | Source: Fact.MR
What are the defining numbers behind Deep Water and Ultra Deep Water Exploration Production EP Market growth?
USD 46.9 billion absolute opportunity by 2036.
- Demand Drivers in the Market
- Operators need deeper reservoir access as mature shallow-water fields offer fewer simple replacement options.
- Floating systems and subsea systems support projects where fixed platforms cannot match water depth or field distance.
- Subsea tiebacks are expected to reduce new surface-facility needs when nearby host capacity is available.
- High-pressure wells require reliable completions and clear field documentation before procurement teams approve project equipment.
- Key Segments Analyzed
- By Water Depth Category: Ultra Deep Water is expected to account for 46.0% share in 2026 since deeper reservoirs carry the highest equipment value.
- By Production System: Floating Production Systems is projected to hold 43.0% share in 2026 as floating assets support fields beyond fixed-platform economics.
- By Application Area: Offshore Oil Production is anticipated to capture 48.0% share in 2026 where crude-focused projects anchor deepwater capital decisions.
- By Operator Type: Integrated Oil Companies are estimated to represent 45.0% share in 2026 due to balance-sheet depth and project governance.
- By Offshore Technology: Subsea Production Systems are forecast to hold 41.0% share in 2026 as subsea equipment controls wells and flow paths.
- Analyst Opinion at Fact.MR
- Shambhu Nath Jha, Principal Consultant at Fact.MR, states, “Deep Water and Ultra Deep Water Exploration Production EP suppliers need to prove performance under specific field conditions. Broad capability claims are not enough. Repeat work is expected to depend on reliability, documentation and execution discipline across long offshore project cycles.”
- Strategic Implications
- Operators should map equipment choice to field depth before bids are compared against project economics.
- Suppliers can strengthen bids by showing documented performance in comparable basins and subsea operating conditions.
- Service providers offering managed pressure drilling services should connect capability with well-control outcomes and operating-cost discipline.
- Investors should separate direct deepwater exposure from adjacent offshore services since sanction timing differs across the value chain.
The USA leads at 6.8% CAGR through Gulf of America activity and service-company reach. Brazil follows at 6.4% as pre-salt work supports subsea demand. Norway reaches 6.1% through North Sea tiebacks. Guyana is forecast at 5.8%. The UK posts 5.5%. Canada reaches 5.2%. Angola records 4.9%.
How does the Deep Water and Ultra Deep Water Exploration Production EP Market break down by segment?
Ultra Deep Water leads Water Depth Category with 46.0% share in 2026. Floating Production Systems leads Production System with 43.0%.
Why does Ultra Deep Water lead Water Depth Category?
Ultra Deep Water is projected to account for 46.0% share in 2026.
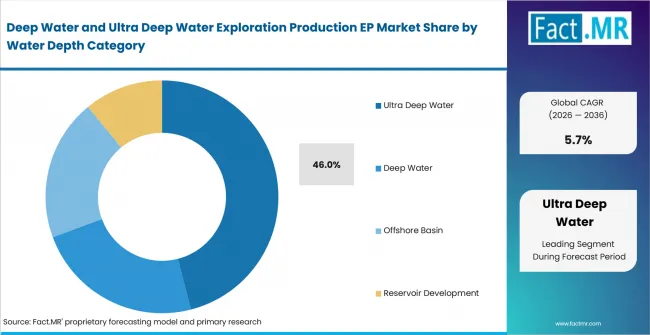
Deep Water And Ultra Deep Water Exploration Production Ep Market Analysis By Water Depth Category | Source: Fact.MR
Ultra-deep projects carry the highest equipment burden because wells and risers work under greater water depth. Operators favor this category when reserve scale justifies larger subsea layouts and tension leg platforms.
Why do Floating Production Systems lead Production System?
Floating Production Systems are expected to hold 43.0% share in 2026.
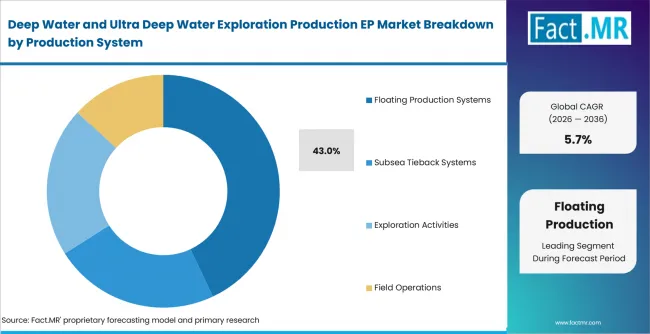
Deep Water And Ultra Deep Water Exploration Production Ep Market Analysis By Production System | Source: Fact.MR
This segment leads where fixed structures are not practical. FPSO and related systems support phased development. Flexible pipe demand follows field layout and motion needs.
Why does Offshore Oil Production lead Application Area?
Offshore Oil Production is anticipated to account for 48.0% share in 2026.
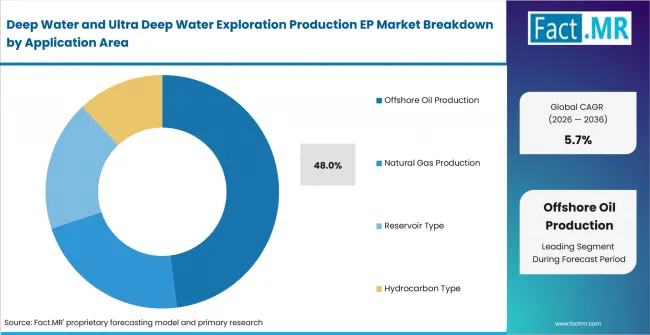
Deep Water And Ultra Deep Water Exploration Production Ep Market Analysis By Application Area | Source: Fact.MR
Oil-focused projects usually carry larger capital programs across drilling and subsea production. Gas projects remain important when infrastructure and offtake agreements are available.
Why do Integrated Oil Companies lead Operator Type?
Integrated Oil Companies are estimated to capture 45.0% share in 2026.
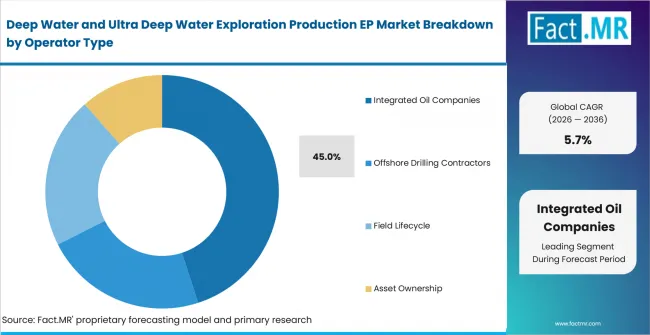
Deep Water And Ultra Deep Water Exploration Production Ep Market Analysis By Operator Type | Source: Fact.MR
These operators have the capital depth needed for long-cycle offshore work. Drilling contractors remain central to execution. Integrated operators usually control sanction timing.
Why do Subsea Production Systems lead Offshore Technology?
Subsea Production Systems are forecast to hold 41.0% share in 2026.
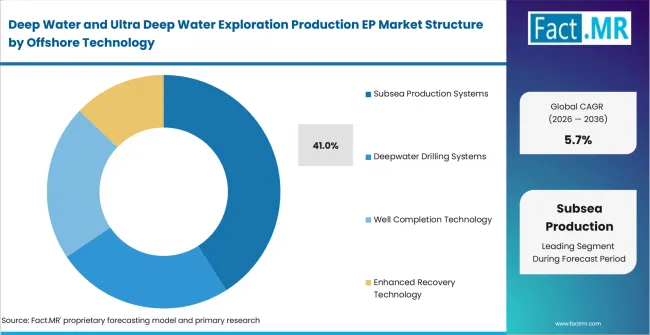
Deep Water And Ultra Deep Water Exploration Production Ep Market Analysis By Offshore Technology | Source: Fact.MR
The segment leads because wells must connect safely to manifolds and host facilities. Deepwater Drilling Systems and Well Completion Technology support project entry. Subsea thermal insulation materials protect flow assurance.
What is accelerating Deep Water and Ultra Deep Water Exploration Production EP Market adoption, and what is holding it back?
Demand is expected to rise through deeper field development and better subsea execution. Cost, qualification time and offshore supply pressure are expected to slow sanction decisions.
Drivers Impact Analysis
| DRIVER | (~) % IMPACT ON CAGR | GEOGRAPHIC RELEVANCE | IMPACT TIMELINE |
|---|---|---|---|
| Deepwater reservoir access | +1.6% | Global | Short term (<= 2 years) |
| Subsea system integration | +1.4% | USA, Brazil, Norway | Short term (<= 2 years) |
| Floating production deployment | +1.1% | Brazil, Guyana, Angola | Medium term (2-4 years) |
| Specification and documentation | +0.9% | USA, UK, Canada | Medium term (2-4 years) |
| Operating-efficiency gains | +0.6% | Global | Long term (>= 4 years) |
Source: Fact.MR analysis. Updated Aug 6, 2026
- Deepwater reservoir access: Operators are expected to move project screening toward deeper reservoirs when shallow options offer weaker replacement value.
- Subsea system integration: Production equipment must operate with manifolds and controls inside one field plan. Subsea pipeline monitoring reinforces interface reliability.
- Floating production deployment: Floating systems are expected to support fields where fixed platforms are uneconomic or difficult to install.
Opportunity Impact Analysis
| OPPORTUNITY | (~) % IMPACT ON CAGR | GEOGRAPHIC RELEVANCE | IMPACT TIMELINE |
|---|---|---|---|
| Subsea tieback development | +1.0% | Global | Medium term (2-4 years) |
| Specialist high-pressure packages | +0.8% | USA, Brazil, Guyana | Medium term (2-4 years) |
| Channel and service partners | +0.7% | Global | Long term (>= 4 years) |
| Safety and compliance documentation | +0.5% | USA, Canada, UK | Long term (>= 4 years) |
Source: Fact.MR analysis. Updated Aug 6, 2026
- Subsea tieback development: Tiebacks are expected to create demand where operators use existing host facilities instead of building new surface assets.
- Specialist high-pressure packages: Suppliers that document high-pressure performance are expected to gain preference in wells with demanding pressure conditions.
- Channel and service partners: Offshore service networks matter where installation and remote support affect project uptime. Offshore robotics can strengthen this service case.
Restraints Impact Analysis
| RESTRAINT | (~) % IMPACT ON CAGR | GEOGRAPHIC RELEVANCE | IMPACT TIMELINE |
|---|---|---|---|
| Project cost and complexity | -1.1% | Global | Short term (<= 2 years) |
| Qualification and compliance checks | -0.9% | USA, UK, Norway | Short term (<= 2 years) |
| Lower-cost substitute options | -0.7% | Import-dependent markets | Medium term (2-4 years) |
| Supply chain and pricing pressure | -0.5% | Global | Long term (>= 4 years) |
Source: Fact.MR analysis. Updated Aug 6, 2026
- Project cost and complexity: Deepwater projects require long planning cycles and high-specification equipment. Smaller operators are expected to delay awards until economics are clearer.
- Qualification and compliance checks: Offshore equipment must pass safety and environmental review before installation. These checks can lengthen procurement.
- Supply chain and pricing pressure: Vessel availability and specialized component lead times can affect project timing. Robotic drilling is expected to reduce crew exposure during complex campaigns.
Which countries are scaling the Deep Water and Ultra Deep Water Exploration Production EP Market fastest?
- The country comparison spans 1.9 percentage points and forms a clear growth range across the forecast period.
- The USA remains 0.4 percentage points above Brazil through Gulf of America activity and service-company reach.
- Brazil remains 0.3 percentage points above Norway as pre-salt projects sustain subsea demand.
- Norway remains 0.3 percentage points above Guyana through North Sea tiebacks and offshore engineering depth.
- Guyana remains 0.3 percentage points above the UK as new project sequencing supports floating production demand.
- The UK remains 0.3 percentage points above Canada through selective redevelopment and technical service demand.
- Canada remains 0.3 percentage points above Angola as procurement discipline supports more selective growth.
Comparable CAGRs can create different entry conditions due to basin maturity and operator mix. Full report coverage includes North America; Latin America; Europe; East Asia; South Asia and Pacific; Middle East and Africa.
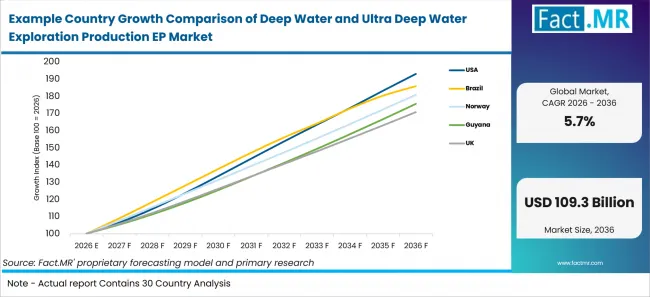
Example Country Growth Comparison Of Deep Water And Ultra Deep Water Exploration Production Ep Market | Source: Fact.MR
Country CAGR (2026-2036)
| Country | CAGR |
|---|---|
| USA | 6.8% |
| Brazil | 6.4% |
| Norway | 6.1% |
| Guyana | 5.8% |
| UK | 5.5% |
| Canada | 5.2% |
| Angola | 4.9% |
Source: Fact.MR analysis. Updated Aug 6, 2026
What supports USA adoption?
6.8% CAGR, supported by Gulf of America activity and established offshore services.
Operators require reservoir insight before high-value awards. Local engineering support is expected to improve supplier selection.
How is Brazil scaling demand?
6.4% CAGR, backed by pre-salt field development and subsea equipment needs.
Brazil’s projects require floating production and high-pressure well equipment. Local execution capacity is expected to improve vendor fit.
What is driving Norway’s growth from 2026 to 2036?
6.1% CAGR, led by North Sea tiebacks and field-life extension.
Operators use existing infrastructure to extend offshore asset value. Subsea controls are expected to remain important.
How is Guyana developing demand?
5.8% CAGR, driven by new project sequencing and floating production demand.
Guyana’s pipeline requires careful coordination of subsea production and vessel availability. Installation discipline is expected to guide supplier selection.
How does the UK perform?
5.5% CAGR, supported by selective redevelopment and technical service demand.
The UK remains a mature offshore basin where spending is tied to redevelopment. Compliance documentation is expected to support supplier selection.
What supports Canada’s growth?
5.2% CAGR, backed by offshore asset discipline and qualification requirements.
Canada’s demand reflects long planning cycles and careful procurement review. Service readiness is expected to guide supplier selection.
How is Angola positioned?
4.9% CAGR, supported by offshore oil production and subsea project services.
Angola’s demand depends on field economics and supplier availability. Cost discipline is expected to slow some awards.
Who leads the Deep Water and Ultra Deep Water Exploration Production EP Market?
SLB and TechnipFMC hold strong positions through subsea production, well construction and integrated offshore delivery, while Halliburton and Baker Hughes add completion, stimulation and high-pressure equipment capability.
Transocean contributes deepwater drilling capacity. Saipem and Subsea7 strengthen offshore installation and field-development execution. Weatherford supports well services, while Aker Solutions and Oceaneering broaden subsea engineering, controls and intervention coverage.
Which companies are the key providers?
Key companies include SLB; Halliburton Company; Baker Hughes Company; TechnipFMC plc; Transocean Ltd.; Saipem S.p.A.; Subsea7 S.A.; Weatherford International plc; Aker Solutions ASA; and Oceaneering International, Inc.
- SLB
- Halliburton Company
- Baker Hughes Company
- TechnipFMC plc
- Transocean Ltd.
- Saipem S.p.A.
- Subsea7 S.A.
- Weatherford International plc
- Aker Solutions ASA
- Oceaneering International, Inc.
Bibliography
- Baker Hughes Company. (2026, May 26). Baker Hughes Extends and Expands Integrated Well Construction Contract with Petrobras.
- Halliburton Company. (2025, October 15). Petrobras Awards Halliburton Deepwater Contracts for Completion and Stimulation Services in Brazil.
- International Energy Agency. (2025, September 16). The Implications of Oil and Gas Field Decline Rates.
- Saipem S.p.A. (2026, April 21). Saipem: new offshore contract by ExxonMobil Guyana.
- SLB. (2026, June 8). SLB OneSubsea Secures Subsea Boosting Contract for bp’s Thunder Horse Project in Gulf of America.
This Report Answers
- The report provides strategic intelligence on the Deep Water and Ultra Deep Water Exploration Production EP Market across depth choices.
- Segment analysis covers Ultra Deep Water and Floating Production Systems as share leaders within the 2026 market.
- Country outlook evaluates the USA and Brazil alongside Norway and Guyana. The UK, Canada and Angola complete coverage.
- Competitive analysis profiles SLB, Halliburton Company and Baker Hughes Company. TechnipFMC plc, Transocean Ltd. and Saipem S.p.A. complete coverage.
- Offshore-technology assessment covers Subsea Production Systems and Deepwater Drilling Systems. Well Completion Technology completes coverage.
What does the Deep Water and Ultra Deep Water Exploration Production EP Market cover?
Deep water and ultra deep water exploration production EP covers offshore field activity where operators need deepwater drilling, subsea production and floating production systems.
The market covers exploration and production work below conventional shallow-water depths. Coverage extends to subsea tiebacks and well completions. Floating production systems are included when they support deepwater EP. It covers subsea controls and flowlines used in deepwater EP activity.
What is included in the scope?
Deep water and ultra deep water EP is used across integrated oil companies and offshore drilling contractors. Field owners and service providers are included when they support offshore development.
The scope includes Water Depth Category and Production System alongside Application Area, Operator Type and Offshore Technology. Coverage spans Ultra Deep Water and Deep Water. Floating Production Systems and Subsea Tieback Systems are included.
What is excluded from the scope?
Shallow-water projects and unrelated onshore exploration remain outside the scope of this market.
The scope excludes downstream refining and retail fuel activity. Generic marine support services are excluded unless they support deepwater EP. Company revenue without a clear deepwater EP connection is excluded.
How Was the Analysis Built?
The analysis draws on 120+ sources; 35+ company portfolios; 25+ countries; and more than 20 industry interviews.
- Primary Research: Primary research includes discussions with manufacturers; service providers; technology developers; distributors; end users; procurement teams; and subject-matter experts. These conversations examine purchasing priorities; product adoption; operational challenges; approval requirements; competitive positioning; and the factors that influence wider market acceptance.
- Desk Research: Desk research covers government statistics; regulatory publications; company filings; trade data; technical studies; industry associations; standards; public policy; and other authoritative sources. Every source used in the analysis is documented in the bibliography.
- Market Sizing and Forecasting: Market estimates combine historical performance; demand indicators; pricing and volume trends; segment shares; company participation; country-level growth; adoption patterns; investment activity; and barriers to market expansion.
- Data Validation and Update Cycle: Findings are validated by comparing primary interviews with public data; company activity; regulatory changes; trade patterns; and industry developments. Regular updates review new product launches; capacity changes; partnerships; approvals; procurement trends; and shifts in commercial adoption.
Segmentation
What is the report’s scope and coverage?
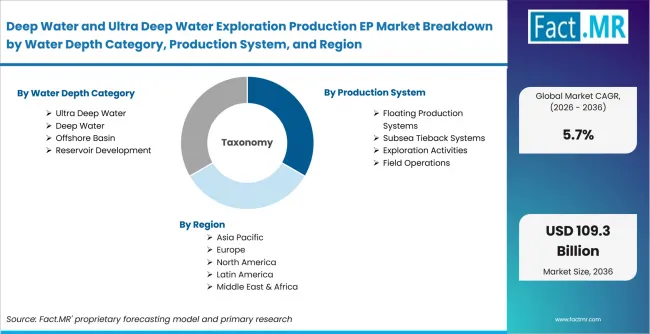
Deep Water And Ultra Deep Water Exploration Production Ep Market Breakdown By Water Depth Category, Production System, And Region | Source: Fact.MR
| Attribute | Details |
|---|---|
| Quantitative Units | USD billion |
| Market Definition | Deep Water and Ultra Deep Water Exploration Production EP products and services used for offshore exploration, drilling, completion, subsea production and field operations in deep water and ultra deep water projects |
| Water Depth Category | Ultra Deep Water; Deep Water; Offshore Basin; Reservoir Development |
| Production System | Floating Production Systems; Subsea Tieback Systems; Exploration Activities; Field Operations |
| Application Area | Offshore Oil Production; Natural Gas Production; Reservoir Type; Hydrocarbon Type |
| Operator Type | Integrated Oil Companies; Offshore Drilling Contractors; Field Lifecycle; Asset Ownership |
| Offshore Technology | Subsea Production Systems; Deepwater Drilling Systems; Well Completion Technology; Enhanced Recovery Technology |
| Regions Covered | North America; Latin America; Europe; East Asia; South Asia and Pacific; Middle East and Africa |
| Countries Covered | USA; Brazil; Norway; Guyana; UK; Canada; Angola |
| Key Companies Profiled | SLB; Halliburton Company; Baker Hughes Company; TechnipFMC plc; Transocean Ltd.; Saipem S.p.A.; Subsea7 S.A.; Weatherford International plc; Aker Solutions ASA; Oceaneering International, Inc. |
| Forecast Period | 2026 to 2036 |
| Approach | Hybrid top-down and bottom-up approach using offshore project activity; water depth requirements; subsea production needs; floating production deployment; well construction activity; tieback development; country adoption patterns; pricing; procurement criteria and company portfolio review |
Source: Fact.MR analysis. Updated Aug 6, 2026
How is the market segmented?
-
By Water Depth Category:
- Ultra Deep Water
- 2,000–3,000 m
- Above 3,000 m
- Deep Water
- 500–1,500 m
- 1,500–2,000 m
- Offshore Basin
- Pre-salt Basins
- Post-salt Basins
- Reservoir Development
- Primary Recovery
- Secondary Recovery
- Ultra Deep Water
-
By Production System:
- Floating Production Systems
- FPSO Systems
- Semi-submersible Platforms
- Subsea Tieback Systems
- Long-distance Tiebacks
- Subsea Boosting Systems
- Exploration Activities
- Seismic Surveys
- Exploration Drilling
- Field Operations
- Production Optimization
- Asset Integrity Management
- Floating Production Systems
-
By Application Area:
- Offshore Oil Production
- Crude Oil Extraction
- Gas Condensate Production
- Natural Gas Production
- LNG Feed Gas
- Enhanced Oil Recovery
- Reservoir Type
- Carbonate Reservoirs
- Sandstone Reservoirs
- Hydrocarbon Type
- Offshore Crude Oil
- Natural Gas
- Offshore Oil Production
-
By Operator Type:
- Integrated Oil Companies
- National Oil Companies
- Independent E&P Companies
- Offshore Drilling Contractors
- Field Development Operators
- Service Companies
- Field Lifecycle
- Field Development
- Field Expansion
- Asset Ownership
- Joint Venture Assets
- Wholly Owned Assets
- Integrated Oil Companies
-
By Offshore Technology:
- Subsea Production Systems
- Subsea Trees
- Subsea Manifolds
- Deepwater Drilling Systems
- Dynamic Positioning Systems
- Remotely Operated Vehicles (ROVs)
- Well Completion Technology
- Intelligent Completion Systems
- Multilateral Well Systems
- Enhanced Recovery Technology
- Subsea Compression Systems
- Digital Offshore Monitoring
- Subsea Production Systems
-
By Region:
- North America
- Latin America
- Europe
- East Asia
- South Asia and Oceania
- Middle East and Africa
Frequently Asked Questions
How big is the deep water and ultra deep water exploration production EP market in 2026?
What is the CAGR of the deep water and ultra deep water exploration production EP market from 2026 to 2036?
Which water depth category leads the deep water and ultra deep water exploration production EP market?
Which production system leads the deep water and ultra deep water exploration production EP market?
Floating Production Systems account for 43.0% of the deep water and ultra deep water exploration production EP market by production system in 2026, supported by their suitability for fields where fixed platforms are impractical or uneconomic.
Who worked on this report


Preview the report firsthand - request a free sample
Free SampleGet the brochure for pricing and purchase details
Download PDF