- Market Value (2025):USD 2,005.7 Bn
- Estimated Value (2026): USD 2,100.0 Bn
- Forecast Value (2036): USD 3,324.2 Bn
- CAGR (2026-2036): 4.7%
What is the Office Real Estate Market forecast to be worth by 2036?
USD 2,100.0 billion in 2026 to USD 3,324.2 billion by 2036 at 4.7% CAGR.
- The office real estate market reached USD 2,005.7 billion in 2025 as occupiers kept prioritizing better-located space with more dependable building service.
- Demand is projected to increase from USD 2,100.0 billion in 2026 to USD 3,324.2 billion by 2036.
- The market is forecast to record 4.7% CAGR from 2026 to 2036 owing to Grade A building demand and corporate office planning.
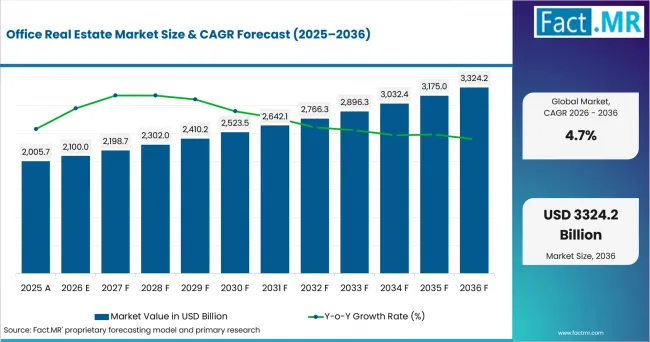
Office Real Estate Market Value Analysis | Source: Fact.MR
What are the defining numbers behind Office Real Estate Market growth?
USD 1,224.2 billion absolute opportunity by 2036.
- Demand Drivers in the Market
- Grade A offices attract tenants that need reliable locations and building services before signing longer commitments.
- Corporate office demand is expected to benefit from employers that combine scattered footprints into better-performing buildings.
- Large enterprises require leasing structures that support governance and service accountability across regional portfolios.
- Direct leasing helps owners and occupiers control negotiation detail when fit-out cost and renewal flexibility shape approval.
- Key Segments Analyzed
- By Property Type: Grade A Office Buildings are expected to hold 37.4% share in 2026 because occupiers prefer assets with stronger service reliability.
- By Application: Corporate Offices are projected to account for 31.2% share in 2026 as enterprises use offices for management and client access.
- By End User: Large Enterprises are anticipated to capture 32.8% share in 2026 since they need multi-location governance and longer lease visibility.
- By Distribution Channel: Direct Leasing is estimated to represent 30.0% share in 2026 due to direct control over terms and fit-out duties.
- By Ownership Type: Private Ownership is forecast to hold 35.2% share in 2026 as private owners retain more flexibility in leasing decisions.
- Analyst Opinion at Fact.MR
- Shambhu Nath Jha, Principal Consultant at Fact.MR, states “Office real estate demand is no longer judged only by floor area. Grade A buildings are expected to hold attention when service reliability reduces operating uncertainty for occupiers.”
- Strategic Implications
- Asset owners should treat Grade A Offices as a practical risk filter within long-term portfolio planning. Clear tenant demand and renewal visibility are expected to support stronger proposals.
- Advisory firms can improve conversion by pairing real estate brokerage with property management services. This gives occupiers clearer building detail during lease execution.
- Investors should compare office repositioning with office-to-residential conversion services before writing down older assets. That review separates obsolete inventory from buildings that still support corporate demand.
Germany is projected at 37.4%; Brazil is projected at 4.9%; Australia is projected at 4.6%; USA is projected at 4.5%; Canada is projected at 4.1%; UK is projected at 4.0%; and Japan is projected at 3.5% during 2026 to 2036. Country analysis starts with Grade A Office Buildings and tests leasing channels by geography.
How does the Office Real Estate Market break down by segment?
Grade A Office Buildings are expected to lead Property Type at 31.2% share in 2026. Corporate Offices are projected to lead Application at 42.0% share in 2026.
Why do Grade A Office Buildings lead Property Type?
Grade A Office Buildings are projected to account for 37.4% share in 2026.
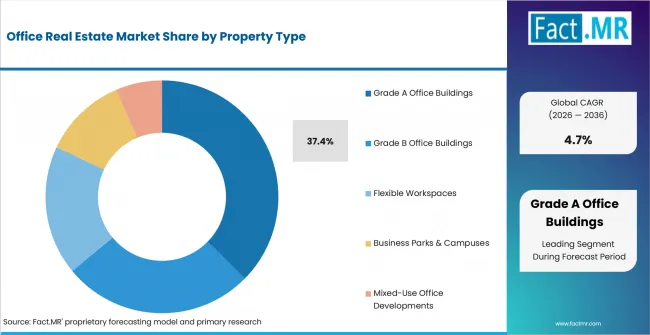
Office Real Estate Market Analysis By Property Type | Source: Fact.MR
Grade A offices lead when tenants value service performance and fit-out readiness. Central Business District Offices and Premium Business Parks remain relevant where location shapes employee access. Grade B Office Buildings retain demand when rent control has priority.
Why do Corporate Offices lead Application?
Corporate Offices are projected to account for 31.2% share in 2026.
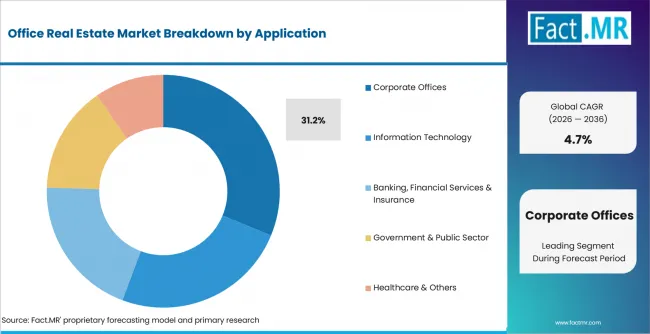
Office Real Estate Market Analysis By Application | Source: Fact.MR
Corporate Offices lead when employers need stable locations for management work and client interaction. Headquarters support brand identity. Regional Offices support local coverage. Information Technology offices retain demand where infrastructure guides the site decision.
Why do Large Enterprises lead End User?
Large Enterprises hold 32.8% share in 2026.
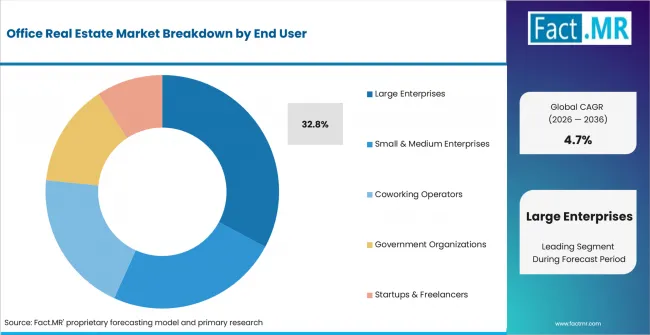
Office Real Estate Market Analysis By End User | Source: Fact.MR
Large Enterprises lead since office decisions pass through finance and facilities teams before approval. Multinational Corporations and Public Companies remain important where reporting discipline is high. Small and Medium Enterprises move faster but remain rent-sensitive.
Why does Direct Leasing lead Distribution Channel?
Direct Leasing lead with 30.0% share in 2026.
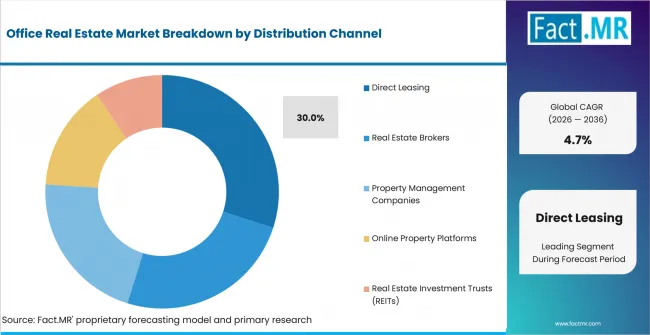
Office Real Estate Market Analysis By Distribution Channel | Source: Fact.MR
Direct Leasing leads when occupiers want clear owner discussions on fit-out work and renewal options. Corporate Leasing and Build-to-Suit Leasing support larger custom needs. Real Estate Brokers remain important for market comparison.
Why does Private Ownership lead Ownership Type?
Private Ownership accounts for 35.2% share in 2026.
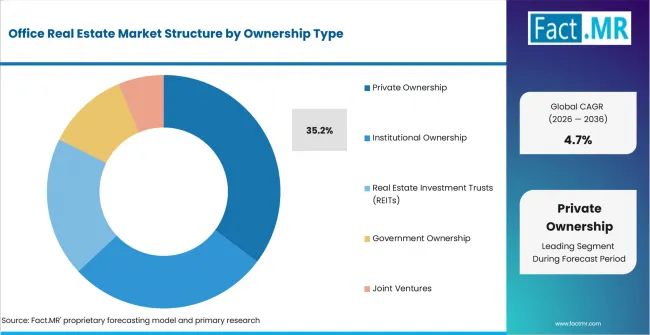
Office Real Estate Market Analysis By Ownership Type | Source: Fact.MR
Private Ownership leads since private owners can adjust tenant terms without long approval cycles. Family-Owned Properties and Private Investment Firms remain active in local portfolios. Institutional Ownership gains attention when transparency matters more than flexibility.
What is accelerating Office Real Estate Market adoption, and what is holding it back?
Demand is expected to rise as companies prefer Grade A buildings and renew office spaces. High vacancy levels and declining demand for older properties may slow growth.
Drivers Impact Analysis
| DRIVER | (~) % IMPACT ON CAGR | GEOGRAPHIC RELEVANCE | IMPACT TIMELINE |
|---|---|---|---|
| Grade A office preference | +4.7% | Germany, USA, UK | Short term (<= 2 years) |
| Corporate office renewal | +3.3% | Brazil, Australia | Short term (<= 2 years) |
| Enterprise portfolio governance | +3.7% | Germany, Canada, Japan | Medium term (2-4 years) |
| Direct leasing control | +5.2% | USA and major office districts | Medium term (2-4 years) |
Source: Fact.MR analysis. Updated Jul 31, 2026
- Grade A office preference: Tenants are expected to review buildings more carefully when location quality and service reliability affect daily operations.
- Corporate office renewal: Employers are anticipated to use lease events to resize space without leaving office planning unresolved.
- Enterprise portfolio governance: Large enterprises are expected to favor providers that document terms and operating duties across several locations.
Opportunity Impact Analysis
| OPPORTUNITY | (~) % IMPACT ON CAGR | GEOGRAPHIC RELEVANCE | IMPACT TIMELINE |
|---|---|---|---|
| Flexible office renewal programs | +4.7% | Germany and UK | Medium term (2-4 years) |
| Broker-advisory integration | +5.2% | USA and Brazil | Medium term (2-4 years) |
| Building operations improvement | +3.3% | Australia and Canada | Medium term (2-4 years) |
| Conversion feasibility screening | +4.2% | Japan and dense urban cores | Long term (>= 4 years) |
Source: Fact.MR analysis. Updated Jul 31, 2026
- Facility management support is expected to help owners defend rent when tenants compare maintenance quality with total occupancy cost.
- Integrated workplace management system use is expected to support demand when enterprises connect seating plans with portfolio reporting.
- Commercial HVAC equipment upgrades are expected to influence office repositioning when comfort and energy cost affect tenant decisions.
Restraints Impact Analysis
| RESTRAINT | (~) % IMPACT ON CAGR | GEOGRAPHIC RELEVANCE | IMPACT TIMELINE |
|---|---|---|---|
| Vacancy and refinancing pressure | -0.6% | High-cost office districts | Short term (<= 2 years) |
| Fit-out cost and energy burden | -3.7% | Germany, UK, Canada | Medium term (2-4 years) |
| Slow absorption in weaker assets | -0.4% | Secondary office locations | Medium term (2-4 years) |
| Lease decision uncertainty | -0.3% | Enterprise occupiers | Short term (<= 2 years) |
Source: Fact.MR analysis. Updated Jul 31, 2026
- Vacancy and refinancing pressure: Owners with weak occupancy are expected to face slower negotiations when tenants can choose better buildings nearby.
- Fit-out cost and energy burden: Higher improvement spending is anticipated to delay moves when tenants cannot recover the cost through productivity gains.
- Slow absorption in weaker assets: Older buildings are expected to lag when they lack transport access or credible repositioning plans.
Which countries are scaling Office Real Estate Market fastest?
The country comparison is defined by the spread between Germany and Japan. Germany forms the upper edge at 6.1% CAGR. Brazil and Australia stay near the global pace through service-led leasing demand.
- Germany leads the set because Grade A offices match tenant scrutiny around building quality and operating reliability. Brazil stays above the global figure where corporate office decisions depend on local leasing access and service support.
- Australia records a measured path as employers compare workplace quality with cost control and lease flexibility. The USA remains close to the global average because replacement demand is active but older assets still face absorption pressure.
- Canada and the UK remain steadier markets where renewal decisions depend on rent discipline and asset quality. Japan records the lowest CAGR in the group as conservative lease review and long planning cycles slow wider repositioning.
Comparable CAGRs can still create different entry conditions. Deployment timing depends on tenant approval and building quality. Service depth then decides capital spending.
The full report provides country-level CAGR analysis across North America and Latin America. Europe and East Asia form the next view. South Asia plus Oceania and the Middle East and Africa complete the view.
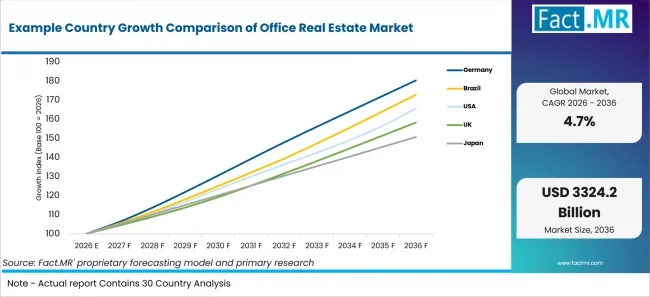
Example Country Growth Comparison Of Office Real Estate Market | Source: Fact.MR
| Country | CAGR (2026-2036) |
|---|---|
| Germany | 6.1% |
| Brazil | 5.6% |
| Australia | 3.3% |
| USA | 5.2% |
| Canada | 3.7% |
| UK | 4.7% |
| Japan | 4.2% |
Source: Fact.MR analysis. Updated Jul 31, 2026
What supports Germany adoption?
5.4% CAGR, supported by Grade A leasing discipline and institutional asset screening.
Germany reflects a market where tenants review building quality before longer commitments. Grade A Office Buildings receive attention when energy performance reduces uncertainty. Older buildings face slower approval when upgrades are not visible.
How is Brazil scaling demand?
4.9% CAGR, driven by corporate office renewal and local leasing support.
Brazil’s growth is tied to corporate office decisions in large business districts. Occupiers need leasing partners that explain building condition and renewal options. Demand is restrained when after-lease support differs between cities.
What is driving Australia’s growth from 2026 to 2036?
4.6% CAGR, backed by workplace renewal and portfolio right-sizing.
Australia is shaped by employers that reassess office footprints while protecting quality space. Grade A assets gain preference where transport access supports attendance. Fit-out costs remain the main barrier when tenants delay moves.
How is the USA developing demand?
4.5% CAGR, supported by large enterprise leasing and asset replacement.
The USA remains a deep office market because large companies require space for management and client access. Demand is expected to favor offices with clearer service quality. Weaker assets restrain growth when vacancy reduces owner flexibility.
What supports Canada adoption?
4.1% CAGR, supported by private ownership activity and renewal-led leasing.
Canada’s growth comes from cautious renewal decisions in established office districts. Private owners can protect demand with practical terms and visible upkeep. Rent sensitivity limits expansion where occupiers compare quality with tighter budgets.
How does the UK compare?
4.0% CAGR, supported by CBD leasing selectivity and professional services demand.
The UK market is expected to move through selective demand for better-positioned offices. Corporate occupiers value buildings that support clients and compliance work. Refurbishment costs restrain older properties before tenants commit.
What shapes Japan’s outlook?
3.5% CAGR, supported by long-term tenant retention and conservative lease planning.
Japan’s outlook reflects stable but cautious demand from established occupiers. Tenants often prefer careful review before relocation. This supports retention in proven buildings. Older layouts and slow decisions limit repositioning speed.
Who leads the Office Real Estate Market?
CBRE Group and JLL show broad service coverage through advisory and leasing. Brookfield Properties and BXP, Inc. add owner exposure. Tishman Speyer and Hines Interests Limited Partnership add operator depth.
Competition from 2026 to 2036 is expected to depend on building quality and leasing execution. Providers gain attention when they explain tenant retention through service depth.
Which companies are the key providers?
Key companies include CBRE Group; JLL (Jones Lang LaSalle); Brookfield Properties; BXP, Inc.; Tishman Speyer; and Hines Interests Limited Partnership.
- CBRE Group
- JLL (Jones Lang LaSalle)
- Brookfield Properties
- BXP, Inc.
- Tishman Speyer
- Hines Interests Limited Partnership
Bibliography
- European Commission. (2024, April 16). In focus: Energy efficient buildings—Delivering energy and cost savings for EU citizens.
- European Parliament, & Council of the European Union. (2024, May 8). Directive (EU) 2024/1275 on the energy performance of buildings.
- CBRE Group, Inc. (2024, March 27). CBRE arranges 17,421-square-foot office lease for CoreWeave at 33 Whitehall Street.
- BXP, Inc. (2025, January 28). BXP closes fourth quarter 2024 with more than 2.3 million square feet of leases.
This Report Answers
- The report provides strategic intelligence on the Office Real Estate Market across Property Type and Application choices that shape leasing demand.
- Segment analysis covers Grade A Office Buildings and Corporate Offices as the leading share categories within the 2026 market.
- Country outlook evaluates Germany and Brazil alongside Australia and the USA. Canada, the UK and Japan complete the growth comparison.
- Competitive analysis profiles CBRE Group and JLL alongside Brookfield Properties and BXP, Inc. Tishman Speyer and Hines Interests Limited Partnership complete the provider set.
- Distribution assessment covers Direct Leasing and Corporate Leasing. Build-to-Suit Leasing and Real Estate Brokers complete the channel view.
What does the Office Real Estate Market cover?
Office real estate covers workplace assets used by corporate occupiers and owners. Coverage includes Grade A Office Buildings and Central Business District Offices. It extends to adjacent markets such as digital workplace and medical office buildings when those categories influence office demand.
The market differs from broad property investment because value comes from lease review. Pure residential housing remains outside the boundary. Retail malls and industrial warehouses are excluded unless they affect office repositioning.
What is included in the scope?
Office buildings are included when they support corporate work and business services. Direct leasing and broker-supported transactions are included when they shape office occupancy decisions.
The scope includes Property Type and Application alongside End User, Distribution Channel and Ownership Type. Coverage spans Grade A Office Buildings and Corporate Offices. Ownership categories are included when they influence leasing.
What is excluded from the scope?
Pure residential assets and unrelated industrial space remain outside the scope of this market.
The scope excludes short-stay lodging and coworking-only revenue when no office lease structure is involved. Provider percentage estimates are excluded to avoid unsupported percentage claims.
How Was the Analysis Built?
The analysis draws on 120+ sources, 35+ company portfolios, 25+ countries, and more than 20 industry interviews.
- Primary Research: Primary research includes discussions with manufacturers, service providers, technology developers, distributors, end users, procurement teams, and subject-matter experts. These conversations examine purchasing priorities, product adoption, operational challenges, approval requirements, competitive positioning, and the factors that influence wider market acceptance.
- Desk Research: Desk research covers government statistics, regulatory publications, company filings, trade data, technical studies, industry associations, standards, public policy, and other authoritative sources. Every source used in the analysis is documented in the bibliography.
- Market Sizing and Forecasting: Market estimates combine historical performance, demand indicators, pricing and volume trends, segment shares, company participation, country-level growth, adoption patterns, investment activity, and barriers to market expansion.
- Data Validation and Update Cycle: Findings are validated by comparing primary interviews with public data, company activity, regulatory changes, trade patterns, and industry developments. Regular updates review new product launches, capacity changes, partnerships, approvals, procurement trends, and shifts in commercial adoption.
Segmentation
What is the report’s scope and coverage?
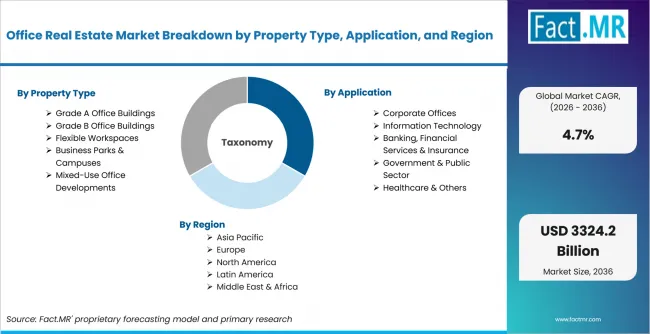
Office Real Estate Market Breakdown By Property Type, Application, And Region | Source: Fact.MR
| Attribute | Details |
|---|---|
| Quantitative Units | USD billion in 2026 to USD billion by 2036 at CAGR |
| Market Definition | Office assets and leasing structures used for workplace occupancy, corporate operations, direct leasing, property ownership and office portfolio planning |
| Property Type | Grade A Office Buildings; Central Business District Offices; Premium Business Parks; Grade B Office Buildings |
| Application | Corporate Offices; Headquarters; Regional Offices; Information Technology |
| End User | Large Enterprises; Multinational Corporations; Public Companies; Small and Medium Enterprises |
| Distribution Channel | Direct Leasing; Corporate Leasing; Build-to-Suit Leasing; Real Estate Brokers |
| Ownership Type | Private Ownership; Family-Owned Properties; Private Investment Firms; Institutional Ownership |
| Regions Covered | North America; Latin America; Europe; East Asia; South Asia and Pacific; Middle East and Africa; Oceania |
| Countries Covered | Germany; Brazil; Australia; USA; Canada; UK; Japan |
| Key Companies Profiled | CBRE Group; JLL (Jones Lang LaSalle); Brookfield Properties; BXP, Inc.; Tishman Speyer; Hines Interests Limited Partnership |
| Forecast Period | 2026 to 2036 |
| Approach | Hybrid top-down and bottom-up approach using office asset value, property-grade share, application demand, enterprise leasing behavior, distribution channel review, ownership structure, country adoption patterns and company participation review |
Source: Fact.MR analysis. Updated Jul 31, 2026
How is the market segmented?
-
By Property Type
- Grade A Office Buildings
- Central Business District Offices
- Premium Business Parks
- Grade B Office Buildings
- Suburban Office Buildings
- Mid-Tier Commercial Offices
- Flexible Workspaces
- Coworking Spaces
- Serviced Offices
- Business Parks & Campuses
- Corporate Campuses
- IT & Technology Parks
- Mixed-Use Office Developments
- Office-Retail Complexes
- Live-Work Developments
- Grade A Office Buildings
-
By Application
- Corporate Offices
- Headquarters
- Regional Offices
- Information Technology
- Software Companies
- IT Service Providers
- Banking, Financial Services & Insurance
- Banking Offices
- Insurance Offices
- Government & Public Sector
- Administrative Offices
- Public Agencies
- Healthcare & Others
- Healthcare Administration
- Professional Services
- Corporate Offices
-
By End User
- Large Enterprises
- Multinational Corporations
- Public Companies
- Small & Medium Enterprises
- Small Businesses
- Medium Enterprises
- Coworking Operators
- Flexible Workspace Providers
- Shared Office Providers
- Government Organizations
- Government Departments
- Public Institutions
- Startups & Freelancers
- Early-Stage Startups
- Independent Professionals
- Large Enterprises
-
By Distribution Channel
- Direct Leasing
- Corporate Leasing
- Build-to-Suit Leasing
- Real Estate Brokers
- Commercial Brokerage Firms
- Leasing Consultants
- Property Management Companies
- Facility Management Firms
- Asset Management Firms
- Online Property Platforms
- Digital Property Portals
- Virtual Leasing Platforms
- Real Estate Investment Trusts (REITs)
- Public REITs
- Private REITs
- Direct Leasing
-
By Ownership Type
- Private Ownership
- Family-Owned Properties
- Private Investment Firms
- Institutional Ownership
- Pension Funds
- Insurance Companies
- Real Estate Investment Trusts (REITs)
- Equity REITs
- Publicly Listed REITs
- Government Ownership
- Municipal Properties
- State-Owned Assets
- Joint Ventures
- Public-Private Partnerships
- Corporate Joint Ventures
- Private Ownership
-
By Region
- North America
- Latin America
- Europe
- East Asia
- South Asia & Oceania
- Middle East & Africa
Frequently Asked Questions
Which Property Type leads the market?
Which Application leads the market?
Which End User leads the market?
Which Distribution Channel leads the market?
Which Ownership Type leads the market?
Which country records the highest listed CAGR?
What is the primary driver in this market?
What is the main restraint?
Who worked on this report


Preview the report firsthand - request a free sample
Free SampleGet the brochure for pricing and purchase details
Download PDF