- Market Value (2025): USD 11.3 Bn
- Estimated Value (2026): USD 11.9 Bn
- Forecast Value (2036): USD 19.9 Bn
- CAGR (2026-2036): 5.3%
What is the Oxygenated Solvents Market forecast to be worth by 2036?
USD 11.9 billion in 2026 to USD 20.0 billion by 2036 at a 5.3% CAGR.
- Fact.MR estimates the oxygenated solvents market at USD 11.3 billion for 2025, with paint and coating lines taking the leading slice of solvent volume.
- Revenue will expand from USD 11.9 billion in 2026 to USD 19.9 billion by 2036 as coatings, pharmaceutical and electronics producers add capacity that runs on alcohol, ether and ketone grades.
- A 5.3% CAGR reflects a mature chemical category in which steady volume gains combine with a move toward higher purity and lower-carbon grades that sell at a premium.
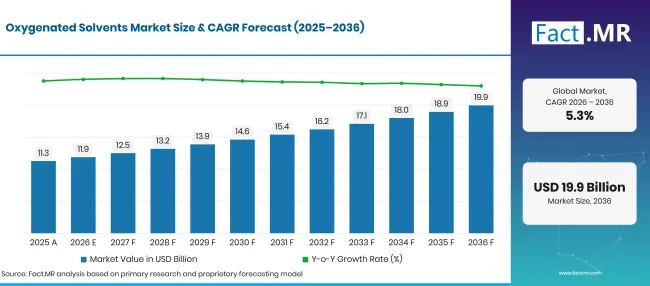
Oxygenated Solvents Market Forecast Global | Source: Fact.MR
| Year | Basis | Market Value (USD billion) |
|---|---|---|
| 2025 | Actual | 11.3 |
| 2026 | Estimate | 11.9 |
| 2036 | Forecast | 19.9 |
| CAGR 2026 to 2036 | Forecast period | 5.3% |
Source: Fact.MR analysis. Updated Nov 3, 2026
What are the defining numbers behind Oxygenated Solvents Market growth?
The 2026 to 2036 period will add USD 8.1 billion in new value, led by coating formulators and high-purity pharmaceutical users.
- Demand Drivers in the Market
- Europe still runs a broad chemical base that buys solvents both as raw materials and as process aids. Eurostat reported that EU sold production of chemicals reached EUR 836 billion in 2025, while exports came to EUR 605 billion [1]. Every one of those plants needs cleaning, extraction and formulation solvents.
- Global chemical output kept growing in 2025 even as some Western producers cut back. BASF calculated that world chemical production rose 3.6% in real terms during 2025 [2]. Growth outside Europe pulls solvent demand toward Asian and American coatings and resin plants.
- Building work in North America absorbs large volumes of architectural paint, sealants and adhesives. The U.S. Census Bureau put 2025 construction spending at USD 2,164.4 billion, 1.4% below the 2024 total [3]. Even a flat building year keeps repaint and maintenance demand for solvent grades in place.
- Pharmaceutical and electronics producers are tightening specifications on residual water, metals and particles. This shift moves buyers toward distilled, high-purity alcohol and ketone grades that carry a higher price per tonne.
- Coating chemists are reformulating to meet volatile organic compound limits. Many of the new systems still use small amounts of glycol ethers or alcohols as coalescents and co-solvents, so the change alters the grade mix while keeping these products in the formula.
- Key Segments Analyzed
- By Product Type: Alcohols will hold 28.4% share in 2026 since ethanol, isopropanol and butanols serve as solvent, carrier and raw material across almost every downstream industry.
- By Application: Paints and Coatings will account for 38.2% of 2026 demand, as formulators rely on solvent blends to control viscosity, flow and drying time.
- By End-User Industry: Automotive will take 22.4% in 2026, reflecting the solvent load of primers, basecoats, clearcoats and refinish work on cars and trucks.
- Analyst Opinion at Fact.MR
- Shambhu Nath Jha, Principal Consultant at Fact.MR, states, “Formulators will keep buying oxygenated solvents because no single water-based route yet matches their control over evaporation and film formation. The next decade will reward suppliers that can certify purity lot by lot and offer bio-attributed or recycled-carbon versions of the same molecule. Price swings in propylene, ethylene and natural gas will remain the main risk to margins, so integrated producers will hold an edge over toll blenders.”
- Strategic Implications
- Producers should publish evaporation, purity and residual-water data for each grade and back it with lot certificates that pharmaceutical and electronics auditors accept.
- Distributors should hold regional stocks of high-purity and certified bio-attributed grades, because these buyers order smaller lots more often.
- Coating formulators should test glycol ether and alcohol co-solvent levels against tightening VOC limits before reformulating whole product lines.
- Investors should weigh feedstock integration, since producers with their own propylene and ethylene streams can absorb raw material swings better than merchant blenders.
Germany heads the country set at 6.0%, as its paint, automotive and export chemical base rebuilds from a weak 2025. Brazil follows at 5.5%, where large ethanol output gives formulators a local alcohol supply. The United States records 4.9%, a pace tied to steady coatings work and a large, integrated feedstock position that already serves most demand. The United Kingdom reaches 4.4%, held back by soft chemical output but supported by a growing vehicle fleet. Japan trails at 3.9%, since its electronics and automotive plants already hold ample stock and buy mainly for replacement and upgrades in purity.
How does the Oxygenated Solvents Market break down by segment?
Alcohols will lead Product Type at 28.4%; Paints and Coatings will head Application at 38.2%; Automotive will hold End-User Industry at 22.4% in 2026.
Which Product Type leads?
Alcohols take 28.4% of 2026 sales.
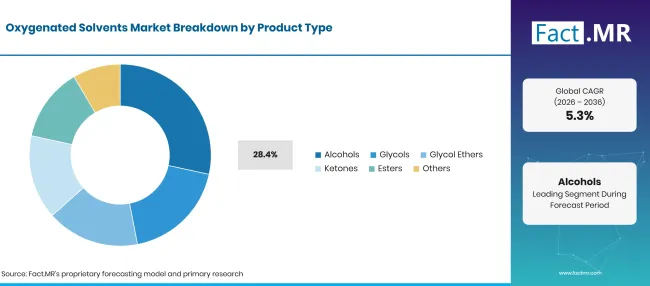
Oxygenated Solvents Market Breakdown Product Type | Source: Fact.MR
| Product Type | Share (2026) |
|---|---|
| Alcohols (Leading segment) | 28.4% |
| Other segments combined | 71.6%* |
| Total | 100.0% |
Source: Fact.MR analysis. Updated Nov 3, 2026
Ethanol, isopropanol and the butanols are cheap to make, easy to recover and compatible with most resins. Coating plants use butanol to thin and level films, while drug makers use ethanol and isopropanol for extraction, crystallisation and cleaning. Printers add alcohols to flexographic and gravure systems for fast drying, a pattern also seen across the printing ink sector. Alcohols also serve as feedstock for esters and glycol ethers, which keeps volumes high. Glycols and glycol ethers handle coalescing, coupling and slow evaporation in water-borne paints and cleaners. Ketones such as acetone and methyl ethyl ketone dissolve tough resins quickly, as tracked in the ketone based solvents study. Esters bring mild odour and good solvency for inks and nail care, and others include carbonates and specialty oxygenates.
What supports Paints and Coatings within Application?
Paints and Coatings account for 38.2% of 2026 revenue.
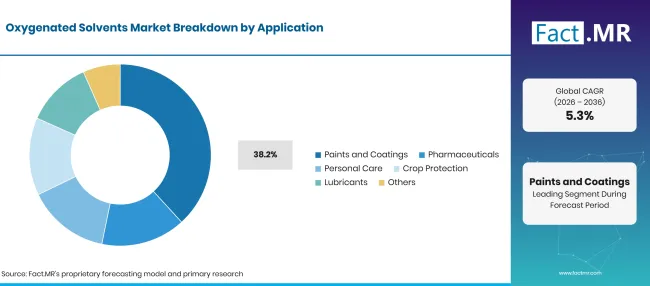
Oxygenated Solvents Market Breakdown Application | Source: Fact.MR
| Application | Share (2026) |
|---|---|
| Paints and Coatings (Leading segment) | 38.2% |
| Other segments combined | 61.8%* |
| Total | 100.0% |
Source: Fact.MR analysis. Updated Nov 3, 2026
Every can of solvent-borne paint holds a blend chosen to balance flow, sag resistance and drying speed. Even water-borne systems need a few percent of glycol ether or alcohol to help particles fuse into a film. Furniture and joinery finishes depend on fast-evaporating ketone and ester blends, a link visible in wood coatings demand. Repaint cycles keep this demand steady. Pharmaceutical producers buy ethanol, isopropanol and acetone in compendial grades for synthesis and purification. Personal care makers use alcohols and glycols in fragrances, sprays and skin products. Crop protection formulators need solvents that keep active ingredients stable, and lubricant blenders use glycols and ethers as base fluids and additives. Others include cleaners, inks and adhesives.
How does End-User Industry shape demand?
Automotive represents 22.4% of 2026 value.
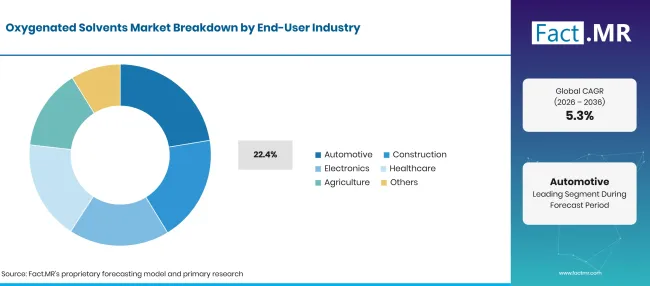
Oxygenated Solvents Market Breakdown End User Industry | Source: Fact.MR
| End-User Industry | Share (2026) |
|---|---|
| Automotive (Leading segment) | 22.4% |
| Other segments combined | 77.6%* |
| Total | 100.0% |
Source: Fact.MR analysis. Updated Nov 3, 2026
Car plants run multi-layer paint shops where each coat carries its own solvent package, and body shops repeat the process during repairs. The United Kingdom alone registered 2,617,000 vehicles for the first time in 2025 [4]. Each of these vehicles carries several litres of cured coating, and the automotive coatings supply chain buys the solvent behind it. Construction uses solvents in architectural paints, sealants and floor coatings. Electronics makers need ultra-clean isopropanol and ketones for wafer and board cleaning. Healthcare covers drug manufacture and disinfectants, while agriculture relies on solvent-based crop protection concentrates. Others include printing, textiles and household products.
What is accelerating Oxygenated Solvents Market adoption, and what is holding it back?
Growth in global chemical output, steady coatings demand and stricter purity needs in drug and chip plants keep buying firm. Lower-carbon and bio-attributed grades are opening new contracts. Volatile propylene and energy prices, tighter emission limits on solvent-borne paint and the slow shift to water-based and powder systems cap how fast volumes can grow.
Drivers Impact Analysis
| DRIVER | (~) % IMPACT ON CAGR | GEOGRAPHIC RELEVANCE | IMPACT TIMELINE |
|---|---|---|---|
| Coatings production for building, vehicles and industry | +0.9% | Global | Medium term (2-4 years) |
| Pharmaceutical processing and purification needs | +0.7% | North America, Western Europe, East Asia | Medium term (2-4 years) |
| Demand for high-purity grades in electronics | +0.6% | East Asia, North America | Short term (<=2 years) |
| Expanding chemical output outside Europe | +0.5% | East Asia, South Asia & Pacific, Latin America | Long term (>=4 years) |
Source: Fact.MR analysis. Updated Nov 3, 2026
Opportunity Impact Analysis
| OPPORTUNITY | (~) % IMPACT ON CAGR | GEOGRAPHIC RELEVANCE | IMPACT TIMELINE |
|---|---|---|---|
| Low-VOC co-solvents for water-borne paints | +0.8% | Western Europe, North America | Medium term (2-4 years) |
| Bio-attributed and recycled-carbon solvent grades | +0.6% | Western Europe, North America, East Asia | Long term (>=4 years) |
| Sugarcane and corn ethanol as solvent feedstock | +0.4% | Latin America, North America | Medium term (2-4 years) |
| Custom solvent blends for coating formulators | +0.3% | Global | Short term (<=2 years) |
Source: Fact.MR analysis. Updated Nov 3, 2026
Restraints Impact Analysis
| RESTRAINT | (~) % IMPACT ON CAGR | GEOGRAPHIC RELEVANCE | IMPACT TIMELINE |
|---|---|---|---|
| Feedstock and energy price swings | -0.8% | Global | Short term (<=2 years) |
| VOC limits and chemical safety rules | -0.6% | Western Europe, North America | Medium term (2-4 years) |
| Substitution by water-based and powder systems | -0.5% | Global | Medium term (2-4 years) |
| Flammability, storage and transport costs | -0.3% | Global | Short term (<=2 years) |
Source: Fact.MR analysis. Updated Nov 3, 2026
Which countries are scaling the Oxygenated Solvents Market through 2036?
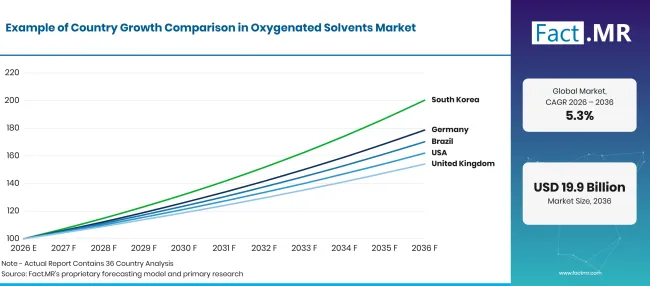
Oxygenated Solvents Market Growth Index | Source: Fact.MR
| Country | CAGR (2026 to 2036) |
|---|---|
| Germany | 6.0% |
| Brazil | 5.5% |
| United States | 4.9% |
| United Kingdom | 4.4% |
| Japan | 3.9% |
Source: Fact.MR analysis. Updated Nov 3, 2026
What supports oxygenated solvent adoption in Germany?
6.0% CAGR, backed by a deep export chemical base and paint industry.
German plants sell more chemicals outside the EU than any other member state, with EUR 130 billion of extra-EU exports in 2025 [1]. That base still had a hard year. Destatis reported that output in energy-intensive industries, which include chemicals, fell 2.6% in 2025 and stood 17.8% below 2021 [5]. Recovery from this low point, together with demand from car paint shops and industrial coaters, gives Germany room for the quickest gains in the country set.
How is Brazil developing demand?
5.5% CAGR, helped by abundant domestic ethanol.
Brazilian industry grew for a third straight year, with IBGE data showing a 0.6% rise in 2025 [6]. Conab estimated total ethanol output in the 2025/26 season at about 37.5 billion litres, with corn ethanol up about 29.8% on the prior season [7]. This large alcohol pool gives paint, cosmetics and crop protection makers a local solvent supply. Exposure to imported ketones and glycol ethers still links part of the market to currency swings.
What is supporting United States adoption?
4.9% CAGR, reflecting integrated feedstock and steady coatings work.
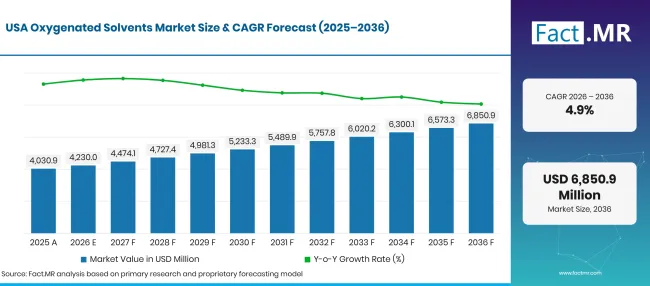
Oxygenated Solvents Market Forecast Usa | Source: Fact.MR
BASF reported that US chemical production rose 1.3% in 2025 [2]. Shale gas and corn give American producers cheap ethylene, propylene and ethanol, and much of that capacity already serves domestic paint and drug plants. Ethanol exports averaged 138,000 barrels per day from January to July 2025, 9% above the 2024 annual record [8]. Spare alcohol supply keeps local solvent prices competitive, while the mature user base limits the pace of new demand.
How is the United Kingdom building demand?
4.4% CAGR, as a growing vehicle fleet offsets weak chemical output.
The Office for National Statistics recorded a 0.2% rise in UK production output in 2025, the first annual gain since 2021, though chemical products fell 5.0% in December alone [9]. Downstream users carry more of the load. Britain had 42.3 million licensed vehicles at the end of 2025 [4], and body shops servicing that fleet buy refinish thinners and cleaners every week. Pharmaceutical and personal care plants add steady orders for high-purity alcohols.
What supports Japan’s adoption?
3.9% CAGR, owing to purity-driven electronics and automotive demand.
METI reported that Japan’s original industrial production index reached 106.8 in December 2025, 2.6% higher than a year earlier [10]. Even so, BASF estimated that Japanese chemical production slipped 0.8% across 2025 [2]. Semiconductor and display plants buy ultra-clean isopropanol and ketones for wafer and panel cleaning, which keeps unit value high. Most coating and automotive lines already have dependable sources, so growth comes mainly from purity upgrades.
Who leads the Oxygenated Solvents Market?
Competition splits into two tiers. Integrated majors such as BASF, Dow, Shell, ExxonMobil and LyondellBasell make solvents next to their own crackers and oxide units. They compete on cost, scale and secure supply.
They also set list prices that smaller sellers follow. BASF raised North American prices for n-butanol, isobutanol and 2-ethylhexanol from February 1, 2026 [11]. Dow certified its propylene glycol plant in Map Ta Phut, Thailand, under ISCC PLUS in March 2025 and now offers recycled and bio-circular grades in Asia Pacific [12]. The second tier covers Eastman, Arkema and Sasol, which focus on specialty molecules. Eastman sells alcohols, esters, glycol ethers and ketones. Arkema makes diacetone alcohol, hexylene glycol and isophorone. Sasol produces ketones at plants in South Africa and Germany. These firms win on technical service, regulatory files and grades tuned to one application. Over the next ten years, low-carbon certification and lot-level purity data will separate suppliers more than price alone.
Which companies are the key providers?
Key companies include BASF; Dow; Eastman; Shell; ExxonMobil; LyondellBasell; Arkema; and Sasol.
- BASF
- Dow
- Eastman
- Shell
- ExxonMobil
- LyondellBasell
- Arkema
- Sasol
Bibliography
- [1] Eurostat. (2026, October 15). EU chemicals trade surplus at €257 billion in 2025.
- [2] BASF SE. (2026, February 27). Chemical Industry: BASF Report 2025.
- [3] U.S. Census Bureau. (2026, February 27). Monthly Construction Spending, December 2025.
- [4] Department for Transport. (2026, April 29). Vehicle licensing statistics, United Kingdom: 2025.
- [5] Statistisches Bundesamt (Destatis). (2026, February 6). Production in December 2025: -1.9% on the previous month.
- [6] Agência Gov, Government of Brazil. (2026, February 3). IBGE: indústria fecha 2025 com alta de 0,6% e tem terceiro ano seguido de crescimento.
- [7] Companhia Nacional de Abastecimento (Conab). (2026, April). Acompanhamento da safra brasileira de cana-de-açúcar: 4º levantamento, safra 2025/26.
- [8] U.S. Energy Information Administration. (2025, October 22). U.S. fuel ethanol exports on track to set record, driving more domestic production.
- [9] Office for National Statistics. (2026, February 12). Index of Production, UK: December 2025.
- [10] Ministry of Economy, Trade and Industry. (2026, February 16). Indices of Industrial Production (Revised Report for December 2025).
- [11] BASF Corporation. (2026, January 13). BASF announces price increase for Oxo-C4 Alcohols and Acrylic Monomers.
- [12] Dow. (2025, March 17). Dow expands circular and bio-circular Propylene Glycol offering with ISCC PLUS certification for Map Ta Phut, Thailand facility.
This Report Answers
- What oxygenated solvents earn in 2025 and 2026, and how far revenue will grow by 2036.
- Why alcohols, coating uses and automotive buyers carry the leading positions in each segment.
- How chemical output, ethanol supply and vehicle fleets shape demand in five countries.
- Where feedstock prices, VOC rules and water-based systems hold volume growth down.
- Which integrated majors and specialty producers compete for formulator contracts.
- What producers, distributors and coating formulators can do to protect margins and secure supply.
What does the Oxygenated Solvents Market cover?
This study values organic solvents that contain oxygen in their molecular structure. The group spans alcohols, glycols, glycol ethers, ketones and esters. Each is chosen for its solvency and evaporation rate as well as its fit with resins and actives.
Revenue is counted at producer selling price for merchant and captive-to-market sales. It covers grades sold to paint, pharmaceutical, personal care, agrochemical, lubricant and other formulators across all seven regions.
What is included in the scope?
Technical, industrial, pharmaceutical and electronic grades of alcohols, glycols, glycol ethers, ketones and esters.
Solvents used in coatings, inks and adhesives, including co-solvents and coalescents in water-borne paints.
Process and cleaning solvents for drug plants, chip fabs and industrial cleaning chemicals producers.
Bio-based, bio-attributed and recycled-carbon versions of the same oxygenated molecules.
What is excluded from the scope?
Hydrocarbon solvents such as aliphatics and aromatics that contain no oxygen-bearing groups.
Finished paints, drugs, cosmetics and crop protection products in which the solvent is only one ingredient.
Fuel ethanol and other oxygenates blended into gasoline, along with ready-mixed metal cleaning chemicals sold as branded products.
Inorganic solvents, solvent recovery services and spraying equipment.
How Was the Analysis Built?
The analysis draws on 120+ sources, 35+ company portfolios, 25+ countries, and more than 20 industry interviews.
- Primary Research: Primary research includes discussions with manufacturers, service providers, technology developers, distributors, end users, and subject-matter experts. These conversations examine purchasing priorities, product adoption, operational challenges, approval requirements, competitive positioning, and the factors that influence wider market acceptance.
- Desk Research: Desk research covers government statistics, regulatory publications, company filings, trade data, technical studies, industry associations, standards, public policy, and other authoritative sources. Every source used in the analysis is documented in the bibliography.
- Market Sizing and Forecasting: Market estimates combine historical performance, demand indicators, pricing and volume trends, segment shares, company participation, country-level growth, adoption patterns, investment activity, and barriers to market expansion.
- Data Validation and Update Cycle: Findings are validated by comparing primary interviews with public data, company activity, regulatory changes, trade patterns, and industry developments. Regular updates review new product launches, capacity changes, partnerships, approvals, and shifts in commercial adoption.
Segmentation
What is the report’s scope and coverage?
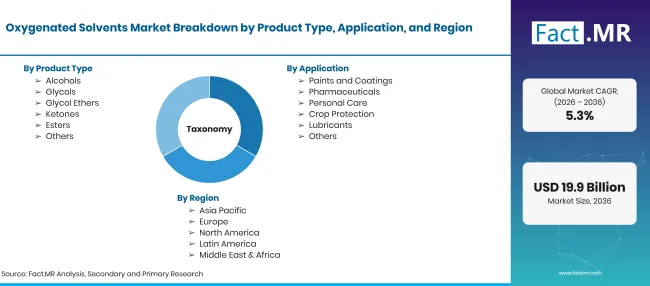
Oxygenated Solvents Market Taxonomy | Source: Fact.MR
| Attribute | Details |
|---|---|
| Quantitative Units | USD billion in 2026 to USD billion by 2036 at CAGR |
| Market Definition | Organic solvents with oxygen-bearing functional groups, including alcohols, glycols, glycol ethers, ketones and esters, sold for industrial processing and formulation. |
| Product Type | Alcohols; Glycols; Glycol Ethers; Ketones; Esters; Others |
| Application | Paints and Coatings; Pharmaceuticals; Personal Care; Crop Protection; Lubricants; Others |
| End-User Industry | Automotive; Construction; Electronics; Healthcare; Agriculture; Others |
| Regions Covered | North America; Latin America; Western Europe; Eastern Europe; East Asia; South Asia & Pacific; Middle East & Africa |
| Countries Covered | Germany; Brazil; United States; United Kingdom; Japan |
| Companies Profiled | BASF; Dow; Eastman; Shell; ExxonMobil; LyondellBasell; Arkema; Sasol |
| Forecast Period | 2026 to 2036 |
| Approach | Solvent volumes by grade and end use, valued at producer prices and checked against coatings, pharmaceutical and chemical output data. |
Source: Fact.MR analysis. Updated Nov 3, 2026
How is the market segmented?
-
By Product Type
- Alcohols
- Glycols
- Glycol Ethers
- Ketones
- Esters
- Others
-
By Application
- Paints and Coatings
- Pharmaceuticals
- Personal Care
- Crop Protection
- Lubricants
- Others
-
By End-User Industry
- Automotive
- Construction
- Electronics
- Healthcare
- Agriculture
- Others
-
By Region
- North America
- Latin America
- Western Europe
- Eastern Europe
- East Asia
- South Asia & Pacific
- Middle East & Africa
Frequently Asked Questions
How large is the oxygenated solvents market in 2026?
What growth rate will the oxygenated solvents market record?
Which product type leads?
Which application leads?
Which end-user industry leads?
Which country will grow quickest?
Who are the main companies?
What holds the market back?
Who worked on this report


Preview the report firsthand - request a free sample
Free SampleGet the brochure for pricing and purchase details
Download PDF