Primary Human Hepatocytes Market

Primary Human Hepatocytes Market Analysis, By Product Type, By Source, By Application, By End User, and Region - Market Insights 2025 to 2035

The Commercial Donor-Derived segment is projected to grow at a CAGR of 4.2%, whereas another segment Cadaveric Donor-Derived is likely to grow at 5.1%. In terms of countries Germany is projected to grow at 7.1%, followed by Japan at 5.8% and U.S. to grow at 6%.

Primary Human Hepatocytes Market Outlook (2025 to 2035)

The global primary human hepatocytes market is expected to reach USD 315.7 million by 2035, up from USD 162.9 million in 2024. During the forecast period from 2025 to 2035, the industry is projected to register a CAGR of 6.2%.

The primary human hepatocytes market is growing due to their essential role in drug metabolism studies, driven by an increasing demand for predictive in vitro models. Advances in cryopreservation, a growing emphasis on personalized medicine, and the broadening scope of liver disease research further propel market expansion. 

Quick Stats for Primary Human Hepatocytes Market

  • Industry Value (2025): USD 173 Million
  • Projected Value (2035): USD 316 Million
  • Forecast CAGR (2025 to 2035): 6.2%
  • Leading Segment (2025): Commercial Donor-Derived (41% Market Share)
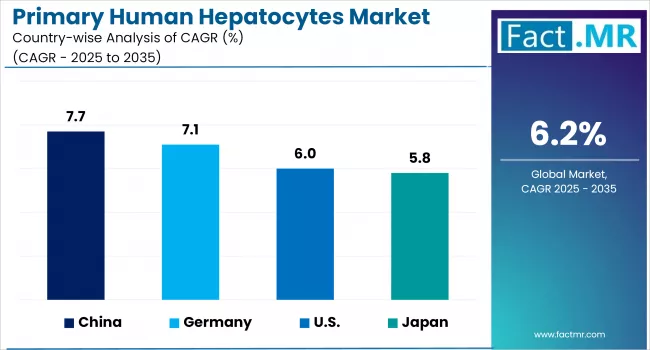
  • Country Growth Rate (2025 to 2035): China (7.7% CAGR)
  • Top Key Players: ATCC, Thermo Fisher Scientific (Gibco), ScienCell Research Laboratories, Preci, LifeNet Health LifeSciences, iXCells Biotechnologies, Axol Bioscience, Primacyt, Fujifilm Cellular Dynamics, In Vitro ADMET Laboratories (IVAL), and BeCytes Biotechnologies

Primary Human Hepatocytes Market Value (USD Million) 2025 To 2035

What are the drivers of primary human hepatocytes market?

The primary human liver market is dominated by the growing need for physiologically relevant models in drug discovery, development and testing. These cells sufficiently replicate liver functions in vivo, a property that makes them significant in ADME and DMPK studies.  

Increased regulatory pressure to enhance the safety of drugs, as well as limit animal testing, is accelerating their use in preclinical screening applications. Innovation in cryopreservation has improved cell culturing viability and availability, supporting the scalability of this technology in the pharmaceutical and biotech industries.  

The demand for hepatocytes from genetically diverse donors is also increasing with the progress of personalized medicine. They are widely used in 3D liver models, bio-artificial liver devices, and regenerative medicine, offering a breakthrough for pharmaceutical companies, academic institutions, contract research organizations, and solution providers in the field.  

What are the regional trends of primary human hepatocytes market?

North America, with the U.S. as its primary contributor, leads the market. This country has a well-established clinical research industry that requires the utilization of hepatocytes in drug screening. Key pharmaceutical companies and CROs, as well as academic laboratories, particularly in liver disease trials and metabolic studies, drive demand.  

Europe has continued to play an important role with countries such as Germany and the UK investing in human-relevant in vitro models. Hepatocyte-based assays are also preferred in the region, considering its desire to minimize animal testing. 

Technology-driven adoption is leading in the Asia Pacific, driven by Japan and South Korea, supported by advanced technologies. Meanwhile, the expanding biopharma sector in China offers significant growth potential. Life sciences and alternative testing methods are receiving government funding in these countries.  

Latin America and the Middle East are gradually entering the hepatocytes research space through partnerships with international pharmaceutical and contract research organizations, involving imported solutions and cross-border expertise.

What are the challenges and restraining factors of primary human hepatocytes market?

One of the key setbacks in the primary human hepatocytes market is the limited availability of high-quality donor liver tissues. This often leads to cyclical variability, which influences the reproducibility of experiments involved in drug testing and toxicology. 

Cryopreserved hepatocytes address supply issues; however, they may exhibit diminished viability or function, and are therefore limited in certain applications. The procurement, processing, and storage contribute to limited accessibility for smaller research initiatives.

Hepatocyte viability is a complex process that requires sophisticated infrastructural support and expertise, particularly in the in vitro maintenance of hepatocytes. Further, the market faces challenges from competing iPSC-derived hepatocytes and immortalized cell lines that are scalable and cost-effective. 

Country-Wise Outlook

Precision Nutrition and Biotech Synergy Drive U.S. Leadership

Primary Human Hepatocytes Market By Country

The primary human hepatocytes market is led by the United States, driven by pharmaceutical development, toxicology screening requirements, and the growth of biobanking infrastructure. The increased incidence of liver diseases, especially NASH and some cases of hepatitis C, supports the use of hepatocyte models to test new drugs at early stages of their development, as well as to perform metabolic investigations.

US Primary Human Hepatocytes Market Value (USD Million) 2025 To 2035

Federal funding sources, such as the NIH, and collaborations with commercial liver tissue banks ensure a wide phenotypic representation of liver tissue in in vitro modeling. The implementation of cryopreserved hepatocytes, liver spheroids, and high-throughput platforms for ADME-Tox testing reflects the progressive pace of biotechnology in the country.

Germany Champions Toxicology Reform through Cell Innovation

Germany is a leader in the European hepatocyte market, supported by a well-established toxicology framework and a requirement to evaluate safety without the use of animals. The REACH regulatory system continues to drive the demand for human-based liver models in drug, cosmetic, and chemical screening.

Challenges in the rapid development of enzyme-induction assays, liver-on-chip systems, and long-term hepatocyte cultures can be addressed through academic-industry synergy. Germany has a robust research infrastructure that is beneficial for innovations in transporter interaction studies and the profiling of phase I/II metabolism. This cell-based transformation, along with toxico-genomics and regulatory workflow, is being strengthened by supportive EU funding and the need for a CRO.

Japan Blends Regenerative Research with Hepatocyte Scale-Up

Japan has been accelerating its contributions to the hepatocyte market, with regenerative medicine being the primary driver and a strong promotion of biotech startups and stem cell initiatives. The increasing demand for scaffold-free 3D cultures, perfusion bioreactors, and disease-specific hepatocyte panels is redefining the path of ADME and virology research.

The stringent Japanese focus on predictive human models for antiviral and metabolic applications, in particular, enhances the relevance of cryopreserved and fresh hepatocytes. Access and innovation are being supported by public-private ecosystems in clinical and preclinical organizations.

Category-Wise Analysis

Cryopreserved Hepatocytes Enable Scalable, On-Demand Liver Cell Research

Primary Human Hepatocytes Market By Product Type

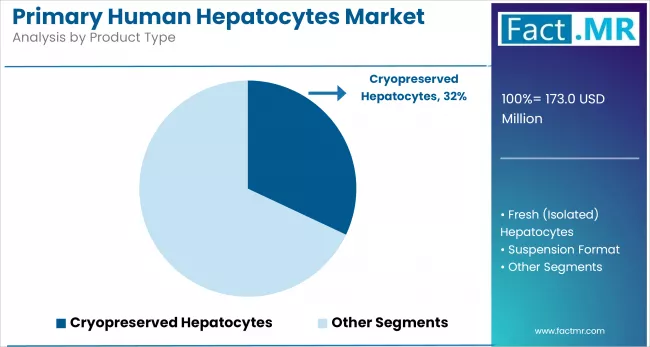
Cryopreserved hepatocytes provide a reliable and viable source of liver cells to use in the in vitro studies. These hepatic cells are rapidly frozen and stored at ultra-low temperatures to preserve their metabolic functions and activities for future applications.

They are valuable because they can be thawed and immediately used without the necessity of fresh donor tissue, supporting high-throughput screening, long-term experiments, and consistency between batches in studies of drug metabolism and toxicology. Cryopreservation enables international delivery and bio-banking, significantly enhancing accessibility to pharmaceutical and academic research facilities abroad.

Commercial Donor-Derived Sources Drive Quality and Standardization

Primary Human Hepatocytes Market By Source

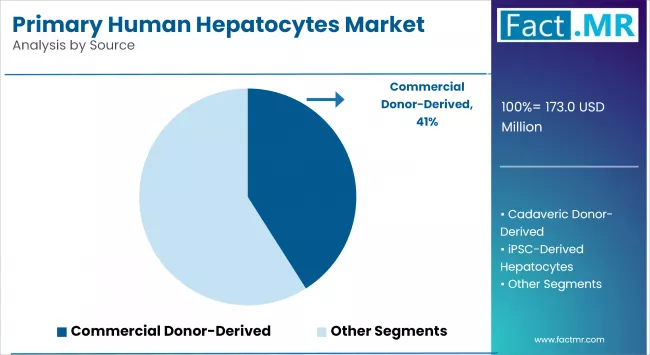
Human donor-derived hepatocytes are obtained through ethically consented patients and handled by an authorized supplier of tissue and cell division who is certified under the law. This source ensures the standardization, regulatory compliance, and scalability necessary for pharmaceutical research, development, and regulatory submissions.

The cells are thoroughly evaluated for viability, enzyme expression, and purity, allowing their use in FDA/EMA-compliant studies. Resource dependence on commercial sources enables research institutions to bypass the logistics and ethical concerns associated with establishing direct access to primary tissues, thereby speeding up preclinical development and safety testing schedules.

Drug Metabolism & Toxicity Testing Anchor Regulatory and Preclinical Workflows

Primary human hepatocytes are considered the gold standard for assessing drug metabolism, enzyme induction, and hepatotoxicity at the early stages of drug development. With their employment, physiologically relevant cytochrome P450 activation and phase I/II metabolism, as well as transporter interactions, can be assessed.

Such findings are essential for estimating human pharmacokinetics and drug-drug interactions as well as eliminating liver-related adverse consequences prior to clinical testing. With increased emphasis on human-relevant data by regulatory agencies, the role of hepatocyte-based assays in compound risk evaluation and preclinical safety assessment of new chemical entities is clearly established.

Competitive Analysis

Intense differentiation strategies characterize the primary human hepatocytes market as companies prioritize functional quality over scale. Innovations focus on increasing hepatocyte viability post-thaw and extending the timelines of metabolic activity, which are crucial for toxicology and drug metabolism studies.

Vendors compete by enhancing cryopreservation methods and optimizing isolation techniques to ensure high purity and consistent cell functionality.

Strategic collaborations with academic institutions and biotech research firms are shaping competitive momentum. These alliances allow for custom applications in disease modeling, especially for non-alcoholic fatty liver disease (NAFLD) and hepatitis. Licensing proprietary protocols and exclusive distribution networks further intensify the competition.

Regulatory compliance, particularly with FDA and EMA standards, acts as a competitive filter. Only suppliers that maintain stringent quality assurance for primary cells gain sustained access to preclinical and clinical research markets.

Key players in the primary human hepatocytes industry include ATCC, Thermo Fisher Scientific (Gibco), ScienCell Research Laboratories, Preci, LifeNet Health LifeSciences, iXCells Biotechnologies, Axol Bioscience, Primacyt, Fujifilm Cellular Dynamics, In Vitro ADMET Laboratories (IVAL), BeCytes Biotechnologies, and other notable companies.

Recent Development

  • In June 2025, RenJi Hospital (China) launched a Phase I trial administering microencapsulated proliferating human hepatocytes (derived from PHHs) intraperitoneally to adult patients with liver failure, with safety as the primary endpoint.
  • In March 2025, ATCC introduced HepatoXcell™, a high‑quality cryopreserved PHH product for liver disease research, drug metabolism, and toxicology, along with detailed protocols for isolation and culture.

Fact.MR has provided detailed information about the price points of key manufacturers of the Primary Human Hepatocytes Market positioned across regions, sales growth, production capacity, and speculative technological expansion, in the recently published report.

Segmentation of Primary human hepatocytes market

  • By Product Type :

  • Cryopreserved Hepatocytes
  • Fresh (Isolated) Hepatocytes
  • Suspension Format
  • Plateable Hepatocytes
  • 3D Spheroid/Co-culture
  • By Source :

    • Commercial Donor-Derived
    • Cadaveric Donor-Derived
    • iPSC-Derived Hepatocytes
  • By Application :

    • Drug Metabolism & Toxicity Testing
    • Disease Modeling
    • Regenerative Medicine & Transplantation
    • Viral Hepatitis Research
    • Gene Therapy & Enzyme Induction Studies
  • By End User :

    • Pharmaceutical & Biotech Companies
    • Contract Research Organizations (CROs)
    • Academic & Research Institutes
    • Hospitals & Clinical Settings
  • By Region :

    • North America
    • Latin America
    • Western Europe
    • Eastern Europe
    • East Asia
    • South Asia & Pacific
    • Middle East & Africa

Table of Content

  1. Executive Summary
    • Global Market Outlook
    • Demand-side Trends
    • Supply-side Trends
    • Technology Roadmap Analysis
    • Analysis and Recommendations
  2. Market Overview
    • Market Coverage / Taxonomy
    • Market Definition / Scope / Limitations
  3. Market Background
    • Market Dynamics
      • Drivers
      • Restraints
      • Opportunity
      • Trends
    • Scenario Forecast
      • Demand in Optimistic Scenario
      • Demand in Likely Scenario
      • Demand in Conservative Scenario
    • Opportunity Map Analysis
    • Product Life Cycle Analysis
    • Supply Chain Analysis
      • Supply Side Participants and their Roles
        • Producers
        • Mid-Level Participants (Traders/ Agents/ Brokers)
        • Wholesalers and Distributors
      • Value Added and Value Created at Node in the Supply Chain
      • List of Biological Source Providers
      • List of Existing and Potential Buyers
    • Investment Feasibility Matrix
    • Value Chain Analysis
      • Profit Margin Analysis
      • Wholesalers and Distributors
      • Retailers
    • PESTLE and Porter’s Analysis
    • Regulatory Landscape
      • By Key Regions
      • By Key Countries
    • Production and Consumption Statistics
    • Import and Export Statistics
  4. Global Primary Human Hepatocytes Market Analysis 2020-2024 and Forecast, 2025-2035
    • Historical Market Size Value (USD Mn) & Volume (Units) Analysis, 2020-2024
    • Current and Future Market Size Value (USD Mn) & Volume (Units) Projections, 2025-2035
      • Y-o-Y Growth Trend Analysis
      • Absolute $ Opportunity Analysis
  5. Global Primary Human Hepatocytes Market Pricing Analysis 2020-2024 and Forecast 2025-2035
  6. Global Primary Human Hepatocytes Market Analysis 2020-2024 and Forecast 2025-2035, By Product Type
    • Introduction / Key Findings
    • Historical Market Size Value (USD Mn) & Volume (Units) Analysis By Product Type, 2020-2024
    • Current and Future Market Size Value (USD Mn) & Volume (Units) Analysis and Forecast By Product Type, 2025-2035
      • Cryopreserved Hepatocytes
      • Fresh (Isolated) Hepatocytes
      • Suspension Format
      • Plateable Hepatocytes
      • 3D Spheroid/Co-culture
    • Y-o-Y Growth Trend Analysis By Product Type, 2020-2024
    • Absolute $ Opportunity Analysis By Product Type, 2025-2035
  7. Global Primary Human Hepatocytes Market Analysis 2020-2024 and Forecast 2025-2035, By Source
    • Introduction / Key Findings
    • Historical Market Size Value (USD Mn) & Volume (Units) Analysis By Source, 2020-2024
    • Current and Future Market Size Value (USD Mn) & Volume (Units) Analysis and Forecast By Source, 2025-2035
      • Commercial Donor-Derived
      • Cadaveric Donor-Derived
      • iPSC-Derived Hepatocytes
    • Y-o-Y Growth Trend Analysis By Source, 2020-2024
    • Absolute $ Opportunity Analysis By Source, 2025-2035
  8. Global Primary Human Hepatocytes Market Analysis 2020-2024 and Forecast 2025-2035, By Application
    • Introduction / Key Findings
    • Historical Market Size Value (USD Mn) & Volume (Units) Analysis By Application, 2020-2024
    • Current and Future Market Size Value (USD Mn) & Volume (Units) Analysis and Forecast By Application, 2025-2035
      • Drug Metabolism & Toxicity Testing
      • Disease Modeling
      • Regenerative Medicine & Transplantation
      • Viral Hepatitis Research
      • Gene Therapy & Enzyme Induction Studies
    • Y-o-Y Growth Trend Analysis By Application, 2020-2024
    • Absolute $ Opportunity Analysis By Application, 2025-2035
  9. Global Primary Human Hepatocytes Market Analysis 2020-2024 and Forecast 2025-2035, By End User
    • Introduction / Key Findings
    • Historical Market Size Value (USD Mn) & Volume (Units) Analysis By End User, 2020-2024
    • Current and Future Market Size Value (USD Mn) & Volume (Units) Analysis and Forecast By End User, 2025-2035
      • Pharmaceutical & Biotech Companies
      • Contract Research Organizations (CROs)
      • Academic & Research Institutes
      • Hospitals & Clinical Settings
    • Y-o-Y Growth Trend Analysis By End User, 2020-2024
    • Absolute $ Opportunity Analysis By End User, 2025-2035
  10. Global Primary Human Hepatocytes Market Analysis 2020-2024 and Forecast 2025-2035, By Region
    • Introduction
    • Historical Market Size Value (USD Mn) & Volume (Units) Analysis By Region, 2020-2024
    • Current Market Size Value (USD Mn) & Volume (Units) Analysis and Forecast By Region, 2025-2035
      • North America
      • Latin America
      • Western Europe
      • East Asia
      • South Asia Pacific
      • Eastern Europe
      • Middle East & Africa
    • Market Attractiveness Analysis By Region
  11. North America Primary Human Hepatocytes Market Analysis 2020-2024 and Forecast 2025-2035, By Country
    • Historical Market Size Value (USD Mn) & Volume (Units) Trend Analysis By Market Taxonomy, 2020-2024
    • Market Size Value (USD Mn) & Volume (Units) Forecast By Market Taxonomy, 2025-2035
      • By Country
        • U.S.
        • Canada
        • Mexico
      • By Product Type
      • By Source
      • By Application
      • By End User
    • Market Attractiveness Analysis
      • By Country
      • By Product Type
      • By Source
      • By Application
      • By End User
    • Key Takeaways
  12. Latin America Primary Human Hepatocytes Market Analysis 2020-2024 and Forecast 2025-2035, By Country
    • Historical Market Size Value (USD Mn) & Volume (Units) Trend Analysis By Market Taxonomy, 2020-2024
    • Market Size Value (USD Mn) & Volume (Units) Forecast By Market Taxonomy, 2025-2035
      • By Country
        • Brazil
        • Chile
        • Rest of Latin America
      • By Product Type
      • By Source
      • By Application
      • By End User
    • Market Attractiveness Analysis
      • By Country
      • By Product Type
      • By Source
      • By Application
      • By End User
    • Key Takeaways
  13. Western Europe Primary Human Hepatocytes Market Analysis 2020-2024 and Forecast 2025-2035, By Country
    • Historical Market Size Value (USD Mn) & Volume (Units) Trend Analysis By Market Taxonomy, 2020-2024
    • Market Size Value (USD Mn) & Volume (Units) Forecast By Market Taxonomy, 2025-2035
      • By Country
        • Germany
        • Italy
        • France
        • U.K.
        • Spain
        • Russia
        • BENELUX
        • Rest of Europe
      • By Product Type
      • By Source
      • By Application
      • By End User
    • Market Attractiveness Analysis
      • By Country
      • By Product Type
      • By Source
      • By Application
      • By End User
    • Key Takeaways
  14. East Asia Primary Human Hepatocytes Market Analysis 2020-2024 and Forecast 2025-2035, By Country
    • Historical Market Size Value (USD Mn) & Volume (Units) Trend Analysis By Market Taxonomy, 2020-2024
    • Market Size Value (USD Mn) & Volume (Units) Forecast By Market Taxonomy, 2025-2035
      • By Country
        • China
        • Japan
        • South Korea
      • By Product Type
      • By Source
      • By Application
      • By End User
    • Market Attractiveness Analysis
      • By Country
      • By Product Type
      • By Source
      • By Application
      • By End User
    • Key Takeaways
  15. South Asia Pacific Primary Human Hepatocytes Market Analysis 2020-2024 and Forecast 2025-2035, By Country
    • Historical Market Size Value (USD Mn) & Volume (Units) Trend Analysis By Market Taxonomy, 2020-2024
    • Market Size Value (USD Mn) & Volume (Units) Forecast By Market Taxonomy, 2025-2035
      • By Country
        • India
        • ASEAN Countries
        • Australia & New Zealand
        • Rest of South Asia Pacific
      • By Product Type
      • By Source
      • By Application
      • By End User
    • Market Attractiveness Analysis
      • By Country
      • By Product Type
      • By Source
      • By Application
      • By End User
    • Key Takeaways
  16. Eastern Europe Primary Human Hepatocytes Market Analysis 2020-2024 and Forecast 2025-2035, By Country
    • Historical Market Size Value (USD Mn) & Volume (Units) Trend Analysis By Market Taxonomy, 2020-2024
    • Market Size Value (USD Mn) & Volume (Units) Forecast By Market Taxonomy, 2025-2035
      • By Country
        • Russia
        • Poland
        • Hungary
        • Balkan & Baltics
        • Rest of Eastern Europe
      • By Product Type
      • By Source
      • By Application
      • By End User
    • Market Attractiveness Analysis
      • By Country
      • By Product Type
      • By Source
      • By Application
      • By End User
    • Key Takeaways
  17. Middle East & Africa Primary Human Hepatocytes Market Analysis 2020-2024 and Forecast 2025-2035, By Country
    • Historical Market Size Value (USD Mn) & Volume (Units) Trend Analysis By Market Taxonomy, 2020-2024
    • Market Size Value (USD Mn) & Volume (Units) Forecast By Market Taxonomy, 2025-2035
      • By Country
        • KSA
        • Other GCC Countries
        • Turkiye
        • South Africa
        • Rest of MEA
      • By Product Type
      • By Source
      • By Application
      • By End User
    • Market Attractiveness Analysis
      • By Country
      • By Product Type
      • By Source
      • By Application
      • By End User
    • Key Takeaways
  18. Key Countries Primary Human Hepatocytes Market Analysis
    • U.S.
      • Pricing Analysis
      • Market Share Analysis, 2024
        • By Product Type
        • By Source
        • By Application
        • By End User
    • Germany
      • Pricing Analysis
      • Market Share Analysis, 2024
        • By Product Type
        • By Source
        • By Application
        • By End User
    • Japan
      • Pricing Analysis
      • Market Share Analysis, 2024
        • By Product Type
        • By Source
        • By Application
        • By End User
    • China
      • Pricing Analysis
      • Market Share Analysis, 2024
        • By Product Type
        • By Source
        • By Application
        • By End User
    • U.K.
      • Pricing Analysis
      • Market Share Analysis, 2024
        • By Product Type
        • By Source
        • By Application
        • By End User
  19. Market Structure Analysis
    • Competition Dashboard
    • Competition Benchmarking
    • Market Share Analysis of Top Players
      • By Regional
      • By Product Type
      • By Source
      • By Application
      • By End User
  20. Competition Analysis
    • Competition Deep Dive
      • ATCC
        • Overview
        • Product Portfolio
        • Profitability by Market Segments (Product/Age /Sales Channel/Region)
        • Sales Footprint
        • Strategy Overview
          • Marketing Strategy
          • Product Strategy
          • Channel Strategy
      • Thermo Fisher Scientific (Gibco)
        • Overview
        • Product Portfolio
        • Profitability by Market Segments (Product/Age /Sales Channel/Region)
        • Sales Footprint
        • Strategy Overview
          • Marketing Strategy
          • Product Strategy
          • Channel Strategy
      • ScienCell Research Laboratories
        • Overview
        • Product Portfolio
        • Profitability by Market Segments (Product/Age /Sales Channel/Region)
        • Sales Footprint
        • Strategy Overview
          • Marketing Strategy
          • Product Strategy
          • Channel Strategy
      • Preci
        • Overview
        • Product Portfolio
        • Profitability by Market Segments (Product/Age /Sales Channel/Region)
        • Sales Footprint
        • Strategy Overview
          • Marketing Strategy
          • Product Strategy
          • Channel Strategy
      • LifeNet Health LifeSciences
        • Overview
        • Product Portfolio
        • Profitability by Market Segments (Product/Age /Sales Channel/Region)
        • Sales Footprint
        • Strategy Overview
          • Marketing Strategy
          • Product Strategy
          • Channel Strategy
      • iXCells Biotechnologies
        • Overview
        • Product Portfolio
        • Profitability by Market Segments (Product/Age /Sales Channel/Region)
        • Sales Footprint
        • Strategy Overview
          • Marketing Strategy
          • Product Strategy
          • Channel Strategy
      • Axol Bioscience
        • Overview
        • Product Portfolio
        • Profitability by Market Segments (Product/Age /Sales Channel/Region)
        • Sales Footprint
        • Strategy Overview
          • Marketing Strategy
          • Product Strategy
          • Channel Strategy
      • Primacyt
        • Overview
        • Product Portfolio
        • Profitability by Market Segments (Product/Age /Sales Channel/Region)
        • Sales Footprint
        • Strategy Overview
          • Marketing Strategy
          • Product Strategy
          • Channel Strategy
      • Fujifilm Cellular Dynamics
        • Overview
        • Product Portfolio
        • Profitability by Market Segments (Product/Age /Sales Channel/Region)
        • Sales Footprint
        • Strategy Overview
          • Marketing Strategy
          • Product Strategy
          • Channel Strategy
      • In Vitro ADMET Laboratories (IVAL)
        • Overview
        • Product Portfolio
        • Profitability by Market Segments (Product/Age /Sales Channel/Region)
        • Sales Footprint
        • Strategy Overview
          • Marketing Strategy
          • Product Strategy
          • Channel Strategy
      • BeCytes Biotechnologies
        • Overview
        • Product Portfolio
        • Profitability by Market Segments (Product/Age /Sales Channel/Region)
        • Sales Footprint
        • Strategy Overview
          • Marketing Strategy
          • Product Strategy
          • Channel Strategy
  21. Assumptions & Acronyms Used
  22. Research Methodology

List Of Table

  • Table 1: Global Market Value (USD Mn) Forecast by Region, 2020 to 2035
  • Table 2: Global Market Volume (Units) Forecast by Region, 2020 to 2035
  • Table 3: Global Market Value (USD Mn) Forecast by Product Type, 2020 to 2035
  • Table 4: Global Market Volume (Units) Forecast by Product Type, 2020 to 2035
  • Table 5: Global Market Value (USD Mn) Forecast by Source, 2020 to 2035
  • Table 6: Global Market Volume (Units) Forecast by Source, 2020 to 2035
  • Table 7: Global Market Value (USD Mn) Forecast by Application, 2020 to 2035
  • Table 8: Global Market Volume (Units) Forecast by Application, 2020 to 2035
  • Table 9: Global Market Value (USD Mn) Forecast by End User, 2020 to 2035
  • Table 10: Global Market Volume (Units) Forecast by End User, 2020 to 2035
  • Table 11: North America Market Value (USD Mn) Forecast by Country, 2020 to 2035
  • Table 12: North America Market Volume (Units) Forecast by Country, 2020 to 2035
  • Table 13: North America Market Value (USD Mn) Forecast by Product Type, 2020 to 2035
  • Table 14: North America Market Volume (Units) Forecast by Product Type, 2020 to 2035
  • Table 15: North America Market Value (USD Mn) Forecast by Source, 2020 to 2035
  • Table 16: North America Market Volume (Units) Forecast by Source, 2020 to 2035
  • Table 17: North America Market Value (USD Mn) Forecast by Application, 2020 to 2035
  • Table 18: North America Market Volume (Units) Forecast by Application, 2020 to 2035
  • Table 19: North America Market Value (USD Mn) Forecast by End User, 2020 to 2035
  • Table 20: North America Market Volume (Units) Forecast by End User, 2020 to 2035
  • Table 21: Latin America Market Value (USD Mn) Forecast by Country, 2020 to 2035
  • Table 22: Latin America Market Volume (Units) Forecast by Country, 2020 to 2035
  • Table 23: Latin America Market Value (USD Mn) Forecast by Product Type, 2020 to 2035
  • Table 24: Latin America Market Volume (Units) Forecast by Product Type, 2020 to 2035
  • Table 25: Latin America Market Value (USD Mn) Forecast by Source, 2020 to 2035
  • Table 26: Latin America Market Volume (Units) Forecast by Source, 2020 to 2035
  • Table 27: Latin America Market Value (USD Mn) Forecast by Application, 2020 to 2035
  • Table 28: Latin America Market Volume (Units) Forecast by Application, 2020 to 2035
  • Table 29: Latin America Market Value (USD Mn) Forecast by End User, 2020 to 2035
  • Table 30: Latin America Market Volume (Units) Forecast by End User, 2020 to 2035
  • Table 31: Western Europe Market Value (USD Mn) Forecast by Country, 2020 to 2035
  • Table 32: Western Europe Market Volume (Units) Forecast by Country, 2020 to 2035
  • Table 33: Western Europe Market Value (USD Mn) Forecast by Product Type, 2020 to 2035
  • Table 34: Western Europe Market Volume (Units) Forecast by Product Type, 2020 to 2035
  • Table 35: Western Europe Market Value (USD Mn) Forecast by Source, 2020 to 2035
  • Table 36: Western Europe Market Volume (Units) Forecast by Source, 2020 to 2035
  • Table 37: Western Europe Market Value (USD Mn) Forecast by Application, 2020 to 2035
  • Table 38: Western Europe Market Volume (Units) Forecast by Application, 2020 to 2035
  • Table 39: Western Europe Market Value (USD Mn) Forecast by End User, 2020 to 2035
  • Table 40: Western Europe Market Volume (Units) Forecast by End User, 2020 to 2035
  • Table 41: East Asia Market Value (USD Mn) Forecast by Country, 2020 to 2035
  • Table 42: East Asia Market Volume (Units) Forecast by Country, 2020 to 2035
  • Table 43: East Asia Market Value (USD Mn) Forecast by Product Type, 2020 to 2035
  • Table 44: East Asia Market Volume (Units) Forecast by Product Type, 2020 to 2035
  • Table 45: East Asia Market Value (USD Mn) Forecast by Source, 2020 to 2035
  • Table 46: East Asia Market Volume (Units) Forecast by Source, 2020 to 2035
  • Table 47: East Asia Market Value (USD Mn) Forecast by Application, 2020 to 2035
  • Table 48: East Asia Market Volume (Units) Forecast by Application, 2020 to 2035
  • Table 49: East Asia Market Value (USD Mn) Forecast by End User, 2020 to 2035
  • Table 50: East Asia Market Volume (Units) Forecast by End User, 2020 to 2035
  • Table 51: South Asia Pacific Market Value (USD Mn) Forecast by Country, 2020 to 2035
  • Table 52: South Asia Pacific Market Volume (Units) Forecast by Country, 2020 to 2035
  • Table 53: South Asia Pacific Market Value (USD Mn) Forecast by Product Type, 2020 to 2035
  • Table 54: South Asia Pacific Market Volume (Units) Forecast by Product Type, 2020 to 2035
  • Table 55: South Asia Pacific Market Value (USD Mn) Forecast by Source, 2020 to 2035
  • Table 56: South Asia Pacific Market Volume (Units) Forecast by Source, 2020 to 2035
  • Table 57: South Asia Pacific Market Value (USD Mn) Forecast by Application, 2020 to 2035
  • Table 58: South Asia Pacific Market Volume (Units) Forecast by Application, 2020 to 2035
  • Table 59: South Asia Pacific Market Value (USD Mn) Forecast by End User, 2020 to 2035
  • Table 60: South Asia Pacific Market Volume (Units) Forecast by End User, 2020 to 2035
  • Table 61: Eastern Europe Market Value (USD Mn) Forecast by Country, 2020 to 2035
  • Table 62: Eastern Europe Market Volume (Units) Forecast by Country, 2020 to 2035
  • Table 63: Eastern Europe Market Value (USD Mn) Forecast by Product Type, 2020 to 2035
  • Table 64: Eastern Europe Market Volume (Units) Forecast by Product Type, 2020 to 2035
  • Table 65: Eastern Europe Market Value (USD Mn) Forecast by Source, 2020 to 2035
  • Table 66: Eastern Europe Market Volume (Units) Forecast by Source, 2020 to 2035
  • Table 67: Eastern Europe Market Value (USD Mn) Forecast by Application, 2020 to 2035
  • Table 68: Eastern Europe Market Volume (Units) Forecast by Application, 2020 to 2035
  • Table 69: Eastern Europe Market Value (USD Mn) Forecast by End User, 2020 to 2035
  • Table 70: Eastern Europe Market Volume (Units) Forecast by End User, 2020 to 2035
  • Table 71: Middle East & Africa Market Value (USD Mn) Forecast by Country, 2020 to 2035
  • Table 72: Middle East & Africa Market Volume (Units) Forecast by Country, 2020 to 2035
  • Table 73: Middle East & Africa Market Value (USD Mn) Forecast by Product Type, 2020 to 2035
  • Table 74: Middle East & Africa Market Volume (Units) Forecast by Product Type, 2020 to 2035
  • Table 75: Middle East & Africa Market Value (USD Mn) Forecast by Source, 2020 to 2035
  • Table 76: Middle East & Africa Market Volume (Units) Forecast by Source, 2020 to 2035
  • Table 77: Middle East & Africa Market Value (USD Mn) Forecast by Application, 2020 to 2035
  • Table 78: Middle East & Africa Market Volume (Units) Forecast by Application, 2020 to 2035
  • Table 79: Middle East & Africa Market Value (USD Mn) Forecast by End User, 2020 to 2035
  • Table 80: Middle East & Africa Market Volume (Units) Forecast by End User, 2020 to 2035

List Of Figures

  • Figure 1: Global Market Volume (Units) Forecast 2020 to 2035
  • Figure 2: Global Market Pricing Analysis
  • Figure 3: Global Market Value (USD Mn) Forecast 2020 to 2035
  • Figure 4: Global Market Value Share and BPS Analysis by Product Type, 2025 to 2035
  • Figure 5: Global Market Y-o-Y Growth Comparison by Product Type, 2025 to 2035
  • Figure 6: Global Market Attractiveness Analysis by Product Type
  • Figure 7: Global Market Value Share and BPS Analysis by Source, 2025 to 2035
  • Figure 8: Global Market Y-o-Y Growth Comparison by Source, 2025 to 2035
  • Figure 9: Global Market Attractiveness Analysis by Source
  • Figure 10: Global Market Value Share and BPS Analysis by Application, 2025 to 2035
  • Figure 11: Global Market Y-o-Y Growth Comparison by Application, 2025 to 2035
  • Figure 12: Global Market Attractiveness Analysis by Application
  • Figure 13: Global Market Value Share and BPS Analysis by End User, 2025 to 2035
  • Figure 14: Global Market Y-o-Y Growth Comparison by End User, 2025 to 2035
  • Figure 15: Global Market Attractiveness Analysis by End User
  • Figure 16: Global Market Value (USD Mn) Share and BPS Analysis by Region, 2025 to 2035
  • Figure 17: Global Market Y-o-Y Growth Comparison by Region, 2025 to 2035
  • Figure 18: Global Market Attractiveness Analysis by Region
  • Figure 19: North America Market Incremental $ Opportunity, 2025 to 2035
  • Figure 20: Latin America Market Incremental $ Opportunity, 2025 to 2035
  • Figure 21: Western Europe Market Incremental $ Opportunity, 2025 to 2035
  • Figure 22: East Asia Market Incremental $ Opportunity, 2025 to 2035
  • Figure 23: South Asia Pacific Market Incremental $ Opportunity, 2025 to 2035
  • Figure 24: Eastern Europe Market Incremental $ Opportunity, 2025 to 2035
  • Figure 25: Middle East & Africa Market Incremental $ Opportunity, 2025 to 2035
  • Figure 26: North America Market Value Share and BPS Analysis by Country, 2025 to 2035
  • Figure 27: North America Market Value Share and BPS Analysis by Product Type, 2025 to 2035
  • Figure 28: North America Market Y-o-Y Growth Comparison by Product Type, 2025 to 2035
  • Figure 29: North America Market Attractiveness Analysis by Product Type
  • Figure 30: North America Market Value Share and BPS Analysis by Source, 2025 to 2035
  • Figure 31: North America Market Y-o-Y Growth Comparison by Source, 2025 to 2035
  • Figure 32: North America Market Attractiveness Analysis by Source
  • Figure 33: North America Market Value Share and BPS Analysis by Application, 2025 to 2035
  • Figure 34: North America Market Y-o-Y Growth Comparison by Application, 2025 to 2035
  • Figure 35: North America Market Attractiveness Analysis by Application
  • Figure 36: North America Market Value Share and BPS Analysis by End User, 2025 to 2035
  • Figure 37: North America Market Y-o-Y Growth Comparison by End User, 2025 to 2035
  • Figure 38: North America Market Attractiveness Analysis by End User
  • Figure 39: Latin America Market Value Share and BPS Analysis by Country, 2025 to 2035
  • Figure 40: Latin America Market Value Share and BPS Analysis by Product Type, 2025 to 2035
  • Figure 41: Latin America Market Y-o-Y Growth Comparison by Product Type, 2025 to 2035
  • Figure 42: Latin America Market Attractiveness Analysis by Product Type
  • Figure 43: Latin America Market Value Share and BPS Analysis by Source, 2025 to 2035
  • Figure 44: Latin America Market Y-o-Y Growth Comparison by Source, 2025 to 2035
  • Figure 45: Latin America Market Attractiveness Analysis by Source
  • Figure 46: Latin America Market Value Share and BPS Analysis by Application, 2025 to 2035
  • Figure 47: Latin America Market Y-o-Y Growth Comparison by Application, 2025 to 2035
  • Figure 48: Latin America Market Attractiveness Analysis by Application
  • Figure 49: Latin America Market Value Share and BPS Analysis by End User, 2025 to 2035
  • Figure 50: Latin America Market Y-o-Y Growth Comparison by End User, 2025 to 2035
  • Figure 51: Latin America Market Attractiveness Analysis by End User
  • Figure 52: Western Europe Market Value Share and BPS Analysis by Country, 2025 to 2035
  • Figure 53: Western Europe Market Value Share and BPS Analysis by Product Type, 2025 to 2035
  • Figure 54: Western Europe Market Y-o-Y Growth Comparison by Product Type, 2025 to 2035
  • Figure 55: Western Europe Market Attractiveness Analysis by Product Type
  • Figure 56: Western Europe Market Value Share and BPS Analysis by Source, 2025 to 2035
  • Figure 57: Western Europe Market Y-o-Y Growth Comparison by Source, 2025 to 2035
  • Figure 58: Western Europe Market Attractiveness Analysis by Source
  • Figure 59: Western Europe Market Value Share and BPS Analysis by Application, 2025 to 2035
  • Figure 60: Western Europe Market Y-o-Y Growth Comparison by Application, 2025 to 2035
  • Figure 61: Western Europe Market Attractiveness Analysis by Application
  • Figure 62: Western Europe Market Value Share and BPS Analysis by End User, 2025 to 2035
  • Figure 63: Western Europe Market Y-o-Y Growth Comparison by End User, 2025 to 2035
  • Figure 64: Western Europe Market Attractiveness Analysis by End User
  • Figure 65: East Asia Market Value Share and BPS Analysis by Country, 2025 to 2035
  • Figure 66: East Asia Market Value Share and BPS Analysis by Product Type, 2025 to 2035
  • Figure 67: East Asia Market Y-o-Y Growth Comparison by Product Type, 2025 to 2035
  • Figure 68: East Asia Market Attractiveness Analysis by Product Type
  • Figure 69: East Asia Market Value Share and BPS Analysis by Source, 2025 to 2035
  • Figure 70: East Asia Market Y-o-Y Growth Comparison by Source, 2025 to 2035
  • Figure 71: East Asia Market Attractiveness Analysis by Source
  • Figure 72: East Asia Market Value Share and BPS Analysis by Application, 2025 to 2035
  • Figure 73: East Asia Market Y-o-Y Growth Comparison by Application, 2025 to 2035
  • Figure 74: East Asia Market Attractiveness Analysis by Application
  • Figure 75: East Asia Market Value Share and BPS Analysis by End User, 2025 to 2035
  • Figure 76: East Asia Market Y-o-Y Growth Comparison by End User, 2025 to 2035
  • Figure 77: East Asia Market Attractiveness Analysis by End User
  • Figure 78: South Asia Pacific Market Value Share and BPS Analysis by Country, 2025 to 2035
  • Figure 79: South Asia Pacific Market Value Share and BPS Analysis by Product Type, 2025 to 2035
  • Figure 80: South Asia Pacific Market Y-o-Y Growth Comparison by Product Type, 2025 to 2035
  • Figure 81: South Asia Pacific Market Attractiveness Analysis by Product Type
  • Figure 82: South Asia Pacific Market Value Share and BPS Analysis by Source, 2025 to 2035
  • Figure 83: South Asia Pacific Market Y-o-Y Growth Comparison by Source, 2025 to 2035
  • Figure 84: South Asia Pacific Market Attractiveness Analysis by Source
  • Figure 85: South Asia Pacific Market Value Share and BPS Analysis by Application, 2025 to 2035
  • Figure 86: South Asia Pacific Market Y-o-Y Growth Comparison by Application, 2025 to 2035
  • Figure 87: South Asia Pacific Market Attractiveness Analysis by Application
  • Figure 88: South Asia Pacific Market Value Share and BPS Analysis by End User, 2025 to 2035
  • Figure 89: South Asia Pacific Market Y-o-Y Growth Comparison by End User, 2025 to 2035
  • Figure 90: South Asia Pacific Market Attractiveness Analysis by End User
  • Figure 91: Eastern Europe Market Value Share and BPS Analysis by Country, 2025 to 2035
  • Figure 92: Eastern Europe Market Value Share and BPS Analysis by Product Type, 2025 to 2035
  • Figure 93: Eastern Europe Market Y-o-Y Growth Comparison by Product Type, 2025 to 2035
  • Figure 94: Eastern Europe Market Attractiveness Analysis by Product Type
  • Figure 95: Eastern Europe Market Value Share and BPS Analysis by Source, 2025 to 2035
  • Figure 96: Eastern Europe Market Y-o-Y Growth Comparison by Source, 2025 to 2035
  • Figure 97: Eastern Europe Market Attractiveness Analysis by Source
  • Figure 98: Eastern Europe Market Value Share and BPS Analysis by Application, 2025 to 2035
  • Figure 99: Eastern Europe Market Y-o-Y Growth Comparison by Application, 2025 to 2035
  • Figure 100: Eastern Europe Market Attractiveness Analysis by Application
  • Figure 101: Eastern Europe Market Value Share and BPS Analysis by End User, 2025 to 2035
  • Figure 102: Eastern Europe Market Y-o-Y Growth Comparison by End User, 2025 to 2035
  • Figure 103: Eastern Europe Market Attractiveness Analysis by End User
  • Figure 104: Middle East & Africa Market Value Share and BPS Analysis by Country, 2025 to 2035
  • Figure 105: Middle East & Africa Market Value Share and BPS Analysis by Product Type, 2025 to 2035
  • Figure 106: Middle East & Africa Market Y-o-Y Growth Comparison by Product Type, 2025 to 2035
  • Figure 107: Middle East & Africa Market Attractiveness Analysis by Product Type
  • Figure 108: Middle East & Africa Market Value Share and BPS Analysis by Source, 2025 to 2035
  • Figure 109: Middle East & Africa Market Y-o-Y Growth Comparison by Source, 2025 to 2035
  • Figure 110: Middle East & Africa Market Attractiveness Analysis by Source
  • Figure 111: Middle East & Africa Market Value Share and BPS Analysis by Application, 2025 to 2035
  • Figure 112: Middle East & Africa Market Y-o-Y Growth Comparison by Application, 2025 to 2035
  • Figure 113: Middle East & Africa Market Attractiveness Analysis by Application
  • Figure 114: Middle East & Africa Market Value Share and BPS Analysis by End User, 2025 to 2035
  • Figure 115: Middle East & Africa Market Y-o-Y Growth Comparison by End User, 2025 to 2035
  • Figure 116: Middle East & Africa Market Attractiveness Analysis by End User
  • Figure 117: Global Market - Tier Structure Analysis
  • Figure 118: Global Market - Company Share Analysis

- FAQs -

What was the global Primary human hepatocytes market size reported by Fact.MR for 2025?

The global primary human hepatocytes market was valued at USD 173 million in 2025.

Who are the major players operating in the primary human hepatocytes market?

Prominent players in the market are ATCC, Thermo Fisher Scientific (Gibco), ScienCell Research Laboratories, Preci, LifeNet Health LifeSciences, iXCells Biotechnologies, Axol Bioscience, Primacyt, Fujifilm Cellular Dynamics, In Vitro ADMET Laboratories (IVAL), and BeCytes Biotechnologies.

What is the Estimated Valuation of the primary human hepatocytes market in 2035?

The market is expected to reach a valuation of USD 316 million in 2035.

What value CAGR did the Primary human hepatocytes market exhibit over the last five years?

The historic growth rate of the primary human hepatocytes market was 4.7% from 2020-2024.

Primary Human Hepatocytes Market

Schedule a Call