- Market Value (2025): USD 19.1 Bn
- Estimated Value (2026): USD 21.6 Bn
- Forecast Value (2036): USD 73.2 Bn
- CAGR (2026-2036): 13.0%
What is the Process Orchestration Market forecast to be worth by 2036?
USD 21.56 billion in 2026 to USD 73.22 billion by 2036, at a 13.0% CAGR.
- As per Fact.MR analysis, the Process_Orchestration_Market market was valued at USD 19.1 billion in 2025.
- Industry revenue is forecast to rise from USD 21.6 billion in 2026 to USD 73.2 billion by 2036.
- The forecast 13.0% CAGR reflects rising integration complexity, cloud-based deployment and demand for auditable automation across business functions.
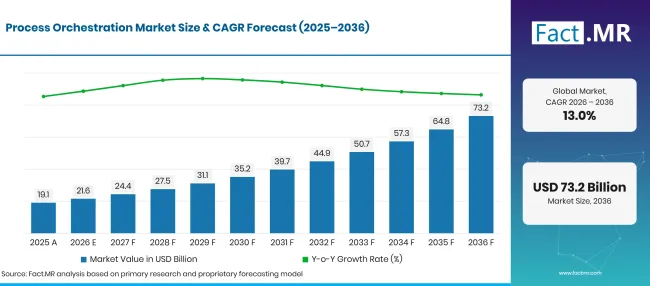
Process Orchestration Market Forecast Global | Source: Fact.MR
| Year | Basis | Market Value (USD billion) |
|---|---|---|
| 2025 | Historical estimate | 19.1 |
| 2026 | Base-year estimate | 21.6 |
| 2036 | Forecast | 73.2 |
| CAGR 2026–2036 | Forecast growth | 13.0% |
Source: Fact.MR analysis. Updated Oct 27, 2026
What are the defining numbers behind Process Orchestration Market growth?
Market value is forecast to increase by USD 51.66 billion between 2026 and 2036. Solutions account for 58.2% of the 2026 type split, cloud deployment for 60.0% and large enterprises for 67.3%. Supply chain management and order fulfillment is the biggest functional allocation at 28.4%, while BFSI is the largest end-user vertical at 22.4%. These shares do not include every workflow application or underlying cloud computing service. CNCF's recent surveys document broad adoption of container-based infrastructure, an important enabling environment for orchestration without being a direct measurement of this market. [1] [3]
- Demand Drivers in the Market
- Complex customer journeys involve several systems of record. Teams need a durable view of whether a payment, inventory reservation or service handoff has actually completed, particularly after partial failure.
- Cloud deployment reduces the need to build a separate execution engine for every process. The expansion of cloud orchestration systems provides technical context, although infrastructure resource scheduling is distinct from coordinating business work.
- Banks and insurers face a strong need for audit trails across onboarding, servicing and exception handling. Orchestration can make handoffs observable without removing accountability for regulated decisions.
- As enterprises deploy AI-supported tasks, they also need approval gates, retry behavior, version control and human escalation for sensitive actions. Governance becomes more valuable when automated decisions can change their downstream effects. [4]
- Operational leaders are increasingly measuring process completion time and exception rates across departments rather than judging automation solely by the number of individual tasks completed.
- Key Segments Analyzed
- By Types: Solutions represents 58.2% of the 2026 market. Orchestration platforms hold the larger value allocation.
- By Deployment: Cloud represents 60.0% of the 2026 market. Cloud delivery is the largest deployment mode.
- By Enterprise Size: Large Enterprises represents 67.3% of the 2026 market. Complex process estates concentrate demand among large enterprises.
- By Business Functions: Supply Chain Management and Order Fulfillment represents 28.4% of the 2026 market. Order management has the highest functional allocation.
- By End-users: BFSI represents 22.4% of the 2026 market. BFSI is the largest single end-user vertical.
- Analyst Opinion at Fact.MR
- Shambu Nath Jha, Sr. Consultant, Fact.MR says, “The winning orchestration platform will not necessarily be the one with the most connectors. Enterprise buyers are looking for predictable execution when a process spans several systems, runs for days and encounters exceptions that cannot be solved with an automatic retry. Durable audit records, versioning and human control points will determine whether orchestration moves into core operations.”
- Strategic Implications
- Technology buyers should select one high-friction journey, document its failure paths and quantify manual rework before deploying a broader orchestration layer.
- Vendors should support idempotency, compensating actions and clear process state so cross-system retries do not create duplicate payments or orders.
- Regulated organizations need human decision gates and audit-ready execution records when introducing autonomous components from the agentic orchestration market. [4]
- Consultancies can build stronger projects by assigning process ownership to a business function rather than treating the program as a platform-only IT installation.
How does the Process Orchestration Market break down by segment?
Solutions lead Types at 58.2%; Cloud tops Deployment at 60.0%; Large Enterprises account for 67.3%; Supply Chain Management and Order Fulfillment leads Business Functions at 28.4%; BFSI heads End-users at 22.4%.
Why do solutions lead the process orchestration type split?
Solutions account for 58.2% of the Types segment in 2026.
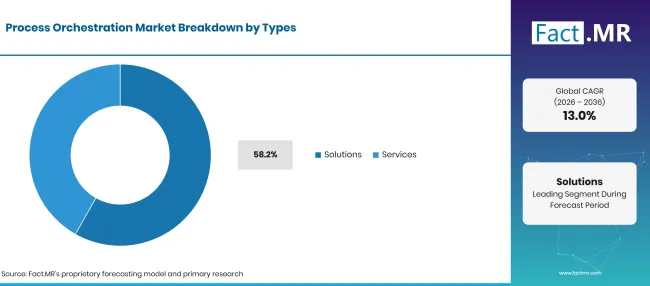
Process Orchestration Market Breakdown Types 1 | Source: Fact.MR
| Types | Share (2026) |
|---|---|
| Solutions (Leading segment) | 58.2% |
| Other segments combined | 41.8% |
| Total | 100.0% |
Source: Fact.MR analysis. Updated Oct 27, 2026
Solutions account for 58.2% of 2026 value because organizations need persistent engines that model dependencies, manage state and record a complete execution history. Services remain significant at 41.8%, covering process design, integration, migration and ongoing changes to complicated deployments. The sale of software alone does not guarantee an effective deployment. A poorly defined exception path can leave a business process stalled even when every connected application appears operational. The adjacent business workflow automation market overlaps at task routing but also includes automation that does not coordinate a multi-system process end to end.
What makes cloud the leading deployment model?
Cloud accounts for 60.0% of the Deployment segment in 2026.
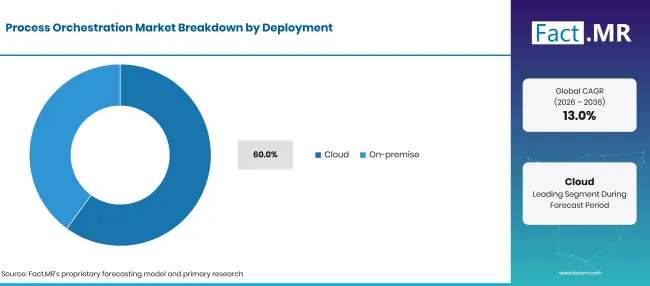
Process Orchestration Market Breakdown Deployment 1 | Source: Fact.MR
| Deployment | Share (2026) |
|---|---|
| Cloud (Leading segment) | 60.0% |
| Other segments combined | 40.0% |
| Total | 100.0% |
Source: Fact.MR analysis. Updated Oct 27, 2026
Cloud deployment holds 60.0% in 2026, helped by elastic execution capacity, managed services and the convenience of connecting distributed applications. On-premise remains substantial where sensitive workloads, data-residency policies or legacy system dependencies complicate migration. Large companies often operate a hybrid estate and want one orchestration model spanning more than one hosting location. CNCF's reports show maturing infrastructure practices, while the enterprise still has to design business-level retries, access controls and exception ownership. [1] [3]
Why do large enterprises account for most market demand?
Large enterprises account for 67.3% of the Enterprise Size segment in 2026.
| Enterprise Size | Share (2026) |
|---|---|
| Large Enterprises (Leading segment) | 67.3% |
| Other segments combined | 32.7% |
| Total | 100.0% |
Source: Fact.MR analysis. Updated Oct 27, 2026
Large enterprises represent 67.3% of 2026 spending. They may run several ERP instances, a customer relationship platform, data warehouses and specialized departmental systems, creating long chains of dependencies. A failed transfer can block thousands of transactions or require costly manual reconciliation. Smaller organizations also gain from orchestration, but the entry purchase must be simple enough to manage without a dedicated platform engineering team. Services, templates and managed deployment can reduce that barrier.
Why does order fulfillment lead the functional demand split?
Supply Chain Management and Order Fulfillment accounts for 28.4% of the Business Functions segment in 2026.
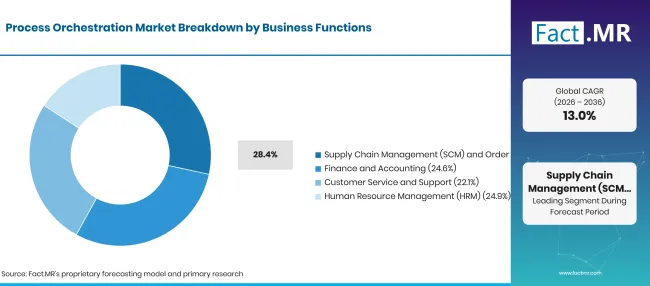
Process Orchestration Market Breakdown Business Functions 1 | Source: Fact.MR
| Business Functions | Share (2026) |
|---|---|
| Supply Chain Management and Order Fulfillment (Leading segment) | 28.4% |
| Other segments combined | 71.6% |
| Total | 100.0% |
Source: Fact.MR analysis. Updated Oct 27, 2026
Supply chain management and order fulfillment takes 28.4% of 2026 value because an order may pass through credit authorization, inventory checks, warehouse release, shipping and billing. A partial failure can create an expensive mismatch between physical goods and system records. Finance and human resources carry comparable opportunities, but their approval and compliance structures differ. Customer service often benefits when ticket handling and fulfillment state are connected. Individual screen-level bots remain part of the robotic process automation market; orchestration adds process state and coordination above those tasks.
What places BFSI ahead of other end-user industries?
BFSI accounts for 22.4% of the End-users segment in 2026.
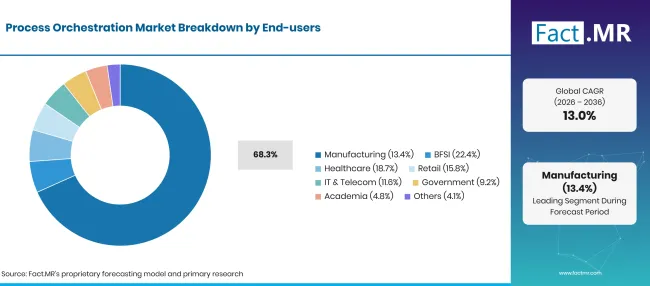
Process Orchestration Market Breakdown End Users 1 | Source: Fact.MR
| End-users | Share (2026) |
|---|---|
| BFSI (Leading segment) | 22.4% |
| Other segments combined | 77.6% |
| Total | 100.0% |
Source: Fact.MR analysis. Updated Oct 27, 2026
BFSI accounts for 22.4% of the 2026 market. Onboarding, claims and exception handling need clear records of who approved what and when a process changed state. Healthcare follows with 18.7%, reflecting referral, scheduling, patient administration and revenue-cycle coordination. Retail requires order and return handling, while manufacturing values the connection of planning, procurement and fulfillment. Public-sector agencies can use orchestration to reduce repeated manual handoffs, but identity, accountability and fair treatment remain essential. The OECD has highlighted governance questions that accompany broader AI adoption in government. [5]
What is accelerating Process Orchestration Market adoption, and what is holding it back?
Strong demand is tempered by integration work and organizational adoption. Financial value depends on whether processes are resilient and observable once automated, not on the number of workflows that have been diagrammed.
Drivers Impact Analysis
| DRIVER | (~) % IMPACT ON CAGR | GEOGRAPHIC RELEVANCE | IMPACT TIMELINE |
|---|---|---|---|
| Multi-application process complexity | +1.3% | North America, Europe | 2026–2036 |
| Cloud-native business application adoption | +1.1% | Global | 2026–2035 |
| Compliance demand for auditable processes | +0.8% | BFSI, healthcare | 2027–2036 |
| Need to resolve process exceptions faster | +1.0% | Retail, manufacturing | 2026–2034 |
| Integration of human and AI-assisted tasks | +0.9% | USA, Germany, Japan | 2028–2036 |
Source: Fact.MR analysis. Updated Oct 27, 2026
Opportunity Impact Analysis
| OPPORTUNITY | (~) % IMPACT ON CAGR | GEOGRAPHIC RELEVANCE | IMPACT TIMELINE |
|---|---|---|---|
| Unified execution across hybrid environments | +1.2% | Germany, Japan, UK | 2028–2036 |
| Prebuilt industry process blueprints | +0.7% | BFSI, healthcare | 2027–2035 |
| Long-running process observability services | +0.8% | Global enterprises | 2026–2036 |
| SME-ready managed orchestration | +0.6% | Brazil, Asia | 2027–2036 |
Source: Fact.MR analysis. Updated Oct 27, 2026
Restraints Impact Analysis
| RESTRAINT | (~) % IMPACT ON CAGR | GEOGRAPHIC RELEVANCE | IMPACT TIMELINE |
|---|---|---|---|
| Legacy integration complexity | -1.0% | Large enterprises globally | 2026–2036 |
| Unclear ownership between business and IT | -0.8% | Global | 2026–2032 |
| Data access and audit requirements | -0.7% | Europe, BFSI | 2027–2036 |
| Process sprawl without operational governance | -0.9% | Cloud-heavy enterprises | 2028–2036 |
Source: Fact.MR analysis. Updated Oct 27, 2026
Which countries are scaling the Process Orchestration Market through 2036?
| Country | CAGR (2026–2036) |
|---|---|
| Germany | 16.32% |
| Brazil | 10.74% |
| United States | 9.99% |
| United Kingdom | 9.62% |
| Japan | 11.17% |
Source: Fact.MR analysis. Updated Oct 27, 2026
Why is Germany forecast to lead growth in process orchestration?
16.32% CAGR through 2036. Industry workflow complexity and compliance needs support rapid adoption.
Germany has the highest forecast among the five countries at 16.32% CAGR. Manufacturers and business-service providers must coordinate long-running processes across ERP systems, suppliers and regional plants. The opportunity is substantial where manual exception handling delays orders or inventory movements. European AI and data-governance expectations also encourage clearer records of automated decisions rather than uncontrolled scripts. [4] Organizations able to show operational benefits and maintain accountability are likely to move from pilots into production faster.
How does Brazil’s market reflect digital process modernization?
10.74% CAGR through 2036. Customer-facing services are adding cross-system automation.
Brazil's 10.74% CAGR outlook is supported by digital banking, retail and growing use of enterprise cloud services. Many organizations still operate a mixture of modern apps and customized legacy systems, which makes integration quality the central adoption issue. A practical first project may cover loan onboarding or order-to-cash reconciliation, where a stalled case has a visible cost. Simpler deployment and local integration talent will matter more than adding a large number of rarely used features.
What is driving US investment despite a more mature base?
9.99% CAGR through 2036. Enterprises are scaling established automation into resilient workflows.
The United States is projected to expand at 9.99% CAGR. Large software estates already contain robotic automation, workflow tools and API integrations; orchestration purchasing increasingly addresses what happens when those tools disagree. Companies want an execution record that reveals exceptions before they become customer complaints. CNCF case studies illustrate the maturity of workflow engines in technical environments, although a technical pipeline is not a direct proxy for the business orchestration category. [2] Procurement decisions often depend on measurable reductions in manual reconciliation.
How are UK service industries deploying orchestration?
9.62% CAGR through 2036. Auditability and legacy integration influence implementation choices.
The UK is forecast to grow at 9.62%. Financial services and public-service organizations face complex approval chains, while retail and logistics operators need reliable order and return handling. Requirements for access controls and traceable decisions can extend project design, especially when AI-driven tasks are inserted into a regulated process. Buyers may prefer phased integration with existing systems over a rapid replacement of every workflow application.
Why is Japan prioritizing process reliability?
11.17% CAGR through 2036. Labor constraints and precise operational handoffs strengthen the case.
Japan's 11.17% CAGR outlook reflects pressure to make administrative and operational processes less dependent on manual transfers. Manufacturing, financial services and logistics firms have well-defined workflows but often connect systems built at different times. Durable execution and clear exception ownership can help reduce delays without forcing every department onto a single application. Buyers are likely to test stability and integration depth carefully before broad rollout.
Who competes in the Process Orchestration Market?
Camunda and Appian focus on process automation and orchestration capabilities, while IBM, SAP, Microsoft, ServiceNow and Pegasystems offer relevant tools within broader enterprise software portfolios. UiPath and Automation Anywhere contribute task-automation capabilities that may be coordinated by process-level systems. The offerings differ in execution model, workflow design, integration scope and operational ownership, so they should not be treated as interchangeable products.
Competitive evaluation now extends beyond process diagrams. Buyers test execution logs, restart and retry behavior, policy enforcement, connector maintenance and total implementation effort. The best commercial fit varies by use case: a bank processing a regulated decision has different requirements from a manufacturer coordinating an order across plants.
Which companies are the key providers?
- Camunda Services GmbH
- Appian Corporation
- IBM Corporation
- SAP SE
- Microsoft Corporation
- ServiceNow, Inc.
- Pegasystems Inc.
- UiPath Inc.
- Automation Anywhere, Inc.
How is the market segmented?
-
By Types
- Solutions
- Services
-
By Deployment
- Cloud
- On-premise
-
By Enterprise Size
- Large Enterprises
- Small & Medium Enterprises
-
By Business Functions
- Supply Chain Management and Order Fulfillment
- Human Resource Management
- Finance and Accounting
- Customer Service and Support
-
By End-users
- BFSI
- Healthcare
- Retail
- Manufacturing
- IT & Telecom
- Government
- Academia
- Others
-
By Region
- North America
- Latin America
- Western Europe
- Eastern Europe
- East Asia
- South Asia & Pacific
- Middle East & Africa
Bibliography
- [1] Cloud Native Computing Foundation. (2025, November 11). State of cloud native development.
- [2] Cloud Native Computing Foundation. (2026, April 30). Adobe: CNCF case study.
- [3] Cloud Native Computing Foundation. (2026, January 20). The CNCF annual cloud native survey: The infrastructure of AI’s future.
- [4] European Commission. (n.d.). AI Act: Regulatory framework for artificial intelligence.
- [5] Organisation for Economic Co-operation and Development. (2025, September 18). Governing with artificial intelligence.
This Report Answers
- What is the process orchestration market size in 2026 and 2036?
- How much value is generated by solutions versus services?
- What is the split between cloud and on-premise deployment?
- Which business function accounts for the largest share?
- Why is BFSI the largest end-user sector?
- What is the difference between process orchestration, RPA and cloud infrastructure orchestration?
What does the Process Orchestration Market cover?
The study measures software solutions and related services that coordinate multi-step business processes across applications, people and systems. It examines deployment, enterprise size, function, industry and five national markets. Orchestration is defined by controlling end-to-end execution, state, dependencies and exception handling rather than merely automating a single action.
What is included in the scope?
Process orchestration platform revenue, directly related integration and operational services, cloud and on-premise deployments, enterprise and SME implementations, business-function applications and end-user sectors listed in the segmentation.
What is excluded from the scope?
Standalone RPA bot licenses used without orchestration; infrastructure-only Kubernetes resource scheduling; general cloud compute or storage; unrelated BPM software not performing orchestration; and all company revenues outside the defined software and services category.
How Was the Analysis Built?
The analysis draws on 120+ sources, 35+ company portfolios, 25+ countries, and more than 20 industry interviews.
- Primary Research: Primary research includes discussions with manufacturers, service providers, technology developers, distributors, end users, and subject-matter experts. These conversations examine purchasing priorities, product adoption, operational challenges, approval requirements, competitive positioning, and the factors that influence wider market acceptance.
- Desk Research: Desk research covers government statistics, regulatory publications, company filings, trade data, technical studies, industry associations, standards, public policy, and other authoritative sources. Every source used in the analysis is documented in the bibliography.
- Market Sizing and Forecasting: Market estimates combine historical performance, demand indicators, pricing and volume trends, segment shares, company participation, country-level growth, adoption patterns, investment activity, and barriers to market expansion.
- Data Validation and Update Cycle: Findings are validated by comparing primary interviews with public data, company activity, regulatory changes, trade patterns, and industry developments. Regular updates review new product launches, capacity changes, partnerships, approvals, and shifts in commercial adoption.
Segmentation
What is the report’s scope and coverage?
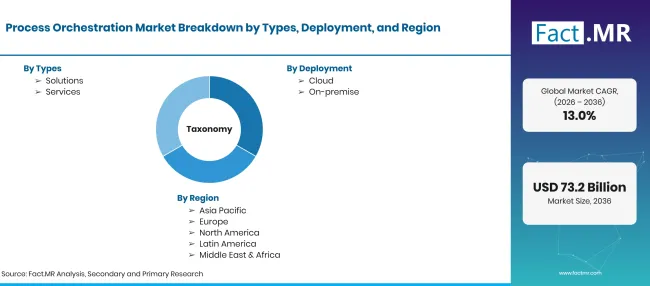
Process Orchestration Market Taxonomy | Source: Fact.MR
| Attribute | Details |
|---|---|
| Quantitative Units | USD 21.56 billion in 2026 to USD 73.22 billion by 2036 at 13.0% CAGR |
| Market Definition | Software solutions and related services that coordinate business processes across multiple applications, departments and enterprise systems. Market value includes orchestration platforms and supporting services for process execution, integration, monitoring and exception management. |
| Types | Solutions; Services |
| Deployment | Cloud; On-premise |
| Enterprise Size | Large Enterprises; Small & Medium Enterprises |
| Business Functions | Supply Chain Management and Order Fulfillment; Human Resource Management; Finance and Accounting; Customer Service and Support |
| End-users | BFSI; Healthcare; Retail; Manufacturing; IT & Telecom; Government; Academia; Others |
| Regions Covered | North America; Latin America; Western Europe; Eastern Europe; East Asia; South Asia & Pacific; Middle East & Africa |
| Countries Covered | Germany; Japan; United Kingdom; United States; Brazil |
| Forecast Period | 2026 to 2036 |
| Approach | Hybrid top-down and bottom-up approach using enterprise software spending, cloud adoption, deployment models, organization size, business process automation budgets, solution and service revenue, and supplier portfolio analysis. |
Source: Fact.MR analysis. Updated Oct 27, 2026
Frequently Asked Questions
What is the size of the process orchestration market in 2026?
What market value is projected for 2036?
What is the forecast CAGR?
Which type accounts for more revenue?
What is the cloud deployment share?
Which end-user industry is the largest?
Who worked on this report


Preview the report firsthand - request a free sample
Free SampleGet the brochure for pricing and purchase details
Download PDF