- Market Value (2025): USD 65.2 Mn
- Estimated Value (2026): USD 79 Mn
- Forecast Value (2036): USD 540 Mn
- CAGR (2026-2036): 21.2%
What is the Recipe Drift Analytics Market forecast to be worth by 2036?
USD 79 million in 2026 to USD 540 million by 2036 at 21.2% CAGR.
- The recipe drift analytics market crossed a valuation of USD 65.2 million in 2025 as fabs put more process data under continuous review.
- Demand is projected to increase from USD 79 million in 2026 to USD 540 million by 2036.
- The market is forecast to record 21.2% CAGR from 2026 to 2036 as foundries and memory makers tighten approval checks around critical process recipes.
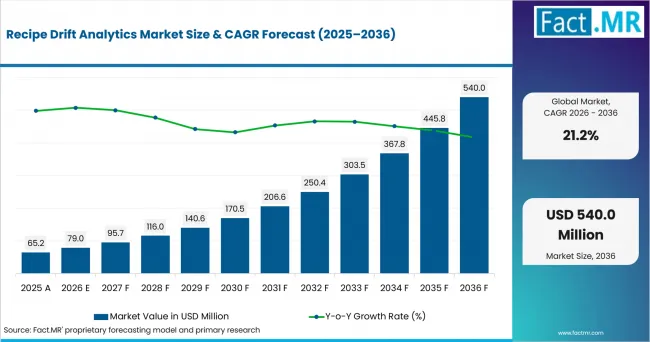
Recipe Drift Analytics Market Value Analysis | Source: Fact.MR
What are the defining numbers behind Recipe Drift Analytics Market growth?
USD 461 million absolute opportunity by 2036, led by Statistical trace analysis, Etch and Edge/on-tool deployment.
- Demand Drivers in the Market
- Process engineers need trace-level comparison tools because small sensor shifts can move a qualified recipe outside its release window.
- Fab operations teams need early excursion alerts so one drifting chamber does not contaminate a wider lot history.
- Equipment teams need edge analytics close to the tool, especially around recipes used in semiconductor dry etch systems.
- Yield engineers need normalized data across tools because recipe history, alarm logs and metrology results are often stored in separate systems.
- Key Segments Analyzed
- By Analytics Approach: Statistical trace analysis is expected to hold 36.0% share in 2026 due to its fit with control-chart logic and trace history review.
- By Tool Coverage: Etch is projected to account for 29.0% share in 2026 owing to narrow process windows and chamber matching needs.
- By Deployment: Edge/on-tool is anticipated to capture 44.0% share in 2026 supported by faster fault response near production tools.
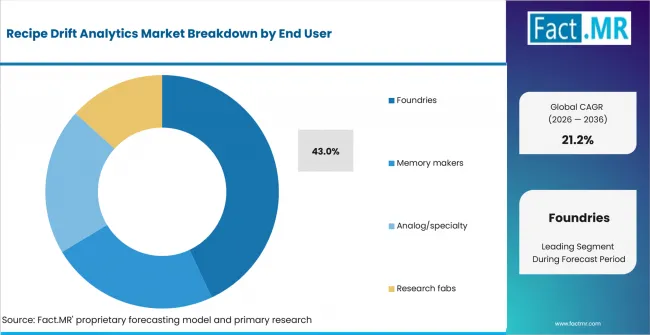
- By End User: Foundries are estimated to represent 43.0% share in 2026 as mixed-customer production raises the value of recipe discipline.
- Analyst Opinion at Fact.MR
- Shambhu Nath Jha, Senior Consultant at Fact.MR, states, “Recipe drift analytics is drawing attention because fabs now treat a released recipe as a living control object. The next phase is expected to reward tools that explain where drift started and which lots are exposed. Strong providers should combine trace analytics, FDC evidence and production-safe integration.”
- Strategic Implications
- Fab managers should align recipe-drift rules with actual release limits instead of using generic alarm thresholds.
- Equipment vendors should prove that analytics run reliably near process tools without slowing recipe execution.
- Process-control teams should connect drift alerts with wafer disposition steps so engineers can act before downstream metrology.
- Investors should separate recipe-specific analytics from factory dashboards and from standalone semiconductor defect inspection equipment unless inspection outputs are used directly to validate recipe-drift events.
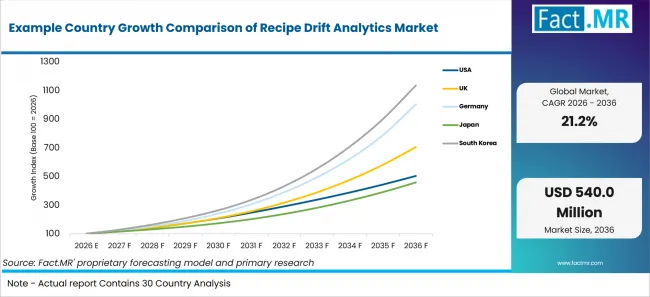
The USA is expected to record 23.03% CAGR through 2036, supported by fab awards and digital-twin validation. Taiwan is projected to post 22.81% CAGR as foundry scale keeps recipe evidence close to ramps. South Korea is anticipated to advance at 22.76% CAGR due to memory-line discipline. China is forecast to hold 22.64% CAGR as IC output increases domestic recipe-support needs. Japan is estimated to reach 22.58% CAGR owing to equipment know-how. Ireland is expected to post 22.54% CAGR through semiconductor policy and foreign investment.
How does the Recipe Drift Analytics Market break down by segment?
Statistical trace analysis leads at 36.0%; Etch leads at 29.0%.
Which Analytics Approach dominates?
Statistical trace analysis holds 36.0% share in 2026.
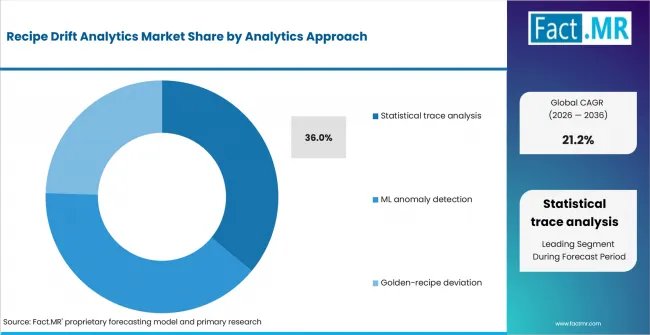
Recipe Drift Analytics Market Analysis By Analytics Approach | Source: Fact.MR
Statistical trace analysis is expected to lead Analytics Approach with 36.0% share in 2026 because fabs already rely on sensor curves, control limits and established FDC practices. SIA reported in February 2026 that global semiconductor sales reached a record USD 791.7 billion in 2025, up 25.6% from 2024, providing broad industry context for process-control requirements.
What leads the Tool Coverage segment?
Etch leads with 29.0% share in 2026.
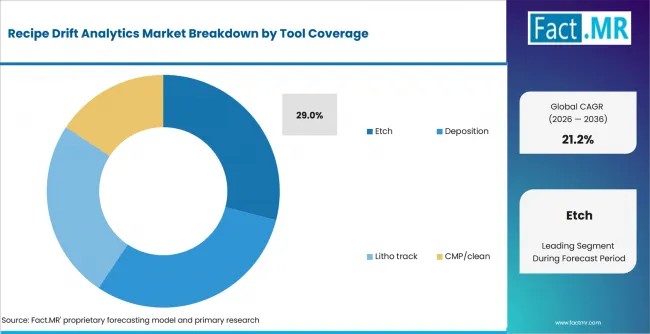
Recipe Drift Analytics Market Analysis By Tool Coverage | Source: Fact.MR
Etch is projected to lead Tool Coverage with 29.0% share in 2026 because plasma-step sensitivity makes profile drift and recipe variation costly. SEMI forecast wafer-fab-equipment sales of USD 143.9 billion in 2026, providing broader equipment-investment context for analytics used across advanced semiconductor process tools.
How does Deployment shape demand?
Edge/on-tool deployment leads with 44.0% share in 2026.
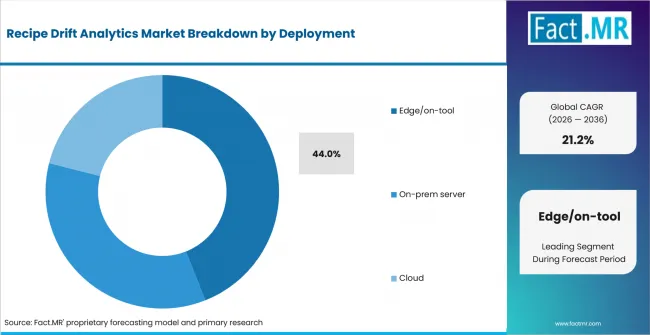
Recipe Drift Analytics Market Analysis By Deployment | Source: Fact.MR
Edge/on-tool deployment is anticipated to lead Deployment with 44.0% share in 2026 because recipe drift requires fast response close to the equipment controller. SEMI forecast total semiconductor manufacturing equipment sales of USD 165.9 billion in 2026, supporting the broader investment environment for process-control analytics adoption.
What supports Foundries within End User?
Foundries lead with 43.0% share in 2026.
Recipe Drift Analytics Market Analysis By End User | Source: Fact.MR
Foundries are estimated to lead End User with 43.0% share in 2026 because multiple customers and product families create greater recipe-change exposure. PDF Solutions announced Exensio Studio AI in October 2025, designed to integrate with Exensio manufacturing-data infrastructure and align FDC data with other semiconductor manufacturing and test data.
What is accelerating Recipe Drift Analytics Market adoption, and what is holding it back?
Recipe excursion control drives it; integration burden restrains it.
Drivers Impact Analysis
| DRIVER | (~) % IMPACT ON CAGR | GEOGRAPHIC RELEVANCE | IMPACT TIMELINE |
|---|---|---|---|
| Chamber-level drift detection | +4.8% | USA, Taiwan, South Korea | Short term (<= 2 years) |
| Edge analytics near tools | +3.9% | Foundry and memory clusters | Short term (<= 2 years) |
| FDC and trace-data integration | +3.2% | Global advanced fabs | Medium term (2-4 years) |
| Yield-loss avoidance | +2.6% | High-volume fabs | Medium term (2-4 years) |
| Recipe release discipline | +1.8% | USA, Japan, Ireland | Long term (>= 4 years) |
- Chamber-level drift detection: Cohu states that PAICe Maker continuously ingests process data and metrology and can retrain to correct for process drift and other process disturbances. This is direct technical evidence for chamber-level drift and recipe-tuning workflows.
- Edge analytics near tools: Fabs use edge deployment when response time is too short for remote analysis. The benefit is projected to rise as etch and deposition recipes tighten.
- FDC and trace-data integration: Drift tools gain value when they connect to fault detection and metrology data. MKS describes an automation platform with software modules for semiconductor process monitoring.
- Yield-loss avoidance: Late process-excursion detection can expose more in-process wafers before engineers isolate the affected tool or recipe. Semiconductor-sales growth should be treated as broad industry context rather than evidence of the technical or financial impact of recipe drift.
- Recipe release discipline: Approved recipes need proof that settings remain stable after maintenance and chamber matching. Drift analytics is forecast to help fabs keep release gates intact.
Opportunity Impact Analysis
| OPPORTUNITY | (~) % IMPACT ON CAGR | GEOGRAPHIC RELEVANCE | IMPACT TIMELINE |
|---|---|---|---|
| Golden-recipe libraries | +1.9% | Taiwan, South Korea, Japan | Medium term (2-4 years) |
| AI-assisted root cause review | +1.6% | USA and Ireland | Medium term (2-4 years) |
| Tool-maker embedded analytics | +1.2% | Etch and deposition suppliers | Long term (>= 4 years) |
| Multi-site recipe comparison | +0.9% | Global foundry networks | Long term (>= 4 years) |
- Golden-recipe libraries: Fabs are expected to build controlled baseline libraries for repeat processes. Simple baseline creation is likely to shorten deployment cycles.
- AI-assisted root cause review: INFICON launched Ask INFICON in March 2025 as an AI-powered product-support tool, debuting with full integration for FabGuard and plans to expand support to additional INFICON products.
- Tool-maker embedded analytics: Applied Materials’ current AIx platform provides real-time chamber analytics, recipe fingerprinting and AppliedPRO process-recipe optimization across Applied process equipment. This is closer evidence for embedded recipe and chamber analytics than a general fab-investment announcement.
- Multi-site recipe comparison: Large foundry groups need consistent recipes across fabs. Drift analytics is expected to support customer audits and faster line matching.
Restraints Impact Analysis
| RESTRAINT | (~) % IMPACT ON CAGR | GEOGRAPHIC RELEVANCE | IMPACT TIMELINE |
|---|---|---|---|
| Legacy data connectors | -1.7% | Global brownfield fabs | Short term (<= 2 years) |
| False alarm fatigue | -1.3% | High-mix fabs | Short term (<= 2 years) |
| Data-security review | -1.0% | USA, China, Taiwan | Medium term (2-4 years) |
| Engineer workflow resistance | -0.8% | Mature fabs | Medium term (2-4 years) |
- Legacy data connectors: Older tools often lack clean trace data or recipe context. Integration teams then spend more time mapping tags than tuning analytics.
- False alarm fatigue: A drift alert loses credibility when it does not match process risk. Poor tuning is expected to slow rollout where operators stop trusting noisy signals.
- Data-security review: Recipe files and tool traces are sensitive manufacturing assets. Export-control and restricted-entity requirements can add compliance review to cross-border deployment of semiconductor process-control technologies.
- Engineer workflow resistance: Process teams often rely on known review routines after maintenance. Adoption is forecast to be slower where alerts are not tied to disposition actions.
Which countries are scaling Recipe Drift Analytics Market fastest?
- The country comparison spans 0.49 percentage point and forms a tight growth band across the forecast period.
- The USA remains 0.22 percentage point above Taiwan as domestic fab awards and process-control validation support software spending.
- Taiwan remains 0.05 percentage point above South Korea because foundry scale keeps recipe controls close to pilot and volume lines.
- South Korea remains 0.12 percentage point above China as memory production raises the need for chamber-matching evidence.
- China remains 0.06 percentage point above Japan as integrated-circuit output expands demand for local analytics support.
- Japan remains 0.04 percentage point above Ireland due to equipment depth and established IC production.
- Ireland closes the displayed range through semiconductor policy support and specialized foreign-investment activity.
Comparable CAGRs create different entry conditions because recipe analytics depends on fab scale and tool connectivity. Coverage includes North America, Latin America, Europe, East Asia, South Asia and Pacific, Middle East and Africa. Unrelated backside power metrology and industrial metrology are outside the market unless their outputs are used directly in recipe-drift validation.
Example Country Growth Comparison Of Recipe Drift Analytics Market | Source: Fact.MR
| Country | CAGR (2026-2036) |
|---|---|
| USA | 23.03% |
| Taiwan | 22.81% |
| South Korea | 22.76% |
| China | 22.64% |
| Japan | 22.58% |
| Ireland | 22.54% |
What supports USA adoption?
23.03% CAGR, supported by fab awards and process-control validation.
USA growth is supported by major semiconductor investment and advanced packaging programs. NIST reported USD 1.4 billion in advanced-packaging awards and TSMC’s planned U.S. investment reaching USD 265 billion. Foundries and IDMs can use recipe-drift analytics as tools enter production, although milestone progress, data-security reviews and custom connectors for older equipment may slow deployment.
How is Taiwan scaling demand?
22.81% CAGR, led by foundry scale and pilot-line validation.
Taiwan’s growth reflects large foundry operations and expanding pilot-line activity. SEMI reported that Taiwan’s semiconductor equipment spending reached a record USD 31.5 billion in 2025, while Taiwan’s MOEA announced a NT$3.77 billion investment in the country’s first 12-inch advanced semiconductor pilot line. Foundries can apply drift analytics before customer-specific processes reach volume production, although export concentration, limited integration resources and confidentiality requirements may constrain wider deployment.
What supports South Korea adoption?
22.76% CAGR, driven by memory production and ICT export strength.
South Korea’s growth is supported by large memory production and strong semiconductor exports. MOTIR reported that South Korea’s semiconductor exports reached a record USD 173.4 billion in 2025, up 22.2% year over year, while MOTIR and MSIT reported that ICT exports reached USD 253.9 billion in the first half of 2026. Memory fabs can link drift alerts with chamber matching and maintenance, although validation complexity and security reviews may slow deployment.
How is China developing demand?
22.64% CAGR, backed by IC output and local process support.
China’s growth reflects expanding integrated-circuit production and demand for locally supported analytics. Integrated-circuit output reached 484.3 billion units in 2025 and increased 24.3% year over year in Q1 2026. Domestic fabs can compare golden-recipe deviations across expanding sites, although mixed tool fleets, data-normalization challenges and limited global support may complicate integration.
What supports Japan adoption?
22.58% CAGR, supported by equipment capability and IC production depth.
Japan’s growth is supported by semiconductor equipment depth and strong process-control expertise. SEMI reported that semiconductor equipment spending in Japan reached USD 9.5 billion in 2025, up 22% year over year, while SEAJ projected sales of Japanese-made semiconductor manufacturing equipment at JPY 6.55 trillion in fiscal 2026, up 26.0%. Suppliers can embed drift analytics into service packages, although conservative qualification practices and complex setup requirements may lengthen pilots.
What supports Ireland adoption?
22.54% CAGR, led by semiconductor policy and specialized FDI.
Ireland’s growth reflects semiconductor policy support and continued foreign investment. Ireland’s Silicon Island semiconductor strategy cited more than 130 indigenous and multinational semiconductor companies, while IDA Ireland reported that it secured a record 323 investments in 2025. Foreign-owned fabs can use recipe analytics within European semiconductor programs, although infrastructure constraints, talent competition and smaller cluster scale may keep deployment relatively specialized.
Who leads the Recipe Drift Analytics Market?
Cohu, through Tignis/PAICe, along with Applied Materials, INFICON and PDF Solutions, shows the clearest current public relevance to recipe-drift analytics and adjacent semiconductor process-control workflows.
Cohu’s Tignis/PAICe software has direct relevance through AI process control and process-drift/recipe-tuning functions. Applied Materials contributes AIx chamber analytics and recipe optimization. PDF Solutions, including Cimetrix connectivity products, provides process-control, FDC and equipment-connectivity capabilities. Recipe-drift use cases can occur in high-aspect cryoetch and cryogenic NAND etchers, but provider relevance here is based on software and process-control capabilities rather than those hardware markets.
Which companies are the key providers?
Key companies include Cohu (Tignis/PAICe), Applied Materials, INFICON and PDF Solutions (including Cimetrix).
- Cohu, Inc. (Tignis/PAICe)
- Applied Materials, Inc.
- INFICON
- PDF Solutions, Inc. (including Cimetrix)
Bibliography
- General Administration of Customs of the People’s Republic of China. (2026, January 8). China’s major imports by quantity and value, Dec 2025 (in USD).
- Central Statistics Office. (2026, February 17). Goods exports and imports December 2025.
- Cohu, Inc. (2025, January 7). Cohu completes acquisition of Tignis.
- U.S. Department of Commerce. (2026, July 16). Trump Administration secures an additional $100 billion U.S. semiconductor manufacturing investment for a total of $265 billion from TSMC.
- Department of Enterprise, Tourism and Employment. (2025, May 19). Ireland launches ‘Silicon Island’: A National Semiconductor Strategy.
- Directorate General of Budget, Accounting and Statistics, Executive Yuan, R.O.C. (2026, February 13). GDP: Preliminary estimate for 2025Q4, and outlook for 2026.
- Economic and Social Research Institute, Cabinet Office. (2026, April 15). Machinery orders in February, 2026.
- IDA Ireland. (2026, July 6). Annual Report 2025.
- INFICON. (2025, March 28). INFICON launches “Ask INFICON,” an AI-powered expert for FabGuard® and more.
- SEMI. (2026, April 7). SEMI reports global semiconductor equipment billings reached $135 billion in 2025, up 15% year-on-year.
- Ministry of Data and Statistics. (2026, January 30). Monthly industrial statistics, December 2025.
- Ministry of Economic Affairs. (2026, February 11). MOEA breaks ground on Advanced Semiconductor R&D Center: Taiwan’s first 12-inch pilot line to target AI, silicon photonics, and quantum technology.
- Statistics Department, Ministry of Finance. (2026, February 23). Annual External Trade Report in 2025.
- Ministry of Trade, Industry and Resources. (2026, January 2). Korea’s annual exports reach new highs in 2025.
- Ministry of Trade, Industry and Resources. (2026, July 14). Korea’s ICT exports reach record $253.9 billion in first half of 2026.
- U.S. Department of Commerce. (2025, January 16). U.S. Department of Commerce announces $1.4 billion in final awards to support the next generation of U.S. semiconductor advanced packaging.
This Report Addresses
- The report covers Recipe Drift Analytics Market across analytics approaches and tool-coverage choices.
- Segment analysis covers Statistical trace analysis and Etch as the 2026 share leaders within the market.
- Country outlook evaluates the USA and Taiwan alongside South Korea, China, Japan and Ireland.
- Competitive analysis profiles Cohu (Tignis/PAICe), Applied Materials, INFICON and PDF Solutions (including Cimetrix) without company share disclosure.
- Deployment assessment covers Edge/on-tool, On-prem server and Cloud models.
What does the Recipe Drift Analytics Market cover?
Recipe drift analytics covers software that compares recipe states and live tool traces with qualified baselines.
Coverage includes process analytics used around etch, deposition, litho track and clean steps. semiconductor robots interfaces are included only when wafer movement, tool state and recipe evidence are reviewed together as part of a recipe-drift workflow.
The market includes trace analytics, anomaly detection and golden-recipe comparison for release-window review.
What is included in the scope?
Included systems analyze recipe settings, sensor histories and process context around fabs that use downstream metrology to verify process quality. Adjacent chemical vapor deposition and wet process equipment are included only when their tool data is directly analyzed for recipe drift.
The scope includes edge, on-prem server and cloud deployment models for secure recipe-change review.
It also includes analytics for high-aspect etch and deep-memory flows that require strict chamber review.
What is excluded from the scope?
General dashboards are excluded when they do not compare tool behavior with a qualified recipe baseline. Generic MES, ERP and monitoring modules are excluded unless they detect recipe drift. E-Beam Wafer Inspection remains outside the market unless inspection outputs are used directly to validate a recipe-drift event. Finished devices and wafer revenue are also excluded.
How Was the Analysis Built?
The analysis draws on 120+ sources, 35+ company portfolios, 25+ countries, and 20+ industry interviews.
- Primary Research: Interviews cover semiconductor process engineers, fab teams, equipment providers, software vendors and procurement teams. Discussions examine deployment barriers and release evidence.
- Desk Research: Desk research covers government statistics, regulator publications, company filings, official announcements, industry associations and public policy.
- Market Sizing and Forecasting: Estimates combine historical values, demand indicators, segment shares, tool coverage, deployment patterns and country-level growth.
- Data Validation and Update Cycle: Findings are checked against public evidence, company activity, regulatory shifts and semiconductor investment. Updates review launches, partnerships and commercial adoption.
What is the report’s scope and coverage?
Recipe Drift Analytics Market Breakdown By Analytics Approach, Tool Coverage, And Region | Source: Fact.MR
| Attribute | Details |
|---|---|
| Quantitative Units | USD million in 2026 to USD million by 2036 at CAGR |
| Market Definition | Software and services that detect semiconductor recipe drift by comparing live tool traces, recipe states and process signals with qualified baselines |
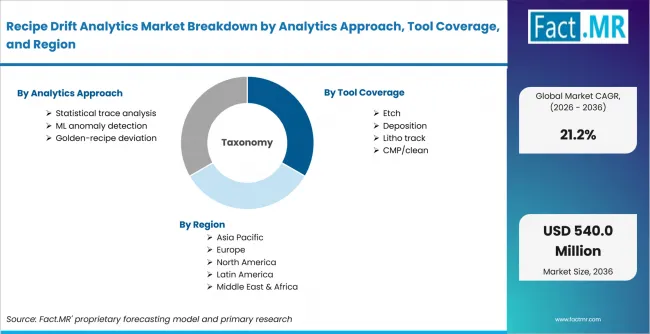
| Analytics Approach | Statistical trace analysis; ML anomaly detection; Golden-recipe deviation |
| Tool Coverage | Etch; Deposition; Litho track; CMP/clean |
| Deployment | Edge/on-tool; On-prem server; Cloud |
| End User | Foundries; Memory makers; Analog/specialty; Research fabs |
| Regions Covered | North America; Latin America; Europe; East Asia; South Asia and Pacific; Middle East and Africa |
| Countries Covered | USA; Taiwan; South Korea; China; Japan; Ireland |
| Key Companies Profiled | Cohu, Inc. (Tignis/PAICe); Applied Materials, Inc.; INFICON; PDF Solutions, Inc. (including Cimetrix) |
| Forecast Period | 2026 to 2036 |
| Approach | Hybrid top-down and bottom-up approach using fab process-control demand; trace-data availability; tool coverage; deployment models; end-user requirements; country adoption patterns and company portfolio review |
How is the market segmented?
-
By Analytics Approach:
- Statistical trace analysis
- ML anomaly detection
- Golden-recipe deviation
-
By Tool Coverage:
- Etch
- Deposition
- Litho track
- CMP/clean
-
By Deployment:
- Edge/on-tool
- On-prem server
- Cloud
-
By End User:
- Foundries
- Memory makers
- Analog/specialty
- Research fabs
-
By Region:
- North America
- Latin America
- Europe
- East Asia
- South Asia and Oceania
- Middle East and Africa