- Market Value (2025): USD 5376.1 Mn
- Estimated Value (2026): USD 6268.5 Mn
- Forecast Value (2036): USD 29117.2 Mn
- CAGR (2026-2036): 16.6%
What is the Revenue Operations Market forecast to be worth by 2036?
USD 6,268.5 million in 2026 to USD 29,117.2 million by 2036, at 16.6% CAGR.
- The revenue operations market crossed a valuation of USD 5,376.1 million in 2025 amid broader use of connected forecasting and workflow tools.
- Demand is projected to increase from USD 6,268.5 million in 2026 to USD 29,117.2 million by 2036 across integrated revenue workflows.
- The market is forecast to record a 16.6% CAGR from 2026 to 2036, supported by integration of workflow data across revenue teams.
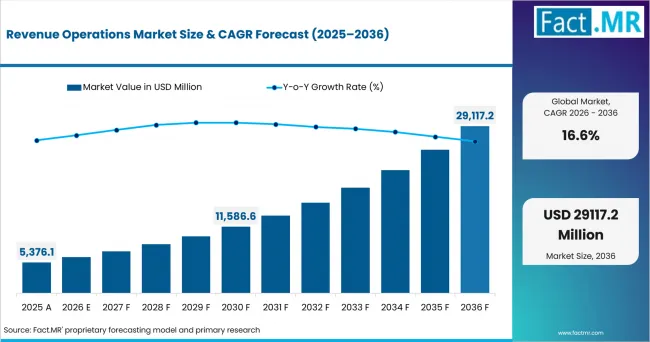
Revenue Operations Market Market Value Analysis | Source: Fact.MR
What are the defining numbers behind Revenue Operations Market growth?
USD 22,848.7 million absolute opportunity by 2036 is led by Software and Cloud alongside SME accounts.
- Demand Drivers in the Market
- Revenue operations leaders need unified pipeline records because forecast reviews often start from inconsistent CRM updates and scattered activity data.
- Sales operations teams need workflow automation due to frequent account changes that require controlled reassignment and approval within one operating rhythm.
- Commercial finance teams need auditable forecast changes shaped by board scrutiny and tighter links between bookings and renewal assumptions.
- Customer success operations need renewal visibility owing to disconnected handoffs between opportunity ownership and post-sale health records across enterprise systems.
- Key Segments Analyzed
- By Component: Software is expected to account for 51.7% share in 2026, supported by demand for common pipeline state and cross-team workflow control.
- By Deployment: Cloud is projected to account for 40.6% share in 2026, owing to distributed teams and recurring integration requirements.
- By Organization Size: SME accounts are anticipated to capture 50.3% share in 2026, shaped by preconfigured workflows and lighter administration needs.
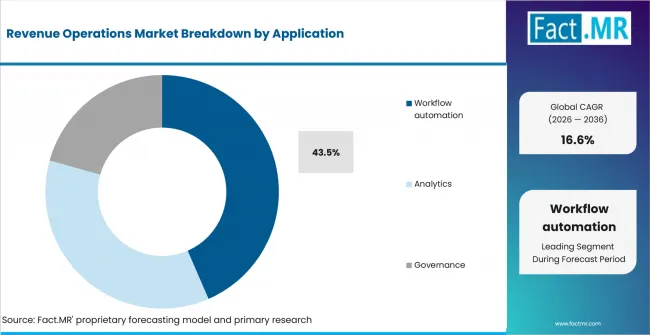
- By Application: Workflow automation is estimated to represent 43.5% share in 2026, attributable to recurring routing and approval tasks across revenue cycles.
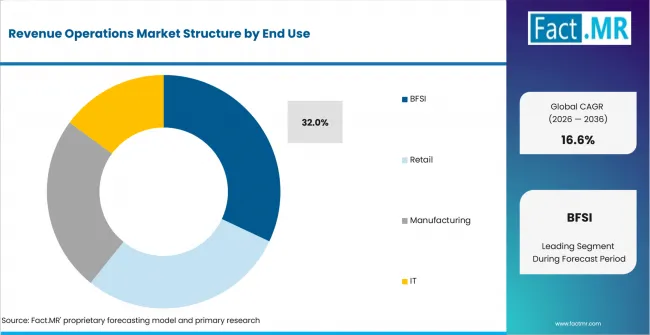
- By End Use: BFSI is forecast to account for 32.0% share in 2026, driven by controlled customer records and layered approval structures.
- Analyst Opinion at Fact.MR
- Shambhu Nath Jha, Fact.MR Senior Analyst states, “Revenue operations is becoming a control problem before it becomes an automation problem. Adoption is expected to favor platforms that preserve context across forecasts and workflow changes without hiding data lineage. Providers should combine clean integrations with revocable agent actions, while maintaining configurable approval controls across revenue workflows.”
- Strategic Implications
- Revenue operations leaders should map every forecast handoff before introducing agent actions across opportunity management and renewal workflows.
- Sales operations managers should separate system-of-record fields from derived signals before automating routing rules across account ownership changes.
- Commercial finance teams should require traceable forecast revisions that preserve the source event and approval history behind every material change.
- IT architecture teams should test integration failure paths before allowing autonomous actions to update CRM records or trigger external communications.
Gong introduced Gong Orchestrate and additional agent-based capabilities in October 2025, bringing account signals and workflow actions into its Revenue AI Operating System. The move reflects a wider shift toward platforms that connect observation with governed execution because fewer handoffs are expected to improve continuity across revenue teams.
India is expected to record an 18.4% CAGR between 2026 and 2036, driven by software-services delivery scale and expanding enterprise automation programs. China is projected to post a 17.7% CAGR during the forecast period, supported by software-industry expansion and wider enterprise digitization. Australia is anticipated to advance at a 16.4% CAGR by 2036, owing to rapid AI uptake across information-sector firms. The United Kingdom is estimated to record a 16.1% CAGR over the assessment period, shaped by widespread cloud adoption across business operations. The United States is forecast to post a 15.9% CAGR between 2026 and 2036, attributable to enterprise AI adoption and complex revenue workflows.
How does the Revenue Operations Market break down by segment?
Software accounts for 51.7% share in 2026, while SME leads with 50.3% share.
Which Component dominates?
Software accounts for 51.7% share in 2026
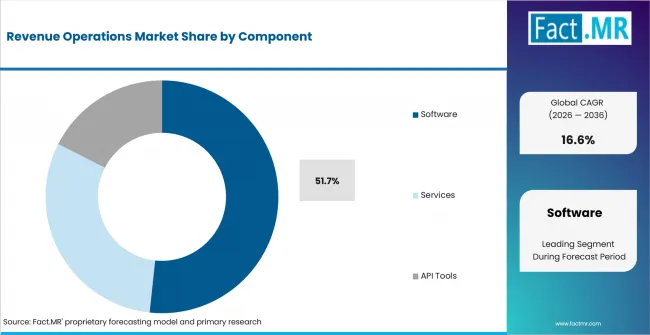
Revenue Operations Market Analysis By Component | Source: Fact.MR
Software is expected to account for 51.7% share in 2026, supported by demand for common revenue context across forecasting and workflow execution. Services remain relevant for integration design and operating-model changes during complex platform consolidation programs across enterprise revenue teams. API tools serve engineering-led accounts that retain custom workflow layers around CRM records and connected commercial applications. In January 2026 Eurostat data showed that 19.95% of EU enterprises used AI technologies during 2025. That adoption base expands integration work around revenue data and controlled automation across commercial systems.
Which Deployment model captures the significant share?
Cloud leads with 40.6% share in 2026
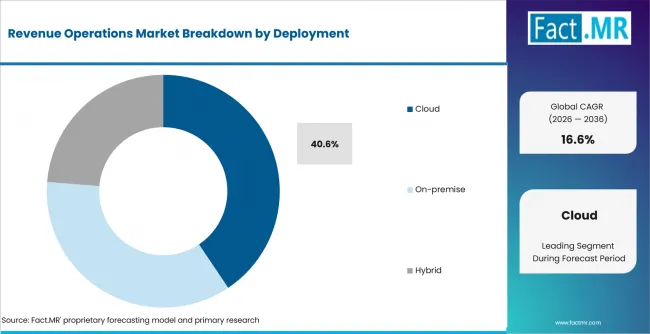
Revenue Operations Market Analysis By Deployment | Source: Fact.MR
Cloud is projected to account for 40.6% share in 2026, owing to distributed revenue teams and recurring integration requirements. On-premise deployment remains relevant where sensitive customer records require tighter infrastructure control and locally managed access policies. Hybrid deployment serves enterprises that separate core records from cloud workflow services during staged modernization. In January 2026 Eurostat data showed that 52.74% of EU enterprises purchased paid cloud computing services during 2025. That installed base gives RevOps teams a practical route for connecting revenue applications without rebuilding every underlying system.
How does Organization Size shape demand?
SME accounts for 50.3% share in 2026
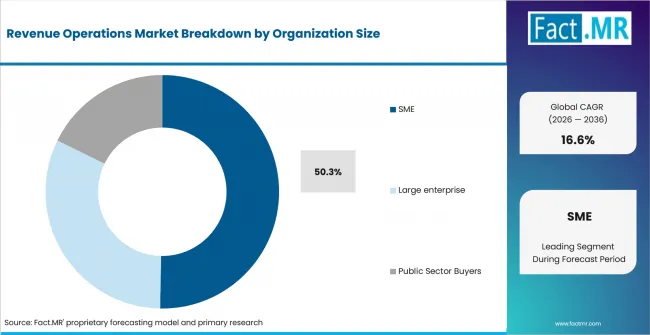
Revenue Operations Market Analysis By Organization Size | Source: Fact.MR
SME accounts are anticipated to capture 50.3% share in 2026, shaped by preconfigured workflows and lighter administration needs. Large enterprises require deeper governance and portfolio integration across regions that operate multiple commercial systems and distinct revenue processes. Public sector buyers remain selective where procurement controls and data handling rules extend implementation cycles. In January 2026 Eurostat data showed that 49.3% of small EU businesses purchased cloud computing services during 2025. Broader cloud access lowers the infrastructure barrier for smaller RevOps teams that need integrated execution without extensive platform engineering.
What supports Workflow Automation within Application?
Workflow hold 43.5% share in 2026
Revenue Operations Market Analysis By Application | Source: Fact.MR
Workflow Automation is estimated to represent 43.5% share in 2026, attributable to repeated routing and approval tasks across revenue cycles. Analytics follows where managers need common forecast signals and account prioritization logic across several commercial teams and systems. Governance applications support audit trails and controlled changes across shared revenue records that feed forecasting and account workflows. In January 2026 Eurostat data showed that 28.51% of EU enterprises used CRM applications during 2025. A broad CRM base creates many operational handoffs that revenue teams seek to standardize across forecasting and account execution.
Which End Use segment accounts for the notable share?
BFSI lead with 32.0% share in 2026
Revenue Operations Market Analysis By End Use | Source: Fact.MR
BFSI is forecast to account for 32.0% share in 2026, driven by controlled customer records and layered approval structures. Retail follows where high account volumes increase pressure on campaign and sales handoffs across customer acquisition and retention processes. Manufacturing accounts use RevOps platforms to coordinate complex channels and recurring service revenue across distributors and direct enterprise accounts. IT companies remain active users because subscription models require renewal and expansion visibility across recurring account management processes. In November 2024 the Bank of England reported that 75% of responding financial firms already used AI. Operational governance is expected to remain central while financial firms add more automated use cases.
What is accelerating Revenue Operations Market adoption, and what is holding it back?
Unified revenue data drives adoption across commercial teams, while integration cost restrains deployment across complex revenue technology stacks.
Drivers Impact Analysis
| Driver | (~) % Impact on CAGR | Geographic Relevance | Impact Timeline |
|---|---|---|---|
| Unified revenue data across commercial systems | +2.2% | North America and Europe | Medium term (2-4 years) |
| Workflow automation across go-to-market teams | +1.7% | Global | Medium term (2-4 years) |
| Agent-based account execution | +1.4% | United States and Australia | Short term (<= 2 years) |
| Cloud migration and integration programs | +1.1% | Europe and Asia Pacific | Medium term (2-4 years) |
| Forecast governance and auditability | +0.8% | North America and Europe | Long term (>= 4 years) |
Source: Fact.MR analysis. Updated Jul 8, 2026
- Unified revenue data: Commercial teams often maintain forecast context across CRM fields and activity systems that update at different speeds. Revenue platforms unify those signals into a working account state that operations teams use during forecasts and account reviews. In January 2026 Eurostat data showed that 53.47% of EU enterprises used ERP, CRM or BI software during 2025. Adoption is expected to favor platforms that connect records without obscuring their source history across operational updates and forecasts.
- Workflow automation: Revenue teams repeat routing and approval work across opportunities while ownership changes create additional manual checks. Automated workflows reduce operational delay when account state changes remain traceable and reversible across connected revenue applications and teams. In March 2025 Office for National Statistics research found that 91% of UK firms using AI also used cloud systems during 2023. Adoption is projected to expand where automation fits existing cloud operating environments and preserves established revenue process controls.
- Agent-based account execution: Revenue teams are testing agents that summarize account state and recommend actions before updating operational systems. Governance becomes central once automated recommendations trigger tasks or field changes across shared revenue records and account workflows. In May 2026 the U.S. Census Bureau reported that overall business AI use reached 20% near the upper end of the prior six-month survey range. Revenue agents are anticipated to gain ground where action permissions remain explicit across account stages and user roles.
- Cloud migration: Revenue stacks increasingly depend on connected CRM and planning tools that exchange account context across distributed teams. Cloud deployment simplifies access while raising integration design requirements around permissions and clear ownership of shared revenue data. In January 2026 Eurostat data showed that 84.67% of large EU enterprises purchased paid cloud services during 2025. Demand is estimated to expand where platform teams govern shared data across several commercial applications.
- Forecast governance: Finance and revenue leaders need forecast changes to preserve the source event and decision history behind material revisions. The requirement grows once automated recommendations influence pipeline calls and trigger actions across connected commercial systems and teams. In November 2024 the Bank of England and Financial Conduct Authority survey found that 84% of firms had an accountable individual for AI governance. Governance features are forecast to carry more weight in regulated enterprise evaluations that review automated actions and customer data handling.
Opportunity Impact Analysis
| Opportunity | (~) % Impact on CAGR | Geographic Relevance | Impact Timeline |
|---|---|---|---|
| Governed revenue agents for account execution | +1.2% | United States and Europe | Short term (<= 2 years) |
| Preconfigured RevOps systems for SME accounts | +0.9% | India and Asia Pacific | Medium term (2-4 years) |
| API-led stack consolidation | +0.7% | Global | Medium term (2-4 years) |
| Vertical workflow packs for regulated accounts | +0.6% | North America and Europe | Long term (>= 4 years) |
Source: Fact.MR analysis. Updated Jul 8, 2026
- Governed revenue agents: Enterprises are opening room for assistants that interpret account context before initiating approved workflow steps. The opportunity depends on permission boundaries and clear rollback paths that operations teams review before wider agent deployment. In June 2026 Australian Bureau of Statistics data showed that 12% of Australian businesses used AI during 2024-25. Platform demand is expected to rise while operations teams move from experimentation toward controlled execution.
- SME RevOps packages: Smaller teams often need fast deployment more than broad customization across several business units. Prebuilt workflows create an opportunity when onboarding preserves flexibility around account ownership rules and clearly defined commercial stages. In January 2026 India’s Ministry of Finance reported 13.5% average software-services export growth across the FY23-FY25 period. Providers are projected to gain from local implementation capacity that supports smaller accounts beyond initial deployment.
- API-led consolidation: Revenue teams need fewer handoffs between engagement systems and forecasting layers without forcing every process into one application. Open interfaces create room for orchestrated technology stacks that preserve tool choice across engagement and forecasting workflows. Revenue platforms are anticipated to benefit where online transaction scale raises the value of connected commercial workflows.
- Vertical workflow packs: Regulated accounts require predefined controls around approvals and customer record changes before broader automation receives operational clearance. Reusable workflow templates reduce design effort while preserving the review steps required before automated actions reach customer records. In May 2026 U.S. Census Bureau data placed seasonally adjusted first-quarter retail e-commerce sales at USD 326.7 billion across the United States. Vertical packages are estimated to expand where transaction scale creates recurring coordination work across commercial teams.
Restraints Impact Analysis
| Restraint | (~) % Impact on CAGR | Geographic Relevance | Impact Timeline |
|---|---|---|---|
| Data quality and revenue-record gaps | -1.4% | Global | Immediate |
| Integration cost and tool overlap | -1.0% | North America and Europe | Medium term (2-4 years) |
| Security and data residency controls | -0.8% | Europe and North America | Medium term (2-4 years) |
| Change management and skills gaps | -0.6% | Global | Long term (>= 4 years) |
Source: Fact.MR analysis. Updated Jul 8, 2026
- Data quality gaps: Revenue automation weakens when opportunity fields and activity records do not reflect the same commercial reality. Poor inputs create false precision across forecasts and prioritization models that depend on consistent stages and ownership records. In February 2026 UK government research reported that 23% of AI-using businesses cited data complexity as a barrier to wider adoption. Adoption is expected to remain uneven where operating discipline does not support clean workflows and consistent commercial record maintenance.
- Integration cost: Platform consolidation often exposes duplicate workflows and custom CRM objects that require redesign before migration. The cost burden rises when revenue applications hold conflicting definitions for commercial stages and account ownership across connected teams. In January 2026 Eurostat data showed that 30.67% of EU enterprises used cloud finance or accounting applications during 2025. Demand is projected to slow where integration scope extends beyond the RevOps team’s implementation capacity.
- Security controls: Revenue platforms touch customer records and communication histories that require access controls across several applications. Third-party model use adds review work around data exposure and action permissions across customer records and workflow execution layers. In November 2024 the Bank of England survey found that 33% of financial firms’ AI use cases were third-party implementations. Procurement is anticipated to remain selective where providers cannot document control boundaries across integrated systems and autonomous workflow actions.
- Change management: Workflow redesign changes ownership rules and review routines across teams that previously managed local processes. Training gaps often appear after configuration work finishes and users return to older workarounds across familiar commercial processes. In March 2025 Office for National Statistics research reported AI expertise and skills as a barrier for 16% of UK firms during 2023. Adoption is forecast to remain slower where process ownership is unclear after deployment and teams lack accountable workflow administrators.
Which countries are scaling Revenue Operations Market fastest?
India 18.4%; China 17.7%; Australia 16.4%; United Kingdom 16.1%; United States 15.9%; Germany 15.6%; Japan 15.3%
Revenue Operations Market is segmented into North America, Europe, Asia Pacific, Central & South America, and the Middle East & Africa.
| Country | CAGR |
|---|---|
| India | 18.4% |
| China | 17.7% |
| Australia | 16.4% |
| United Kingdom | 16.1% |
| United States | 15.9% |
| Germany | 15.6% |
| Japan | 15.3% |
Source: Fact.MR analysis. Updated Jul 8, 2026
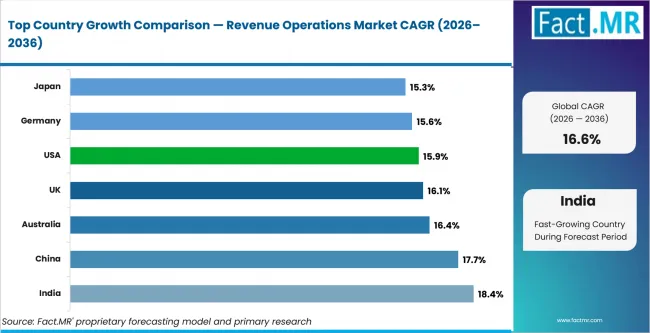
Revenue Operations Market Cagr Analysis By Country | Source: Fact.MR
What is powering India's expansion?
18.4% CAGR, driven by software-services delivery scale and expanding enterprise automation requirements across commercial operations.
India’s Revenue Operations opportunity is widening as its software-services base supports integration work across increasingly connected commercial systems. In March 2026 the Press Information Bureau reported services exports of USD 348.4 billion during April–January FY2025–26. The market is expected to record an 18.4% CAGR during 2026 to 2036, supported by demand for integrated commercial operations. Local delivery capacity gives providers a practical route for configuration and integration support across mid-sized enterprise accounts.
How is China scaling Revenue Operations demand?
17.7% CAGR, supported by software-industry expansion and wider enterprise workflow digitization across commercial operations.
China’s market is expanding as a fast-growing software sector gives enterprises a broader foundation for connecting revenue workflows across customer-facing systems. The State Council reported in January 2026 that software-industry revenue increased 13.2% during 2025. The market is projected to post a 17.7% CAGR during the forecast period, driven by software-sector expansion and enterprise automation needs. Providers can strengthen commercial access when workflow platforms connect customer acquisition processes with account management and performance oversight.
What supports the Australia outlook?
16.4% CAGR, owing to enterprise AI uptake and cloud adoption across information-intensive business operations.
Australia’s Revenue Operations market is gaining relevance as technology-intensive businesses adopt automation across increasingly connected commercial workflows. The Australian Bureau of Statistics reported that 38% of Information Media and Telecommunications businesses used AI during 2024–25. The market is anticipated to advance at a 16.4% CAGR between 2026 and 2036, owing to controlled workflow execution requirements. Operations teams are expected to prioritize systems that keep automated actions connected with clear account context and accountable ownership.
What underpins United Kingdom growth?
16.1% CAGR, supported by broad cloud-based operating systems and recurring commercial workflow integration requirements.
United Kingdom demand is strengthening because widespread cloud adoption gives commercial teams a practical foundation for connecting revenue processes across business functions. Office for National Statistics research reported that 69% of surveyed UK firms used cloud-based computing systems and applications during 2023. The market is estimated to record a 16.1% CAGR by 2036, shaped by cloud access and operating-model change. Revenue Operations Providers can improve enterprise access where enterprises need common workflow rules across sales and marketing systems.
How is the United States developing Revenue Operations demand?
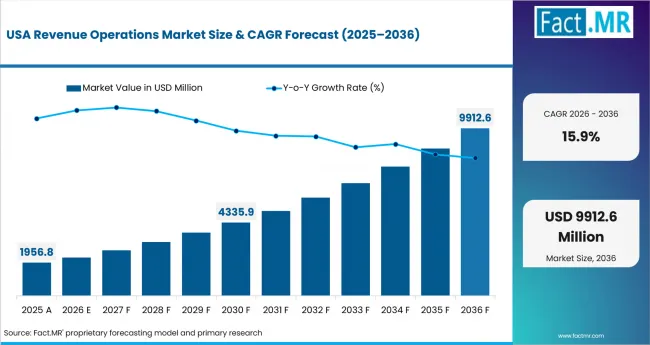
15.9% CAGR, attributable to enterprise AI adoption and complex workflow coordination across large commercial organizations.
Revenue Operations Market Country Value Analysis | Source: Fact.MR
United States demand is deepening as larger enterprises apply AI across business functions that require coordinated ownership and controlled workflow execution. U.S. Census Bureau reporting in May 2026 found that 37% of firms with at least 250 employees used AI in business operations. The market is forecast to post a 15.9% CAGR over the assessment period, attributable to large-enterprise workflow complexity and governance requirements. Providers gain relevance when automation tools preserve account context across decentralized teams and interconnected commercial systems.
Who leads the Revenue Operations Market?
Gong and Clari + Salesloft lead direct revenue orchestration coverage, while Outreach and 6sense strengthen workflow execution and account intelligence.
Gong competes around its Revenue AI Operating System that organizes customer interactions and commercial context for revenue teams. Clari and Salesloft completed their merger in December 2025 and now combine forecasting context with sales engagement workflows inside one organization. Outreach remains active in revenue orchestration and launched Omni in April 2026 to extend conversational agent execution across revenue work. These providers compete on context depth and governed task execution across customer-facing teams that share account ownership responsibilities.
6sense adds account intelligence and RevvyAI to go-to-market coordination while Salesforce connects RevOps with quote-to-cash processes inside Revenue Cloud. HubSpot targets scaling companies through connected CRM and operations tools across its customer platform and shared commercial data model. Xactly focuses on revenue planning and compensation workflows through its Intelligent Revenue Platform for commercial operations and finance teams. Competition during the forecast period is expected to be shaped by integration coverage and permission controls across shared data and workflow actions. Evidence quality across forecasts and agent actions is also expected to influence enterprise selection during technical and governance reviews.
Which companies are the key providers?
Gong, Clari + Salesloft, Outreach, 6sense, Salesforce, HubSpot, Xactly
- Gong,
- Clari + Salesloft
- Outreach
- 6sense
- Salesforce
- HubSpot
- Xactly
Bibliography
- Australian Bureau of Statistics. (2026, June 25). Characteristics of Australian business, 2024–25 financial year. Australian Bureau of Statistics.
- Bank of England and Financial Conduct Authority. (2024, November 21). Artificial intelligence in UK financial services 2024. Bank of England.
- Department for Science, Innovation and Technology. (2026, February 13). AI adoption research. GOV.UK.
- Eurostat. (2026, January). Cloud computing: Statistics on the use by enterprises. European Commission.
- Eurostat. (2026, January). Digital economy and society statistics: Enterprises. European Commission.
- Gong. (2025, October 21). Gong unveils new AI innovations to help revenue teams drive growth at scale. Gong.
- Government of India, Ministry of Finance. (2026, January 29). From stability to new frontiers, India’s services exports growth more than doubled from 7.6% in the pre-pandemic period to 14% during FY23–FY25. Press Information Bureau.
- Government of India. (2026, March 14). India’s services exports maintain strong momentum in FY2025–26. Press Information Bureau.
- Ministry of Economy, Trade and Industry. (2025, August 26). Results of FY2024 e-commerce market survey compiled. Government of Japan.
- Office for National Statistics. (2025, March 24). Management practices and the adoption of technology and artificial intelligence in UK firms: 2023. Office for National Statistics.
- Salesloft. (2025, December 3). Clari and Salesloft complete merger and appoint Steve Cox as CEO to build the first Predictive Revenue System. Salesloft.
- State Council of the People’s Republic of China. (2026, January 31). China’s software industry revenues surge 13.2% in 2025. Government of China.
- U.S. Census Bureau. (2026, May 18). Quarterly retail e-commerce sales report: First quarter 2026. U.S. Department of Commerce.
- U.S. Census Bureau. (2026, May 26). Large firms with at least 20 employees biggest AI users. U.S. Census Bureau.
- 6sense. (2025, November 12). 6sense introduces RevvyAI, turning the platform into an AI-powered GTM command center. 6sense.
- HubSpot. (2025, October 6). Introducing HubSpot’s Fall 2025 Spotlight. HubSpot.
- Outreach. (2026, April 27). Outreach April 2026 product release. Outreach.
- Salesforce. (2025, July 24). Under the hood of Revenue Cloud’s new architecture. Salesforce.
- Xactly. (2026, May 14). Xactly launches fleet of agents and Intelligence Studio for revenue planning and compensation. Xactly.
This Report Addresses
- The report provides strategic intelligence on Revenue Operations across Component and Deployment choices that shape commercial operating systems.
- Regional outlook evaluates India and China alongside Australia while the United Kingdom and United States complete the country comparison.
- Competitive analysis profiles Gong and Clari + Salesloft alongside Outreach and 6sense before reviewing Salesforce and two additional active providers.
- Component assessment covers Software and Services alongside API tools that support integration across revenue data and workflow layers.
- Application assessment covers Workflow Automation and Analytics alongside Governance use cases across sales operations and customer success processes.
What does the Revenue Operations Market cover?
Software and Services alongside API tools coordinate revenue workflows across forecasting and commercial operations within the defined market scope.
The Revenue Operations Market covers platforms and related services that unify commercial data across forecasting and workflow execution. Coverage includes software layers that coordinate sales operations with customer success processes while maintaining shared account context.
The market differs from general CRM software because commercial value comes from cross-functional orchestration and operating control. Standalone CRM applications and isolated marketing tools remain outside the boundary unless they perform a direct Revenue Operations workflow function.
What is included in the scope?
Revenue Operations systems used across forecasting and workflow automation alongside commercial governance processes within the defined market scope.
The scope includes Software and Services alongside API tools used across Cloud and On-premise environments. Hybrid deployment is included when shared Revenue Operations workflows span more than one hosting model. Coverage evaluates SME accounts and Large enterprise accounts across Workflow Automation and Analytics use cases. Governance applications are included when they control revenue records or workflow actions across shared commercial systems and operational processes. BFSI and Retail are covered alongside Manufacturing and IT accounts that use coordinated revenue workflows across commercial teams. Adjacent sales engagement software provides execution context for outbound workflows while marketing operations management informs cross-functional process coordination. Related predictive analytics software supports forecasting context used by RevOps teams across opportunity reviews and account prioritization workflows.
What is excluded from the scope?
Standalone CRM systems and isolated marketing automation tools remain outside the defined Revenue Operations Market scope unless direct orchestration functions apply.
The scope excludes standalone customer relationship management software when it only stores records without cross-functional Revenue Operations coordination. Pure advertising technology and isolated customer support ticketing are also excluded unless the product directly controls revenue workflows across commercial teams.
How was the analysis built?
120+ sources and 40+ company portfolios support analysis across 25+ countries alongside findings from 20+ industry interviews.
- Primary Research
- Primary research includes interviews with revenue operations leaders and sales operations managers across software and financial services accounts. It also covers commercial finance leaders and customer success operations teams that evaluate forecasting controls and workflow automation systems.
- Desk Research
- Desk research reviews official enterprise technology statistics and regulatory material alongside provider product portfolios and release notes. Company announcements and product documentation are evaluated to verify active capabilities and current competitive positioning.
- Market-Sizing and Forecasting
- Forecasting uses market values alongside platform adoption and cloud penetration indicators across business software environments. Models also consider workflow attachment rates and account-size mix across major end-use groups and country growth patterns.
- Data Validation and Update Cycle
- Forecasts are validated through provider checks and technical interviews that test assumptions on deployment preferences and workflow adoption. Portfolio mapping and country evidence reviews support periodic updates to market direction and competitive relevance.
Segmentation
What is the report’s scope and coverage?
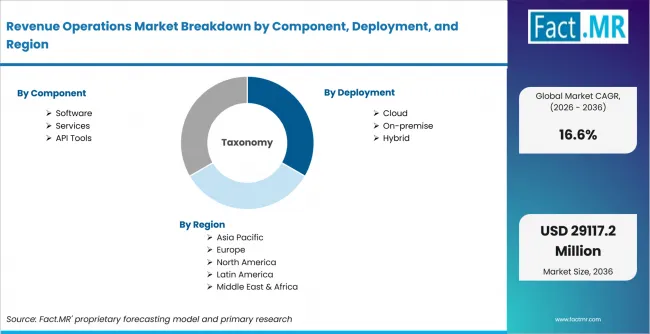
Revenue Operations Market Breakdown By Component, Deployment, And Region | Source: Fact.MR
| Attribute | Details |
|---|---|
| Quantitative Units | USD million |
| Market Definition | Revenue operations platforms and related services that unify commercial data and coordinate forecasting, workflow execution, and governance across revenue teams. |
| Component | Software; Services; API Tools |
| Deployment | Cloud; On-premise; Hybrid |
| Organization Size | SME Accounts; Large Enterprises; Public Sector Buyers |
| Application | Workflow Automation; Analytics; Governance |
| End Use | BFSI; Retail; Manufacturing; IT |
| Regions Covered | North America; Europe; Asia Pacific; Latin America; Middle East and Africa |
| Countries Covered | India; China; Australia; United Kingdom; United States |
| Key Companies Profiled | Gong; Clari + Salesloft; Outreach; 6sense; Salesforce; HubSpot; Xactly |
| Forecast Period | 2026 to 2036 |
| Approach | Hybrid top-down and bottom-up approach using enterprise technology adoption; cloud penetration; workflow attachment rates; organization-size mix; end-use demand; country growth patterns and provider validation. |
Source: Fact.MR analysis. Updated Jul 8, 2026
How is the market segmented?
-
By Component :
- Software
- Services
- API Tools
-
By Deployment :
- Cloud
- On-premise
- Hybrid
-
By Organization Size :
- SME Accounts
- Large Enterprises
- Public Sector Buyers
-
By Application :
- Workflow Automation
- Analytics
- Governance
-
By End Use :
- BFSI
- Retail
- Manufacturing
- IT
-
By Region :
- North America
- United States
- Canada
- Europe
- United Kingdom
- Germany
- France
- Italy
- Spain
- Asia Pacific
- India
- China
- Japan
- South Korea
- Australia
- Latin America
- Brazil
- Argentina
- Mexico
- Chile
- Middle East and Africa
- UAE
- Saudi Arabia
- South Africa
- North America
Frequently Asked Questions
What share is Software projected to capture within Component?
How much of Deployment is Cloud expected to capture?
What share are SME accounts estimated to represent?
What proportion of Application demand is tied to Workflow Automation?
How much of End Use demand is BFSI expected to represent?
Which country is projected to post the fastest CAGR?
What CAGR is projected for China?
What CAGR is projected for Australia?
What CAGR is estimated for the United Kingdom?
What CAGR is forecast for the United States?
What factor is estimated to drive adoption most strongly?
Which restraint is expected to weigh most on deployment?
Why is Workflow Automation expected to remain important?
Why are SME accounts projected to represent half of demand?
Who worked on this report


Preview the report firsthand - request a free sample
Free SampleGet the brochure for pricing and purchase details
Download PDF