


- Base Value(2025): 5.9 Bn
- Forecast Value (2035): 8.2 Bn
- CAGR (2035): %
Rubber Processing Chemicals Market Outlook from 2025 to 2035
The global rubber processing chemicals market is projected to increase from USD 5.9 billion in 2025 to USD 8.2 billion by 2035, with an annual growth rate of 3.3%. This expansion is underpinned by sustained demand from the automotive and tire manufacturing sectors, which continue to be the primary end-users of rubber additives, such as accelerators, antioxidants, and antiozonants. Rising vehicle production in emerging economies, such as India, Indonesia, and Brazil, is contributing to market traction.
Additionally, the demand for heat-resistant and high-durability rubber compounds in industrial and heavy-duty applications is reinforcing the need for specialized chemical formulations. Regulatory shifts in Europe and North America are also pushing the development of low-toxicity and environmentally compliant alternatives to conventional processing agents. For instance, the gradual phase-out of harmful substances such as nitrosamines and polycyclic aromatic hydrocarbons (PAHs) is encouraging chemical producers to innovate safer alternatives without compromising performance.
What are the Drivers of the Rubber Processing Chemicals Market?
The rubber processing chemicals market is primarily driven by the continued expansion of the global automotive industry, which remains the largest consumer of rubber products, especially tires. According to the International Organization of Motor Vehicle Manufacturers (OICA), global vehicle production exceeded 93 million units in 2023, driving demand for performance-enhancing chemicals such as accelerators, antidegradants, and vulcanizing agents. These additives improve the durability, elasticity, and resistance of rubber components under extreme conditions.
Another key growth driver is the increasing need for high-performance rubber in industrial applications, including conveyor belts, hoses, seals, and gaskets used in construction, oil & gas, and manufacturing. These sectors demand rubber compounds that can withstand abrasion, heat, chemicals, and mechanical stress-needs that are met through tailored chemical formulations.
Environmental and regulatory factors are also playing a role. Stricter emission norms and workplace safety regulations in regions like the European Union and North America are prompting the shift toward safer, non-toxic, and low-VOC chemical alternatives. For example, manufacturers are phasing out nitrosamine-generating substances and replacing them with environmentally compliant solutions to meet REACH and EPA standards.
Furthermore, growth in electric vehicles (EVs) and lightweight automotive design is increasing the use of specialized rubber grades that demand precise chemical engineering for reduced rolling resistance and improved thermal management. This trend is further intensifying the demand for advanced rubber processing technologies.
What are the Regional Trends of the Rubber Processing Chemicals Market?
The regional dynamics of the rubber processing chemicals market are influenced by varying levels of industrial activity, regulatory landscapes, and demand from key end-use sectors, including automotive, construction, and manufacturing.
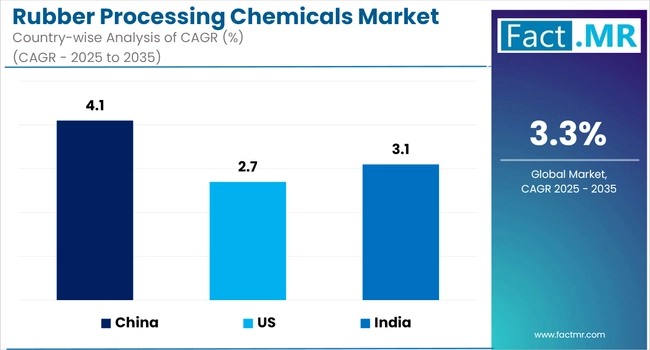
Asia Pacific remains the dominant region, accounting for the bulk of global demand. Countries such as China, India, Japan, and South Korea are leading consumers, driven by their extensive automotive and tire production capabilities. For instance, China alone produced over 26 million vehicles in 2023, according to OICA, supporting strong demand for rubber additives such as accelerators, antioxidants, and curing agents. India’s growing manufacturing sector, bolstered by government initiatives such as ‘Make in India,’ is also driving the use of rubber chemicals across both tire and non-tire segments, as well as in infrastructure and industrial applications.
North America maintains a strong demand, largely driven by the United States’ well-established automotive and construction sectors. The focus on sustainability and occupational safety standards enforced by the EPA and OSHA has prompted the regional market to gradually transition toward environmentally safer formulations, including low-toxicity and non-nitrosamine rubber additives. Additionally, the region’s investment in electric vehicle (EV) production is stimulating demand for high-performance rubber components that require specialized chemical processing.
In Europe, the market is shaped by stringent regulatory frameworks, such as REACH, which restrict the use of hazardous substances in the rubber manufacturing industry. Countries like Germany and France are leading the adoption of green alternatives, with increasing investment in the research and development of bio-based rubber processing chemicals. European tire manufacturers are also incorporating advanced and sustainable rubber formulations to meet the evolving vehicle emission and safety standards.
Latin America shows moderate growth potential, driven by expansion in the automotive and mining sectors in Brazil and Mexico. However, the market is constrained by limited domestic production capacity and reliance on imported chemicals and technologies.
In the Middle East and Africa, demand is gradually increasing, supported by infrastructure projects, construction growth, and the region’s efforts to diversify beyond oil. The UAE and Saudi Arabia are investing in localized manufacturing, which includes facilities for industrial rubber products used in pipelines, construction equipment, and transportation.
What are the Challenges and Restraining Factors of the Rubber Processing Chemicals Market?
The rubber processing chemicals market is navigating a complex landscape shaped by regulatory pressure, raw material volatility, and growing sustainability demands, all of which are acting as key restraints to long-term growth.
One of the primary challenges is increasing regulatory scrutiny in North America and Europe. Agencies such as the European Chemicals Agency (ECHA) under REACH have restricted the use of widely-used rubber additives, including certain nitrosamines, phthalates, and PAHs (polycyclic aromatic hydrocarbons) due to their toxicological risks. These regulatory pressures have forced manufacturers to either reformulate existing products or phase out certain compounds entirely, leading to increased R&D costs and time-to-market delays.
The volatility in prices and supply of petrochemical-based raw materials such as aniline, styrene, and butadiene is another restraint. These inputs are largely derived from crude oil, and their pricing is affected by global supply chain disruptions, geopolitical instability, and fluctuations in energy markets. Such unpredictability hampers procurement strategies and erodes profit margins, especially for small and mid-sized players with limited bargaining power.
Moreover, the growing demand for bio-based and green alternatives, while opening new opportunities, has also disrupted established supply chains. Manufacturers face difficulties in sourcing bio-based feedstocks in sufficient quantity and quality, and customer reluctance toward higher costs associated with green chemistry remains a barrier.
Finally, technological limitations in regions with underdeveloped manufacturing infrastructure, especially parts of Latin America, Africa, and Southeast Asia, slow down the pace of innovation adoption, limiting the global harmonization of safer, high-performance rubber processing technologies.
Country-Wise Outlook
USA Rubber Processing Chemicals Market Driven by Regulatory Shifts and Demand from Auto and Industrial Sectors
The United States rubber processing chemicals market is expanding, led by growing demand in the automotive, industrial, and consumer goods sectors. Rising vehicle production, especially for specialty tires and electric vehicles, has increased the need for high-performance additives that enhance tire durability and fuel efficiency. In packaging and construction, manufacturers are also relying on advanced rubber formulations to improve flexibility, strength, and resistance to environmental stress.
Regulatory priorities related to sustainability and health are also shaping the market. The USA Environmental Protection Agency (EPA) and Occupational Safety and Health Administration (OSHA) have implemented stricter standards on chemical usage and workplace exposure, prompting companies to develop cleaner, low-emission alternatives. This is driving investments in green chemistries such as bio-based accelerators and sulfur-free cure systems that meet performance requirements without compromising safety or compliance.
Additionally, fluctuating prices for feedstock chemicals, such as butadiene and phenol, are influencing sourcing decisions and prompting producers to optimize formulations for cost-effective performance. As manufacturers balance regulatory compliance, cost constraints, and product innovation, the USA market continues to mature toward safer and more efficient rubber processing solutions.
China Witnesses Rapid Expansion in Rubber Processing Chemicals Market on the Back of Automotive and Industrial Growth
China's rubber processing chemicals market is experiencing accelerated growth, primarily due to the country's dominance in global automotive manufacturing and its expanding industrial base. As the world’s largest producer and consumer of automotive tires, China accounts for a significant share of global rubber demand, driving consistent consumption of accelerators, antioxidants, and processing aids.
Leading domestic manufacturers, such as Sailun, Zhongce Rubber, and Triangle Tire, are ramping up production of high-performance and electric vehicle-compatible tires, thereby increasing the demand for specialized chemical formulations.
In parallel, China’s ongoing infrastructure development and urbanization continue to support the demand for industrial rubber products used in construction machinery, rail transport, and power generation. The shift toward green and high-efficiency production methods is also evident, with government mandates encouraging the adoption of low-VOC, REACH-compliant chemicals.
Additionally, China's focus on expanding its electric vehicle (EV) ecosystem has contributed to rising demand for heat- and wear-resistant rubber components, especially in battery insulation, sealing systems, and flexible electronics. As environmental and safety regulations tighten domestically, manufacturers are investing in sustainable and safer rubber additives, including nitrosamine-free accelerators and bio-based plasticizers, to meet new standards while maintaining performance and cost efficiency.
Japan Sees Steady Growth in Rubber Processing Chemicals Market Fueled by Innovation and Regulatory Alignment
Japan’s rubber processing chemicals market is advancing steadily, supported by its high-tech automotive sector and strong regulations on material quality. Domestic tire manufacturers, such as Bridgestone and Yokohama, are increasingly utilizing advanced accelerators and antioxidants to meet the performance demands of electric and hybrid vehicles, where enhanced durability and thermal resistance are crucial. This trend is underpinned by Japan’s commitment to energy efficiency and emissions reduction.
Simultaneously, investment in industrial machinery and precision components is driving increased demand for specialty rubber chemicals, especially those designed for low-volatility and high-purity applications. Japanese chemical companies are expanding R&D efforts to develop eco-friendly additives, including halogen-free accelerators and bio-based plasticizers, to meet both domestic and international environmental standards.
Moreover, Japan's focus on advanced manufacturing and robotics necessitates rubber materials with properties such as consistent elasticity and resistance to aging. In response, additive producers are collaborating with OEMs and research institutions to formulate tailored chemical solutions. These efforts, combined with tightening global compliance standards, are pushing Japanese manufacturers to innovate and differentiate their product offerings.
Category-wise Analysis
Anti-Degradants to Exhibit Leading Share Among Products
Anti-degradants are projected to maintain a leading share within the rubber processing chemicals market, owing to their critical role in enhancing the durability and performance of rubber products. These chemicals are extensively used to protect rubber compounds from degradation caused by oxygen, ozone, heat, and flex cracking, which are common in automotive tires, industrial belts, and sealing systems.
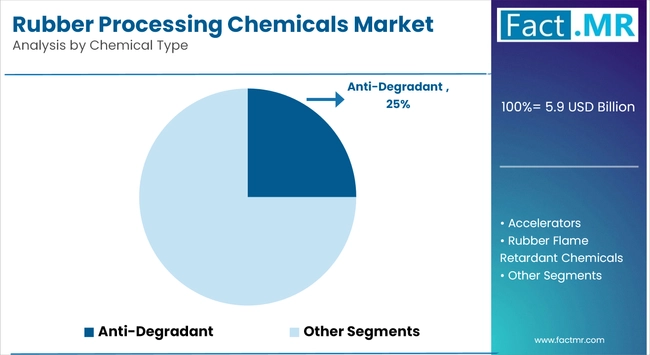
Their prominence is especially notable in the automotive sector, where long-lasting, high-performance rubber components are essential. For instance, in tire manufacturing, one of the largest application areas, anti-degradants such as aromatic amines and hindered phenols play a key role in improving product lifespan, reducing cracking, and ensuring structural integrity under variable stress conditions.
The growing demand for electric vehicles (EVs) is further accelerating the use of high-quality anti-degradants. EV tires must endure greater torque and lower rolling resistance, requiring enhanced chemical stability. Additionally, regions such as Europe and Japan, which enforce strict environmental and safety regulations, are encouraging manufacturers to adopt advanced, non-staining, low-VOC anti-degradants.
Tire Applications to Exhibit Leading Share Among Applications
Tire manufacturing remains the largest segment of the rubber processing chemicals market, driven by sustained growth in the global automotive industry and increasing demand for performance-enhancing additives. Tires require a complex mix of chemical agents, including accelerators, anti-degradants, curing agents, and processing aids to ensure durability, wear resistance, and grip across a range of operating conditions.
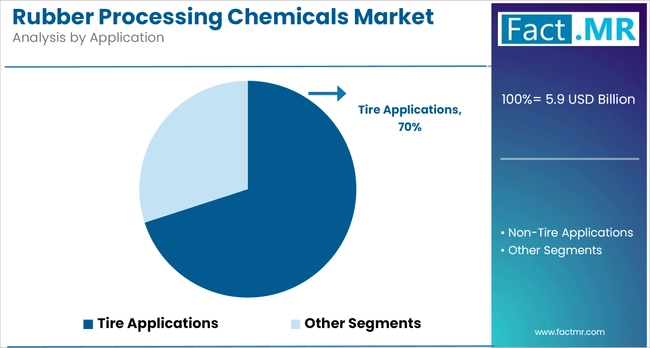
The sheer volume of tire production underpins this dominance. According to the International Rubber Study Group (IRSG), global tire production exceeded 2.4 billion units in 2023, with the Asia-Pacific region accounting for over 60% of the total. This growth is further supported by motorization in countries like India, China, and Indonesia, along with rising replacement demand in mature markets like the United States and Europe.
Moreover, regulatory pressure to phase out hazardous substances, such as polyaromatic hydrocarbons (PAHs) and nitrosamines, is pushing manufacturers to invest in safer, sustainable formulations. These innovations, combined with ongoing research and development in synthetic rubber blends, ensure that tire applications will continue to drive demand for rubber processing chemicals through 2035.
Asia Pacific Holds Leading Share in Rubber Processing Chemicals Market
The Asia Pacific region holds the largest share of the global rubber processing chemicals market, primarily due to its dominance in tire and rubber goods manufacturing. Countries like China, India, Japan, South Korea, and Thailand have established themselves as major hubs for both automotive production and rubber processing, driving demand for processing chemicals across various industrial segments.
China leads global tire production, accounting for than 40% of the world’s output, supported by its vast manufacturing infrastructure and rising vehicle ownership. Similarly, India is witnessing growth in its automotive and infrastructure sectors, boosting the need for rubber chemicals in applications like tires, belts, hoses, and seals. According to the Automotive Tyre Manufacturers’ Association (ATMA), India's tire industry has seen consistent growth, with production volumes crossing 190 million units in 2023.
Japan and South Korea, with their advanced automotive and electronics sectors, focus on high-performance rubber compounds, demanding precise chemical formulations for durability, flexibility, and thermal stability. In Southeast Asia, Thailand and Indonesia benefit from an abundant natural rubber supply, making them key contributors to regional exports of rubber goods and increasing consumption of accelerators, anti-degradants, and curing agents.
Moreover, regional governments are supporting industrial development through infrastructure investment and favorable manufacturing policies, further fueling market growth. With a strong base of both raw material availability and end-user industries, Asia Pacific is expected to remain at the forefront of global demand for rubber processing chemicals through the forecast period.
Competitive Analysis

A competitive mix of global chemical powerhouses and specialized regional players defines the rubber processing chemicals market. Leading companies such as BASF SE, Arkema Group, and LANXESS AG continue to set industry benchmarks through extensive R&D, broad product portfolios, and investments in sustainable chemistry. These firms focus on high-performance additives, such as anti-degradants and accelerators, that meet the evolving regulatory and performance demands in sectors including automotive, industrial manufacturing, and consumer goods.
Key players, such as SINOPEC and Sinochem Group, dominate the Asia Pacific rubber processing chemicals market through vertical integration and large-scale manufacturing, ensuring a stable raw material supply across the region. Mid-sized firms like Behn Meyer, Emery Oleochemicals, and Emerald Kalama focus on eco-friendly innovations, offering bio-based plasticizers and specialty processing aids.
Kumho Petrochemical and Merchem lead in producing high-volume antioxidants and vulcanization agents, while Eastman Chemical targets sustainable, high-performance additives. Collectively, these companies drive market growth through a mix of scale, innovation, and regional specialization.
The competitive dynamics of the market are increasingly shaped by stricter environmental regulations, shifting customer expectations for cleaner formulations, and growing demand for high-performance materials in electric vehicles and green infrastructure projects. Companies that combine innovation with operational flexibility are better positioned to capture emerging growth opportunities.
Recent Development
- In September 2024, BASF introduced Thermoplastic PU systems, including Elastopan, Elastollan (TPU), and Infinergy Revolution, designed for recyclable footwear applications, thereby enabling circular economy initiatives in the footwear sector.
- In early 2024, China Petroleum & Chemical Corporation (Sinopec) commissioned a new copolymer plant in Hainan with an annual capacity of 170,000 tonnes of SEBS/SBS, thereby strengthening its position in the rubber additives market.
Segmentation of Rubber Processing Chemicals Market
By Product :
- Anti-Degradant
- Accelerators
- Rubber Flame Retardant Chemicals
- Aids/Promoters
- Others
By Application :
- Tire Applications
- Non-Tire Applications
By Region :
- North America
- Latin America
- Europe
- East Asia
- South Asia
- Oceania
- Middle East & Africa
- Frequently Asked Questions -
What is the Global Rubber Processing Chemicals Market Size in 2025?
The rubber processing chemicals market is valued at USD 5.9 billion in 2025.
Who are the Major Players Operating in the Rubber Processing Chemicals Market?
Prominent players in the rubber processing chemicals market include Behn Meyer Holding AG, China Petroleum & Chemical Corporation (SINOPEC), Eastman Chemical Company, Emerald Kalama Chemical LLC, and others.
What is the Estimated Valuation of the Rubber Processing Chemicals Market by 2035?
The rubber processing chemicals market is expected to reach a valuation of USD 8.2 billion by 2035.
What Value CAGR Did the Rubber Processing Chemicals Market Exhibit over the Last Five Years?
The historic growth rate of the rubber processing chemicals market was 2.20% from 2020 to 2024.