- Market Value (2025): USD 2.48 Bn
- Estimated Value (2026): USD 2.84 Bn
- Forecast Value (2036): USD 10.8 Bn
- CAGR (2026-2036): 14.3%
What is the Smart Electric Drive Market forecast to be worth by 2036?
USD 2.8 billion in 2026 to USD 10.8 billion by 2036 at a 14.3% CAGR.
- The smart electric drive market was valued at USD 2.48 billion in 2025, with battery packs for passenger car platforms making up most of that revenue.
- Revenue will rise from USD 2.84 billion in 2026 to USD 10.8 billion by 2036 as automakers consolidate more models on shared electric drive architectures.
- A 14.3% CAGR from 2026 to 2036 will follow from lower cell prices, which let drive systems reach smaller cars and lower price points.
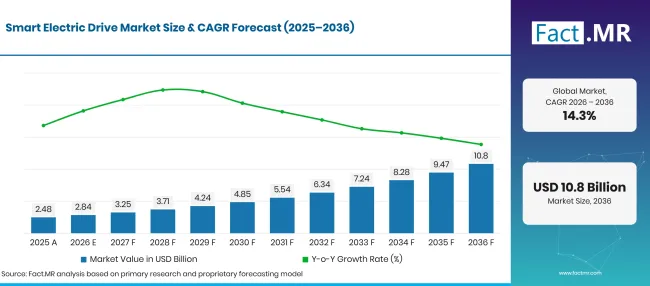
Smart Electric Drive Market Forecast Global | Source: Fact.MR
| Year | Basis | Market Value (USD billion) |
|---|---|---|
| 2025 | Actual | 2.48 |
| 2026 | Estimate | 2.84 |
| 2036 | Forecast | 10.8 |
| CAGR 2026 to 2036 | Forecast period | 14.3% |
Source: Fact.MR analysis. Updated Oct 23, 2026
What are the defining numbers behind Smart Electric Drive Market growth?
The decade to 2036 adds USD 8.0 billion in new value, most of it from battery-led drive systems in passenger cars.
- Demand Drivers in the Market
- Electric car volumes keep widening the base for drive systems. The International Energy Agency reported that electric car sales grew by 20% in 2025 to exceed 20 million units, lifting their share of the global car market to 25% [1]. Each of those vehicles needs a traction motor, an inverter and a battery pack sized to its platform.
- Cheaper cells free budget for better motors and control electronics. Average battery prices declined by 8% in 2025 on manufacturing gains, according to the IEA [2]. Automakers can use that margin to fund silicon carbide inverters, oil-cooled motors and drive software within the same vehicle price.
- Fleet buyers want drive data they can act on. In June 2026, ZF said its AxTrax 2 LF electric portal axle for city buses is available with an optional health check service that analyzes e-drive data remotely for early fault detection [3]. Remote diagnostics turn a drive unit into a source of uptime and lower operating cost for transit operators.
- Integrated three-in-one units cut parts count. Combining the motor, gearbox and inverter in one housing shortens cable runs, reduces weight and simplifies assembly on the vehicle line.
- Key Segments Analyzed
- By Component: Battery will command 38.4% share in 2026, since pack cost and capacity decide range and much of the vehicle bill of materials.
- By Application: Passenger Vehicles will account for 61.7% share in 2026 on the strength of electric car launches across compact, family and premium classes.
- By Drive Type: Front Wheel Drive will capture 42.3% share in 2026, given that a single front drive unit keeps packaging simple on small and mid-size platforms.
- By Charging Type: Plug-in Charging will hold 87.4% share in 2026 through its fit with the home, workplace and public chargers drivers already use.
- Analyst Opinion at Fact.MR
- Shambhu Nath Jha, Principal Consultant at Fact.MR, states, “Automakers now judge an electric drive by system efficiency per kilowatt-hour, and that favors suppliers who tune the motor, inverter and software together. Cheaper cells will widen the vehicle range that can carry these drives, but policy swings in the United States and Europe will keep sourcing cautious. Suppliers with one scalable drive family across several power classes will win the longer programs.”
- Strategic Implications
- Drive system suppliers should build modular motor and inverter families that one automaker can deploy from a city car to a large SUV without new validation for every model.
- Battery makers should widen lithium iron phosphate offerings, since LFP cells made up over 55% of EV batteries deployed globally in 2025 [2].
- Automakers should plan drive programs that can absorb policy change, as the European Commission has proposed easing the 2035 CO2 target for new cars and vans from 100% to 90%, with remaining emissions offset [4].
- Commercial vehicle suppliers should pair drive units with remote monitoring and service contracts, given that bus and van operators buy on uptime and predictable maintenance cost.
At 18.0% CAGR, the United States will lead the group as electric sales rebuild from a reduced base after federal purchase credits ended. The United Kingdom follows at 16.9%, where a zero emission vehicle mandate and a buyer grant keep car makers pushing electric models. Brazil will post 16.0% on rising electric car sales and a push for local vehicle assembly. Japan advances at 13.8% as a larger national subsidy works against a very low starting share. Germany trails at 11.9% because its electric car base is already large and new buyers depend on an income-linked grant.
How does the Smart Electric Drive Market break down by segment?
Battery will lead Component at 38.4%; Passenger Vehicles will head Application at 61.7%; Front Wheel Drive will top Drive Type at 42.3%; Plug-in Charging will take first place in Charging Type at 87.4%.
Which Component leads?
Battery represents 38.4% of 2026 sales.
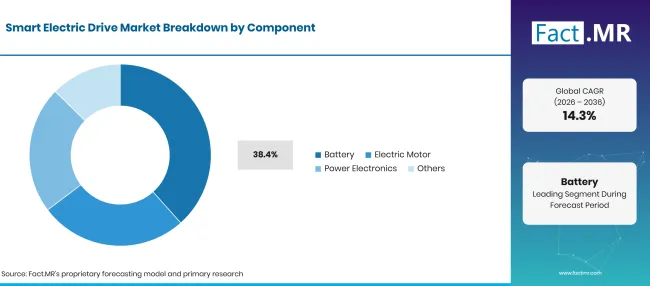
Smart Electric Drive Market Breakdown Component | Source: Fact.MR
| Component | Share (2026) |
|---|---|
| Battery (Leading segment) | 38.4% |
| Other segments combined | 61.6%* |
| Total | 100.0% |
Source: Fact.MR analysis. Updated Oct 23, 2026
The battery pack sets driving range, charging speed and a large slice of vehicle cost, so it draws the most procurement attention. Automakers now pick cell chemistry per model, using LFP for entry cars and nickel-rich cells for long-range versions, and buy electric vehicle battery packs sized to each platform. EV battery deployment reached 1.2 TWh in 2025, almost 30% more than in 2024, the IEA reported [2]. Electric motors and automotive power electronics carry less value per vehicle, but their efficiency decides how much of that stored energy reaches the wheels.
What supports Passenger Vehicles within Application?
Passenger Vehicles take 61.7% of 2026 revenue.
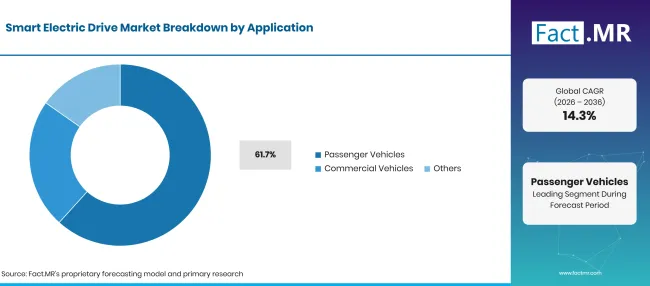
Smart Electric Drive Market Breakdown Application | Source: Fact.MR
| Application | Share (2026) |
|---|---|
| Passenger Vehicles (Leading segment) | 61.7% |
| Other segments combined | 38.3%* |
| Total | 100.0% |
Source: Fact.MR analysis. Updated Oct 23, 2026
Car buyers make up the bulk of electric vehicle demand, and passenger car lines run at volumes that justify dedicated drive units per platform. The IEA said the number of electric car models on offer could exceed 1,100 in 2026 [1]. Each new model family brings its own motor, inverter and pack specification. Commercial vehicles form a smaller but steadier buyer group. City buses, delivery vans and refuse trucks run fixed daily routes, which makes depot charging and electric axles easier to plan. Fleet operators pay closer attention to uptime and service cost than to acceleration.
What leads the Drive Type segment?
Front Wheel Drive makes up 42.3% of 2026 demand.
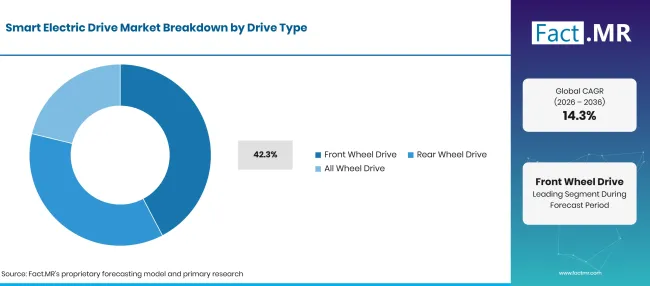
Smart Electric Drive Market Breakdown Drive Type | Source: Fact.MR
| Drive Type | Share (2026) |
|---|---|
| Front Wheel Drive (Leading segment) | 42.3% |
| Other segments combined | 57.7%* |
| Total | 100.0% |
Source: Fact.MR analysis. Updated Oct 23, 2026
One drive unit at the front axle keeps compact and mid-size electric cars simple to package and cheaper to build. Engineers can reuse body structures from existing platforms and leave rear space for the battery or cargo, which suits high-volume models. Rear wheel drive is common on dedicated electric platforms and premium cars that seek better traction under hard acceleration. All wheel drive adds a second motor, often with a decoupling unit, and electric vehicle drive motor suppliers sell more units per car in that layout. Integrated e-axle inverter and control units link both axles through one control strategy.
How does Charging Type shape demand?
Plug-in Charging accounts for 87.4% of the 2026 market.
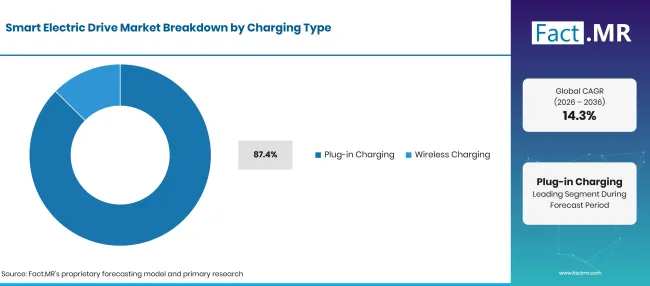
Smart Electric Drive Market Breakdown Charging Type | Source: Fact.MR
| Charging Type | Share (2026) |
|---|---|
| Plug-in Charging (Leading segment) | 87.4% |
| Other segments combined | 12.6%* |
| Total | 100.0% |
Source: Fact.MR analysis. Updated Oct 23, 2026
Drivers already have cable access at home, at work and on public networks, and every electric car on sale ships with a conductive charging inlet. Common connector standards and an on-board charger keep the cost low for the automaker. Wireless systems place a receiver pad under the vehicle and transfer power across an air gap from a ground pad. Bus depots and taxi ranks test wireless car charging because vehicles can top up without a driver handling a cable. Higher pad cost and few vehicle models still limit use.
What is accelerating Smart Electric Drive Market adoption, and what is holding it back?
Emission rules, lower cell prices and denser charging networks are pulling automakers toward integrated drives with software control. Subsidy cuts, costly magnets and power chips, and long software validation cycles slow the shift in price-sensitive segments.
Drivers Impact Analysis
| DRIVER | (~) % IMPACT ON CAGR | GEOGRAPHIC RELEVANCE | IMPACT TIMELINE |
|---|---|---|---|
| Fleet emission standards and purchase incentives favoring electric cars | +4.2% | Global | Short term (<= 2 years) |
| Lower battery pack prices freeing budget for motors and inverters | +3.6% | Global | Medium term (2-4 years) |
| Expansion of public fast-charging networks | +2.5% | Western Europe, North America, East Asia | Medium term (2-4 years) |
| Software-based torque control and remote drive diagnostics | +1.8% | Western Europe, North America, East Asia | Short term (<= 2 years) |
Source: Fact.MR analysis. Updated Oct 23, 2026
Opportunity Impact Analysis
| OPPORTUNITY | (~) % IMPACT ON CAGR | GEOGRAPHIC RELEVANCE | IMPACT TIMELINE |
|---|---|---|---|
| Three-in-one and X-in-1 drive modules that cut parts count | +1.3% | Global | Medium term (2-4 years) |
| Electrification of buses, vans and delivery fleets | +1.1% | Western Europe, North America, East Asia | Medium term (2-4 years) |
| Local drive unit production encouraged by import duties and incentives | +0.8% | Latin America, North America, Western Europe | Long term (>= 4 years) |
| Wireless charging at fleet depots and taxi ranks | +0.4% | North America, Western Europe, East Asia | Long term (>= 4 years) |
Source: Fact.MR analysis. Updated Oct 23, 2026
Restraints Impact Analysis
| RESTRAINT | (~) % IMPACT ON CAGR | GEOGRAPHIC RELEVANCE | IMPACT TIMELINE |
|---|---|---|---|
| Withdrawal of purchase subsidies and shifting emission targets | -1.2% | North America, Western Europe | Short term (<= 2 years) |
| High costs of permanent magnets, power semiconductors and battery materials | -0.9% | Global | Medium term (2-4 years) |
| Long validation, software integration and cybersecurity work for new drives | -0.5% | Global | Long term (>= 4 years) |
Source: Fact.MR analysis. Updated Oct 23, 2026
Which countries are scaling the Smart Electric Drive Market through 2036?
| Country | CAGR (2026 to 2036) |
|---|---|
| United States | 18.0% |
| United Kingdom | 16.9% |
| Brazil | 16.0% |
| Japan | 13.8% |
| Germany | 11.9% |
Source: Fact.MR analysis. Updated Oct 23, 2026
What supports adoption in the United States?
18.0% CAGR, driven by a rebound from a low post-credit base.
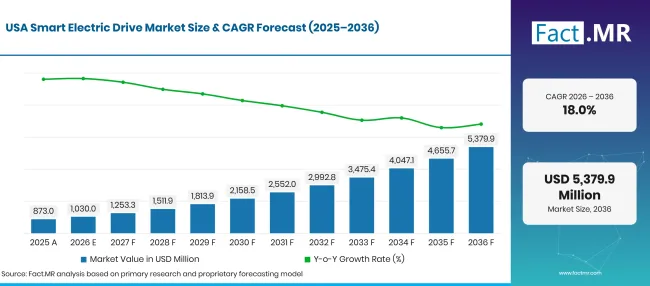
Smart Electric Drive Market Forecast Usa | Source: Fact.MR
The two federal tax credits for new electric vehicles expired on September 30, 2025, the U.S. Energy Information Administration noted [5]. Battery electric vehicles made up 6% of new light-duty sales in the second quarter of 2026, down from 7% a year earlier, while hybrids reached a record 16% [5]. Growth from this lower base will depend on cheaper models and drive units built in North America.
How is the United Kingdom developing demand?
16.9% CAGR, backed by a zero emission vehicle mandate and a buyer grant.
The Department for Transport reported that 473,000 zero emission cars were registered for the first time in 2025, equal to 23% of new car registrations, up from 19% in 2024 [6]. Under the Electric Car Grant, the top award is £3,750 for cars priced at or below £37,000 that meet the lowest carbon emission scores [7]. That price cap steers automakers toward efficient, lower-cost drive units.
What is supporting Brazil’s adoption?
16.0% CAGR, helped by rising electric car sales and local assembly.
Electric car sales in Brazil reached 180,000 in 2025, or 9% of all new car sales, up from 6.5% in 2024, according to the IEA [1].
What supports adoption in Japan?
13.8% CAGR, on the back of larger purchase subsidies and a low starting share.
The Ministry of Economy, Trade and Industry set its FY2026 clean energy vehicle subsidy for electric cars at up to 1.25 million yen, plus up to 50,000 yen more, for vehicles first registered from April 1, 2026 [8]. Electric cars accounted for less than 3% of Japanese car sales in 2025, the IEA reported [1]. Domestic automakers are now adding compact battery electric models.
How does Germany perform?
11.9% CAGR, reflecting a large existing base and an income-linked grant.
The Kraftfahrt-Bundesamt counted 545,142 new battery electric cars in 2025, a 43.2% increase that took their share of registrations to 19.1% [9]. The federal government offers grants of up to 6,000 euros for electric cars first registered since January 1, 2026, and reported about 100,000 approvals by October 2026 [10]. Percentage growth stays lower because the electric fleet is already large.
Who leads the Smart Electric Drive Market?
The field splits into full-system suppliers and drive specialists.
Bosch, ZF, Magna and BorgWarner sell complete e-axles that merge motor, inverter and gearbox, and they win platform contracts by spreading one design across many power classes. In July 2026, Magna announced a 250 kW, 800 V two-speed eDrive award with Chery, to be built at its Wuhu plant [11]. BorgWarner reported an August 2026 award for a three-in-one integrated drive module with a GenIV inverter, starting production in 2027 [12]. ZF added remote health checks to its AxTrax 2 LF bus axle in June 2026 [3]. Schaeffler and GKN Automotive bring axle and driveline depth, including e-axles, eDrive units and all wheel drive systems. MAHLE and Astemo compete on motors and inverters, with MAHLE developing a magnet-free traction motor. Efficiency per kilowatt-hour, software control and local production will separate the winners.
Which companies are the key providers?
Key companies include Robert Bosch GmbH; ZF Friedrichshafen AG; Magna International Inc.; BorgWarner Inc.; Schaeffler AG; GKN Automotive; MAHLE GmbH; and Astemo, Ltd.
- Robert Bosch GmbH
- ZF Friedrichshafen AG
- Magna International Inc.
- BorgWarner Inc.
- Schaeffler AG
- GKN Automotive
- MAHLE GmbH
- Astemo, Ltd.
This Report Answers
- How do battery, motor and power electronics revenue split inside a smart electric drive?
- Which layout, application and charging type lead, and what buyer needs explain their 2026 shares?
- Five countries are compared on purchase grants, emission mandates and import duties.
- Where do full-system suppliers and drive specialists compete, and on what terms?
- Cell prices, magnet supply and software validation are traced to show what limits drive system uptake.
What does the Smart Electric Drive Market cover?
This market tracks propulsion systems that turn stored electrical energy into wheel torque, together with the electronics and software that govern them. Battery packs, traction motors, inverters, DC-DC converters and integrated drive assemblies are the main hardware.
Demand is followed across passenger and commercial vehicles, front, rear and all wheel drive layouts, and plug-in and wireless charging. Lithium-ion cells, permanent magnets, copper windings and power semiconductors are the main material inputs.
What is included in the scope?
Battery packs, electric motors, inverters, converters, on-board chargers and drive control units supplied for electric vehicles are counted. X-in-1 modules and electric axles that combine several of these parts are included at system value, and electric car battery chargers mounted on the vehicle count as power electronics.
Control software is counted when sold as part of the drive system. Vehicle-side wireless charging receivers are included when delivered with the drive.
What is excluded from the scope?
Internal combustion engines, conventional transmissions, mild-hybrid starter-generators, fuel-cell stacks and hydrogen tanks are left out. Complete vehicle sales add no revenue beyond the value of their electric drive systems.
Public and home charging stations, charging cables and grid equipment are not counted. Mined lithium and refined metals traded on their own are also outside this market.
How Was the Analysis Built?
The analysis draws on 120+ sources, 35+ company portfolios, 25+ countries, and more than 20 industry interviews.
- Primary Research: Primary research includes discussions with manufacturers, service providers, technology developers, distributors, end users, and subject-matter experts. These conversations examine purchasing priorities, product adoption, operational challenges, approval requirements, competitive positioning, and the factors that influence wider market acceptance.
- Desk Research: Desk research covers government statistics, regulatory publications, company filings, trade data, technical studies, industry associations, standards, public policy, and other authoritative sources. Every source used in the analysis is documented in the bibliography.
- Market Sizing and Forecasting: Market estimates combine historical performance, demand indicators, pricing and volume trends, segment shares, company participation, country-level growth, adoption patterns, investment activity, and barriers to market expansion.
- Data Validation and Update Cycle: Findings are validated by comparing primary interviews with public data, company activity, regulatory changes, trade patterns, and industry developments. Regular updates review new product launches, capacity changes, partnerships, approvals, and shifts in commercial adoption.
Segmentation
What is the report’s scope and coverage?
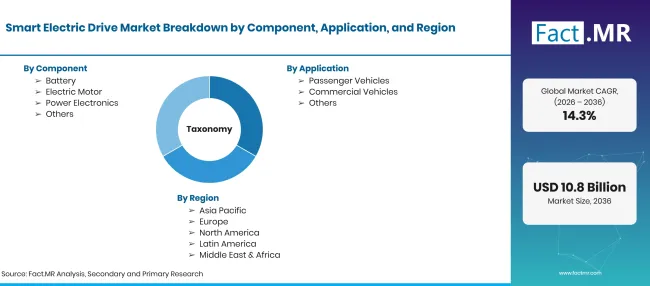
Smart Electric Drive Market Taxonomy | Source: Fact.MR
| Attribute | Details |
|---|---|
| Quantitative Units | USD billion in 2026 to USD billion by 2036 at CAGR |
| Market Definition | Electric drive systems for road vehicles that combine a battery, an electric motor and power electronics with control software for torque, thermal and energy management. The scope covers systems supplied for plug-in or wireless charging. |
| Component | Battery; Electric Motor; Power Electronics |
| Application | Passenger Vehicles; Commercial Vehicles |
| Drive Type | Front Wheel Drive; Rear Wheel Drive; All Wheel Drive |
| Charging Type | Plug-in Charging; Wireless Charging |
| Regions Covered | North America; Latin America; Western Europe; Eastern Europe; East Asia; South Asia & Pacific; Middle East & Africa |
| Countries Covered | United States; United Kingdom; Brazil; Japan; Germany |
| Companies Profiled | Robert Bosch GmbH; ZF Friedrichshafen AG; Magna International Inc.; BorgWarner Inc.; Schaeffler AG; GKN Automotive; MAHLE GmbH; Astemo, Ltd. |
| Forecast Period | 2026 to 2036 |
| Approach | Hybrid top-down and bottom-up approach using electric vehicle output by country; battery, motor and inverter content per vehicle; drive layout and charging mix; and supplier portfolio review. |
Source: Fact.MR analysis. Updated Oct 23, 2026
How is the market segmented?
-
By Component
- Battery
- Electric Motor
- Power Electronics
-
By Application
- Passenger Vehicles
- Commercial Vehicles
-
By Drive Type
- Front Wheel Drive
- Rear Wheel Drive
- All Wheel Drive
-
By Charging Type
- Plug-in Charging
- Wireless Charging
-
By Region
- North America
- Latin America
- Western Europe
- Eastern Europe
- East Asia
- South Asia & Pacific
- Middle East & Africa
Bibliography
- [1] International Energy Agency. (2026, May 20). Global EV Outlook 2026: Trends in electric cars.
- [2] International Energy Agency. (2026, May 20). Global EV Outlook 2026: Electric vehicle batteries.
- [3] ZF Friedrichshafen AG. (2026, June 17). Innovations that Drive Market Success: ZF with New Technologies at busworld Türkiye 2026.
- [4] European Parliament Legislative Observatory. (2025, December 16). CO2 emission performance standards for new light duty vehicles and vehicle labelling.
- [5] U.S. Energy Information Administration. (2026, July 27). Hybrid sales rise while battery electric sales remain lower after tax credit expiration.
- [6] Department for Transport. (2026, April 29). Vehicle licensing statistics, United Kingdom: 2025.
- [7] Department for Transport. (2026, April 1). How to apply for vehicle eligibility for the Electric Car Grant.
- [8] Ministry of Economy, Trade and Industry, Japan. (2026). 令和8年度におけるクリーンエネルギー自動車導入促進補助金について [Clean Energy Vehicle Introduction Promotion Subsidy for FY2026].
- [9] Kraftfahrt-Bundesamt. (2026, January 6). Fahrzeugzulassungen im Dezember 2025: Jahresbilanz [Vehicle registrations in December 2025: annual review].
- [10] Die Bundesregierung. (2026, October 8). E-Auto-Förderung 2026: Bereits 100.000 Bewilligungen [EV subsidy 2026: already 100,000 approvals].
- [11] Magna International Inc. (2026, July 28). Magna Secures 800V eDrive Program Award with Chery.
- [12] BorgWarner Inc. (2026, August 4). BorgWarner Wins Major Program with Next Generation Integrated Drive Module Technology.
Frequently Asked Questions
How large is the smart electric drive market in 2026?
What growth rate will the smart electric drive market record from 2026 to 2036?
Which component leads the smart electric drive market?
Which application holds the greatest share of the smart electric drive market?
Which drive type contributes the most to the smart electric drive market?
Which charging type leads the smart electric drive market?
Which country will record the strongest growth in the smart electric drive market?
Who are the main companies in the smart electric drive market?
Who worked on this report


Preview the report firsthand - request a free sample
Free SampleGet the brochure for pricing and purchase details
Download PDF