- Market Value (2025): USD 95.9 Mn
- Estimated Value (2026): USD 104.0 Mn
- Forecast Value (2036): USD 235.0 Mn
- CAGR (2026-2036): 8.5%
What is the Streaming Current Detectors Market forecast to be worth by 2036?
USD 104.0 million in 2026 to USD 235.0 million by 2036 at 8.5% CAGR.
- The Streaming Current Detectors Market crossed a valuation of USD 95.9 million in 2025, supported by treatment plants that already rely on coagulation control for drinking water and process water quality.
- Demand is projected to increase from USD 104.0 million in 2026 to USD 235.0 million by 2036.
- The market is forecast to record a 8.5% CAGR from 2026 to 2036. Growth is expected to come from utilities that need faster coagulant response when raw-water quality changes after storms or seasonal runoff.
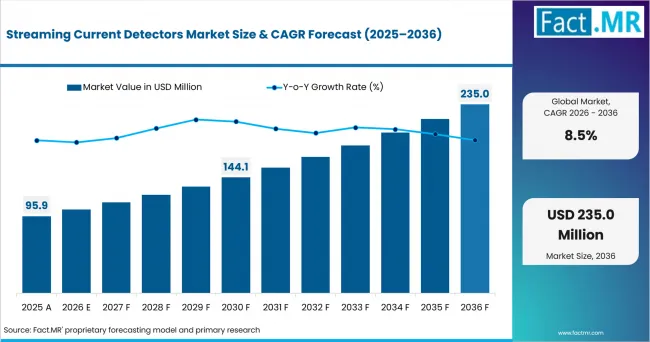
Streaming Current Detectors Market Value Analysis | Source: Fact.MR
What are the defining numbers behind Streaming Current Detectors Market growth?
USD 131.0 million absolute opportunity is expected by 2036.
- Demand Drivers in the Market
- Storms and seasonal changes can quickly affect the quality of incoming water. This creates a need for faster chemical adjustment than jar tests alone can provide.
- Automatic dosing is expected to reduce long periods of excess chemical use when operators compare the detector reading with turbidity results.
- Built-in controls are likely to help smaller water utilities keep dosing steady during nights and weekends when fewer laboratory staff are available.
- Streaming-current readings become more useful when operators review them together with turbidity and water-flow data in the same control room.
- Key Segments Analyzed
- By Product Type: Inline SCD analyzers are expected to hold 33.0% share in 2026 supported by continuous charge monitoring within the treatment stream and lower dependence on periodic bench testing.
- By Application: Drinking water treatment is projected to account for 32.0% share in 2026 owing to the need for stable coagulation performance and consistent finished-water quality.
- By Control Mode: Coagulant dose control is anticipated to capture 35.0% share in 2026 due to its direct role in adjusting chemical feed from real-time detector readings.
- By Sensor Type: Piston-cell sensors are estimated to represent 34.0% share in 2026 attributable to their established use in plants handling frequent changes in raw-water chemistry.
- By End User: Water utilities are forecast to hold 34.0% share in 2026 driven by continuous coagulation operations and the need to avoid visible treatment failures.
- Analyst Opinion at Fact.MR
- Shambhu Nath Jha, Senior Analyst at Fact.MR, states, “Streaming current detectors are not chosen only for accurate readings. Operators also want a steady signal between cleaning cycles and easy use with the plant’s existing controls. Equipment companies that make calibration and sample handling simple are likely to gain more trust from utilities with limited staff time.”
- Strategic Implications
- Water utilities gain a clearer view by testing detector stability under changing raw-water conditions before using automatic dose control at several plants. A steady signal between cleanings is more useful than a strong laboratory result that is hard to maintain during daily operation.
- Equipment companies need to make sensor cleaning, calibration and sample handling easier for smaller treatment plants. Self-cleaning parts and simple service steps reduce the amount of specialist work required.
- Plant operators get better results when they review streaming-current readings with turbidity, flow and chemical-feed data. This helps them see whether a change comes from the water or from a problem with the instrument.
- Local service companies strengthen support by keeping piston cells, seals and other replacement parts near installed sites. Fast access to these items reduces downtime and helps utilities stay confident in automatic coagulation control.
Public water infrastructure gives the detector market a measurable utility base. The U.S. EPA reported in its Seventh Drinking Water Infrastructure Needs Survey and Assessment that public water systems require USD 625.0 billion in 20-year capital improvements. That capital need does not translate directly into detector spending, but it shows why treatment operators review instruments that support chemical dosing, filtration performance and plant reliability.
UAE is estimated to post a 9.2% CAGR through 2036. USA is anticipated to advance at an 8.5% CAGR by 2036. Japan is forecast to record a 8.4% CAGR from 2026 to 2036. United Kingdom is projected to post an 8.2% CAGR by 2036. Germany is estimated to record a 7.9% CAGR through 2036.
How does the Streaming Current Detectors Market break down by segment?
Inline SCD analyzers lead at 33.0% by Product Type. Drinking water treatment leads at 32.0% by Application in 2026.
Why do Inline SCD analyzers lead Product Type?
Inline SCD analyzers are estimated to hold 33.0% share in 2026.
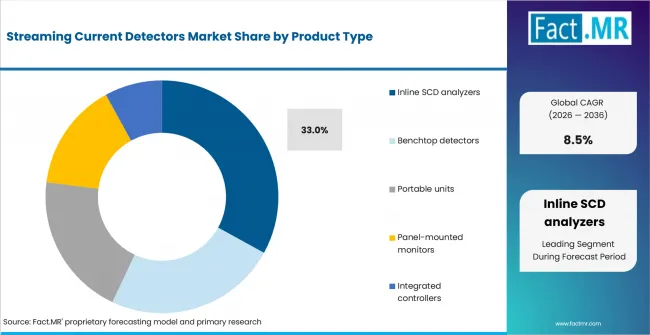
Streaming Current Detectors Market Analysis By Product Type | Source: Fact.MR
Inline units stay connected to the treatment stream and show charge changes as they occur. This gives operators an early warning when storms, source blending or seasonal runoff alter incoming water quality. The value comes from faster response during normal plant operation. Benchtop and portable systems remain useful for verification, but they do not provide the same continuous process signal.
Why does Drinking water treatment lead Application?
Drinking water treatment is estimated to hold 32.0% share in 2026.
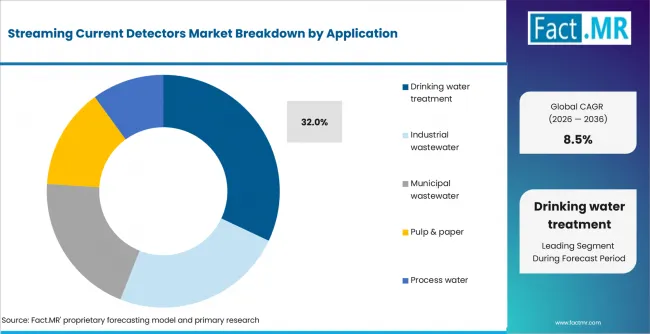
Streaming Current Detectors Market Analysis By Application | Source: Fact.MR
Municipal plants use coagulation to remove suspended matter before filtration and disinfection. Poor chemical adjustment can affect finished-water clarity and create public concern. Streaming current detection gives these facilities another way to keep treatment stable before a visible quality problem develops. Industrial wastewater and paper applications also use charge monitoring, but the public-health responsibility is different.
Why does Coagulant dose control lead Control Mode?
Coagulant dose control is estimated to hold 35.0% share in 2026.
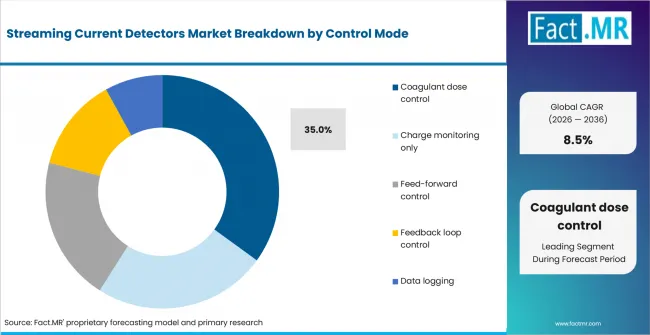
Streaming Current Detectors Market Analysis By Control Mode | Source: Fact.MR
This mode turns the detector reading into an operating action. When the charge signal moves outside the preferred range, the chemical feed can be adjusted before excess coagulant raises cost or sludge volume. Monitoring-only systems provide information without changing the dose. Feed-forward and feedback arrangements serve more advanced control strategies that require added setup and operator confidence.
Why do Piston-cell sensors lead Sensor Type?
Piston-cell sensors are estimated to hold 34.0% share in 2026.
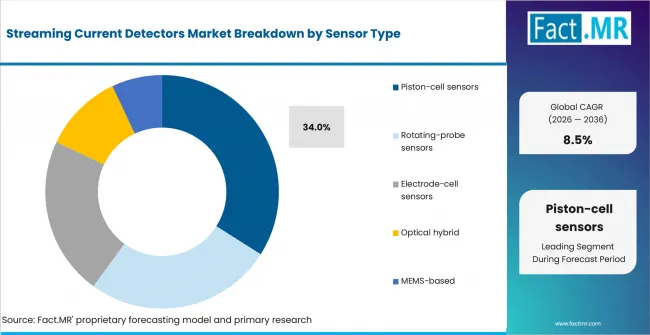
Streaming Current Detectors Market Analysis By Sensor Type | Source: Fact.MR
Piston-cell designs have a long record of use in water plants and are familiar to many operators. Their mechanical movement creates the streaming-current signal under varied source-water conditions. This established operating history supports easier training and maintenance planning. Rotating-probe, electrode-cell and newer sensor formats may suit specific duties, but they have a narrower installed base.
Why do Water utilities lead End User?
Water utilities are estimated to hold 34.0% share in 2026.
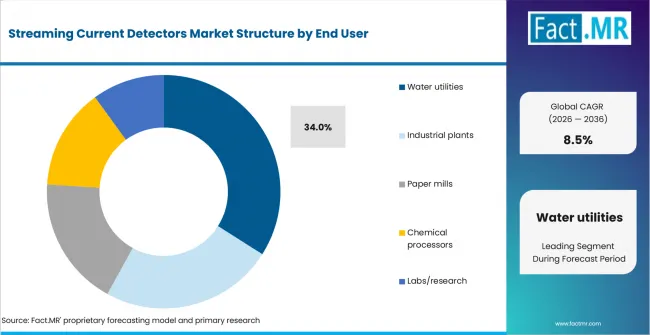
Streaming Current Detectors Market Analysis By End User | Source: Fact.MR
Utilities run treatment processes every day across large and changing water volumes. Small dosing errors can raise chemical use or reduce filtration performance over long operating periods. They also manage regulatory checks and service expectations that make stable treatment especially important. Industrial plants and laboratories use these instruments for narrower process goals, while utilities apply them across continuous public-water operations.
What is accelerating Streaming Current Detectors Market adoption, and what is holding it back?
Variable raw-water quality is anticipated to expand Streaming Current Detectors Market demand. Sensor fouling is expected to remain the main restraint because deposits and air bubbles reduce confidence in the signal.
Drivers Impact Analysis
| DRIVER | (~) % IMPACT ON CAGR | GEOGRAPHIC RELEVANCE | IMPACT TIMELINE |
|---|---|---|---|
| Variable raw-water quality | +2.5% | Drinking-water utilities | Short term (<=2 years) |
| Chemical-cost control | +1.8% | Municipal and industrial water | Short term (<=2 years) |
| Automation of smaller plants | +1.3% | Regional utilities | Medium term (2-4 years) |
| Data-driven process control | +0.8% | Advanced treatment plants | Medium term (2-4 years) |
Source: Fact.MR analysis. Updated Jul 22, 2026
- Variable raw-water quality: Storms, algal shifts and source-water blending are expected to make fixed chemical doses less reliable. A continuous charge signal helps operators see instability before a finished-water issue develops.
- Chemical-cost control: Coagulant overfeed raises operating cost and sludge load. Streaming-current feedback is expected to help plants tighten the dosing window without relying only on periodic jar tests.
- Automation of smaller plants: Regional utilities often run with lean staff. Integrated controllers are anticipated to support more consistent dosing when experienced operators are not on site.
- Data-driven process control: Treatment teams increasingly review charge readings beside flow and turbidity. That combined view is expected to make the detector part of a wider plant-control decision.
Opportunity Impact Analysis
| OPPORTUNITY | (~) % IMPACT ON CAGR | GEOGRAPHIC RELEVANCE | IMPACT TIMELINE |
|---|---|---|---|
| Multi-parameter controllers | +1.5% | China and UAE | Short term (<=2 years) |
| Remote diagnostics | +1.1% | China and UAE | Medium term (2-4 years) |
| Portable optimization tools | +0.8% | China and UAE | Medium term (2-4 years) |
Source: Fact.MR analysis. Updated Jul 22, 2026
- Multi-parameter controllers: Plants gain a clearer operating picture when charge, turbidity and flow are visible together. Controller packages are expected to raise the value of each detector installation for suppliers serving large municipal systems.
- Remote diagnostics: Sensor-health alerts are expected to reduce missed fouling and unnecessary service visits. This is useful where installed units sit across many plants or remote treatment sites.
- Portable optimization tools: Portable units are expected to support commissioning and short-term process studies. They give operators a way to test dosing behavior before committing to permanent inline installation.
Restraints Impact Analysis
| RESTRAINT | (~) % IMPACT ON CAGR | GEOGRAPHIC RELEVANCE | IMPACT TIMELINE |
|---|---|---|---|
| Sensor fouling | -1.9% | Global | Short term (<=2 years) |
| Operator dependence | -1.4% | Global | Medium term (2-4 years) |
| Alternative control methods | -1.0% | Global | Medium term (2-4 years) |
Source: Fact.MR analysis. Updated Jul 22, 2026
- Sensor fouling: Deposits on the sensing surface and trapped air are expected to weaken confidence in readings. Facilities with variable solids load need cleaning routines that operators follow consistently.
- Operator dependence: The raw signal has to be linked to each plant’s actual treatment response. Training remains necessary because the detector does not replace local process judgment.
- Alternative control methods: Some facilities still prefer zeta-potential testing, manual jar testing or feed-forward dosing models. Familiar methods are anticipated to slow first-time detector purchases in conservative plants.
Which countries are scaling Streaming Current Detectors Market fastest?
The global growth rate brings together every country covered in the study. UAE grows faster than the worldwide rate of 8.5%. The USA and Japan move at a steadier pace. UK and Germany develop from more mature treatment systems.
- Growth also follows a different route in each country. Plant design and water scarcity shape how quickly streaming current detectors are added. Regulatory oversight and the installed base also affect project timing.
- The UAE follows a water-efficiency path where desalination pretreatment and municipal systems benefit from tighter chemical control. The USA reflects gradual replacement of manual routines where utilities already use EPA optimization guidance.
- Japan’s demand is tied to compact and reliable instrumentation for plants that value precise process control. The UK is shaped by regulated water-sector investment cycles. Germany grows from a more mature base where replacements and software upgrades carry more weight than first-time adoption.
Countries with similar rates still differ in buyer behavior. Sample quality and service access affect when projects move from interest to purchase. Operator training and local rules shape the same decision.
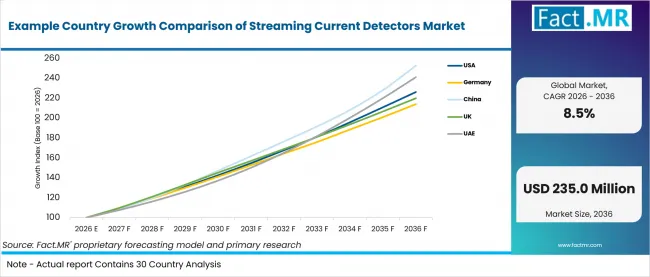
Example Country Growth Comparison Of Streaming Current Detectors Market | Source: Fact.MR
| COUNTRY | CAGR (2026 to 2036) |
|---|---|
| UAE | 9.2% |
| USA | 8.5% |
| Japan | 8.4% |
| United Kingdom | 8.2% |
| Germany | 7.9% |
Source: Fact.MR analysis. Updated Jul 22, 2026
How is the UAE scaling demand?
9.2% CAGR, shaped by desalination systems that require close control of changing seawater conditions.
UAE demand is tied closely to desalination pretreatment and the protection of downstream equipment. Seawater quality can change due to turbidity, suspended solids and biological activity. Streaming current detectors help operators refine chemical dosing before unstable feedwater affects membranes or later treatment stages.
What supports the USA outlook?
8.5% CAGR, connected to formal treatment-optimization programs rather than plant construction alone.
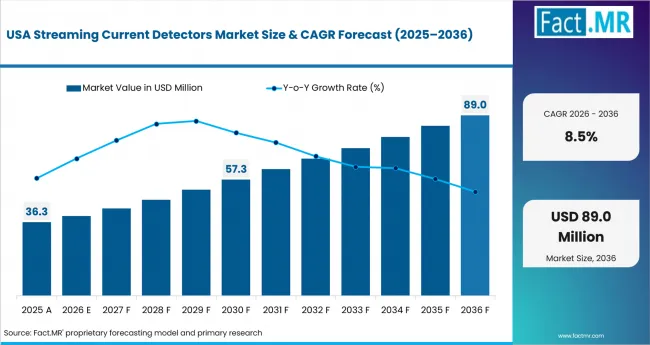
Streaming Current Detectors Market Country Value Analysis | Source: Fact.MR
USA adoption is expected to come mainly from existing utilities seeking better control over coagulation. Streaming current readings give operators a continuous signal that supports jar testing and turbidity checks. Replacement projects and control-system upgrades therefore carry as much importance as first-time installation.
What underpins Japan’s growth?
8.4% CAGR, driven by ageing infrastructure and the need to operate water systems with fewer workers.
Japan is developing water operations around compact instruments and connected monitoring systems. Streaming current detectors suit plants that require steady process information without adding heavy manual work. Simple cleaning and remote instrument checks are likely to carry particular value where staffing remains limited.
How is the United Kingdom developing demand?
8.2% CAGR, tied to regulated asset renewal and closer examination of treatment control.
United Kingdom utilities typically purchase instrumentation through planned asset-upgrade cycles. Streaming current detectors are expected to receive attention when coagulation controls and monitoring systems are renewed. Adoption depends on clear proof that the instrument improves chemical dosing, operating stability and treatment reliability.
What shapes Germany’s outlook?
7.9% CAGR, reflecting a mature treatment base where upgrades carry more weight than first-time automation.
German utilities already use advanced process monitoring across many treatment settings. Demand is therefore expected to come from replacing ageing detectors, improving controller integration and reducing maintenance work. Signal stability and dependable local service are likely to influence equipment selection.
Who leads the Streaming Current Detectors Market?
Chemtrac and HF scientific (Watts Water Technologies) have a strong position in online charge measurement. Micrometrix and Hach also offer well-known equipment for coagulation control.
Chemtrac offers the DuraTrac 4 detector for live signal tracking, system checks and direct links to chemical-feed controls. Its HydroACT platform also brings together streaming current, turbidity, pH and organic-matter readings.
Micrometrix focuses on charge-measurement equipment. Its W610 detector provides trend charts, control features and an optional automatic cleaning function. Hach offers the AF7000 streaming current monitor along with service parts.
Through 2036, companies are likely to compete on how steady the signal remains when raw-water quality changes and how easy the unit is to clean. Water utilities will also look at whether the detector works with existing controls, how simple calibration is and how quickly replacement sensor parts are available. Equipment companies that present clear readings and link them directly to chemical dosing decisions are likely to gain more repeat orders.
Which companies are the key providers?
Key companies include Chemtrac; HF scientific (Watts Water Technologies); Micrometrix; Hach (Danaher).
- Chemtrac
- Micrometrix
- HF scientific (Watts Water Technologies)
- Hach (Danaher)
Bibliography
- U.S. Environmental Protection Agency. (2026, May 21). Clean Watersheds Needs Survey. U.S. Environmental Protection Agency.
- European Commission. (2025, June 3). European Water Resilience Strategy. European Commission.
- U.S. Geological Survey. (2026). Water use in the United States. U.S. Geological Survey.
This Report Addresses
- The report provides strategic intelligence on Streaming Current Detectors Market across Product Type and Application choices that shape purchasing decisions.
- Segment analysis covers Inline SCD analyzers as the share leader within the 2026 market structure.
- Regional outlook evaluates UAE alongside USA and Japan. UK and Germany complete the growth comparison.
- Competitive analysis profiles Chemtrac and HF scientific (Watts Water Technologies) alongside Micrometrix. Additional active providers are also listed.
- Use-case assessment covers the categories and applications that shape streaming current detectors market demand across the forecast period.
What does the Streaming Current Detectors Market cover?
Streaming current detectors are used to measure the electrical charge carried by suspended particles in water and process-fluid samples.
The Streaming Current Detectors Market covers instruments and related control packages used to support coagulation monitoring and chemical-dose adjustment. Coverage includes inline SCD analyzers and benchtop detectors. Portable units and panel-mounted monitors are also included. Integrated controllers and sample-conditioning parts fall within the market boundary. Dedicated detector software is included when it supports streaming current measurement or control.
The market differs from general water-quality monitoring because commercial value comes from measuring the charge condition of suspended particles. Turbidity meters remain outside the boundary. Laboratory zeta-potential systems are also excluded. Generic SCADA software and complete chemical-feed systems remain outside the market unless they form part of the detector package.
What is included in the scope?
Streaming current detectors are used across water utilities and industrial plants. Paper mills and chemical processing sites are also included. Laboratory and research use is covered within defined charge-measurement applications.
The scope includes Product Type and Application alongside Control Mode and Sensor Type. End User is also included. Coverage spans inline SCD analyzers and benchtop detectors. Portable units and panel-mounted monitors complete the main product scope. It includes coagulant dose control and charge monitoring. Feed-forward control and feedback loop control are also covered. Piston-cell sensors and rotating-probe sensors are included alongside electrode-cell sensors. Optical hybrid and MEMS-based sensors remain within scope when they directly measure streaming current.
What is excluded from the scope?
Water-quality instruments and control systems that do not measure streaming current directly remain outside the scope of this market.
The scope excludes standalone turbidity meters and laboratory zeta-potential systems. Generic SCADA platforms are excluded. Complete chemical-feed systems remain outside the scope when sold separately from the detector package. General water-treatment equipment and unrelated process analyzers are also excluded.
How Was the Analysis Built?
The analysis draws on 120+ sources, 35+ company portfolios, 25+ countries, and more than 20 industry interviews.
- Primary Research: Primary research includes discussions with manufacturers, service providers, technology developers, distributors, end users, procurement teams, and subject-matter experts. These conversations examine purchasing priorities, product adoption, operational challenges, approval requirements, competitive positioning, and the factors that influence wider market acceptance.
- Desk Research: Desk research covers government statistics, regulatory publications, company filings, trade data, technical studies, industry associations, standards, public policy, and other authoritative sources. Every source used in the analysis is documented in the bibliography.
- Market Sizing and Forecasting: Market estimates combine historical performance, demand indicators, pricing and volume trends, segment shares, company participation, country-level growth, adoption patterns, investment activity, and barriers to market expansion.
- Data Validation and Update Cycle: Findings are validated by comparing primary interviews with public data, company activity, regulatory changes, trade patterns, and industry developments. Regular updates review new product launches, capacity changes, partnerships, approvals, procurement trends, and shifts in commercial adoption.
Segmentation
What is the report's scope and coverage?
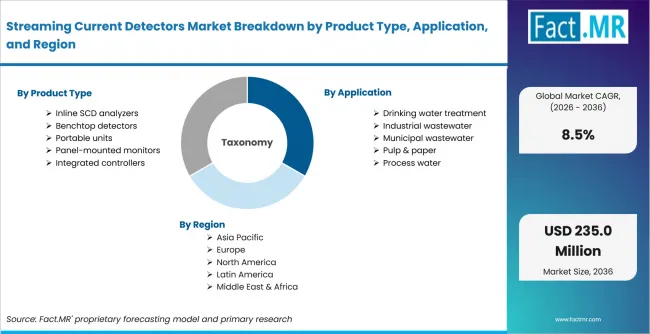
Streaming Current Detectors Market Breakdown By Product Type, Application, And Region | Source: Fact.MR
| Attribute | Details |
|---|---|
| Quantitative Units | USD million in 2026 to USD million by 2036 at a CAGR |
| Market Definition | A streaming current detector measures the electrical charge condition of suspended particles in a flowing water sample. |
| Product Type | Inline SCD analyzers; Benchtop detectors; Portable units; Panel-mounted monitors; Integrated controllers |
| Application | Drinking water treatment; Industrial wastewater; Municipal wastewater; Pulp & paper; Process water |
| Control Mode | Coagulant dose control; Charge monitoring only; Feed-forward control; Feedback loop control; Data logging |
| Sensor Type | Piston-cell sensors; Rotating-probe sensors; Electrode-cell sensors; Optical hybrid; MEMS-based |
| End User | Water utilities; Industrial plants; Paper mills; Chemical processors; Labs/research |
| Regions Covered | North America; Latin America; Europe; East Asia; South Asia & Oceania; Middle East & Africa |
| Countries Covered | USA; Canada; Brazil; Mexico; Germany; U.K.; France; Italy; Spain; South Korea; Japan; Australia & New Zealand; GCC Countries; South Africa; UAE |
| Key Companies Profiled | Chemtrac; HF scientific (Watts Water Technologies); Micrometrix; Hach (Danaher) |
| Forecast Period | 2026 to 2036 |
| Approach | Hybrid top-down and bottom-up approach using demand indicators across Product Type, Application, Control Mode, Sensor Type, End User, country-level growth and company participation |
Source: Fact.MR analysis. Updated Jul 22, 2026
How is the market segmented?
-
By Product Type
- Inline SCD analyzers
- Benchtop detectors
- Portable units
- Panel-mounted monitors
- Integrated controllers
-
By Application
- Drinking water treatment
- Industrial wastewater
- Municipal wastewater
- Pulp & paper
- Process water
-
By Control Mode
- Coagulant dose control
- Charge monitoring only
- Feed-forward control
- Feedback loop control
- Data logging
-
By Sensor Type
- Piston-cell sensors
- Rotating-probe sensors
- Electrode-cell sensors
- Optical hybrid
- MEMS-based
-
By End User
- Water utilities
- Industrial plants
- Paper mills
- Chemical processors
- Labs/research
-
By Region
- North America
- USA
- Canada
- Latin America
- Brazil
- Mexico
- Rest of Latin America
- Europe
- Germany
- U.K.
- France
- Italy
- Spain
- Rest of Europe
- East Asia
- South Korea
- Japan
- South Asia & Oceania
- India
- Australia & New Zealand
- Rest of South Asia & Oceania
- Middle East & Africa
- GCC Countries
- South Africa
- UAE
- Rest of Middle East & Africa
- North America
Frequently Asked Questions
Which Product Type leads the Streaming Current Detectors Market?
Which Application leads the Streaming Current Detectors Market?
Which Control Mode leads the Streaming Current Detectors Market?
Which Sensor Type leads the Streaming Current Detectors Market?
Which End User leads the Streaming Current Detectors Market?
How does UAE perform in the Streaming Current Detectors Market?
How does USA perform in the Streaming Current Detectors Market?
What is the primary driver in the Streaming Current Detectors Market?
What is the main restraint in the Streaming Current Detectors Market?
Who worked on this report


Preview the report firsthand - request a free sample
Free SampleGet the brochure for pricing and purchase details
Download PDF