- Market Value (2025): USD 1.8 Bn
- Estimated Value (2026): USD 1.9 Bn
- Forecast Value (2036): USD 4.5 Bn
- CAGR (2026-2036): 9.0%
What is the Sustainable Process Efficiency Toolkits Market forecast to be worth by 2036?
USD 1.9 billion in 2026 to USD 4.5 billion by 2036 at a 9.0% CAGR.
- As per Fact.MR analysis, the sustainable process efficiency toolkits market reached USD 1.8 billion in 2025.
- Demand is projected to increase from USD 1.9 billion in 2026 to USD 4.5 billion by 2036.
- The market is forecast to record a 9.0% CAGR from 2026 to 2036. Plant operators are linking resource measurement more closely with production decisions.
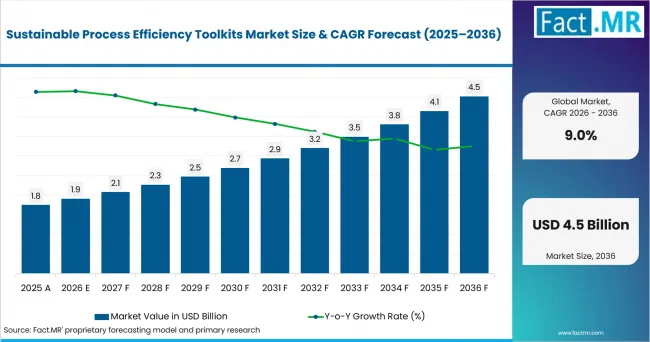
Sustainable Process Efficiency Toolkits Market Value Analysis | Source: Fact.MR
What are the defining numbers behind Sustainable Process Efficiency Toolkits Market growth?
According to Fact.MR analysis, an absolute opportunity of USD 2.6 billion is projected between 2026 and 2036.
- Demand Drivers in the Market
- Plant energy teams track major equipment and compare energy use with production levels. In March 2025, the U.S. Department of Energy reported that Better Plants partners had saved 2.8 quadrillion Btu of energy [1].
- Operations managers track water use and production losses for each line or batch. Meter data shows where resource use changes, while clear action plans help turn improvement targets into changes on the production line.
- Engineering teams check where waste heat is available and whether it can be reused in the production process. Comparing heat data with production schedules helps them review a project before spending money on new equipment.
- Sustainability teams connect carbon data with plant activity. These tools use energy, water, and material data to calculate CO2e per unit, helping companies compare plant performance and link environmental reporting with production results.
- Key Segments Analyzed
- By Toolkit Module: Energy mapping is projected to hold 36.0% share in 2026. It gives plant teams an early view of large energy loads and avoidable losses.
- By Process Area: Thermal processing is estimated to account for 34.0% share in 2026. This is because furnaces, dryers and heated processes create measurable efficiency opportunities.
- By Delivery: Software toolkit is anticipated to capture 30.0% share in 2026. Plant teams can use the same calculations, dashboards and action tracking across repeated reviews.
- By KPI: kWh/unit is forecast to represent 36.0% share in 2026. The metric links energy use directly with production output and gives plant teams a practical measure for comparison.
- Analyst Opinion at Fact.MR
- Shambhu Nath Jha, Principal Consultant at Fact.MR, states, “These tools are useful when they turn plant audit results into clear actions. They show where losses happen, what changes can be made, and whether performance improves after the change. Suppliers that provide accurate measurements and simple steps for plant staff offer more value than those providing only a data dashboard.”
- Strategic Implications
- Toolkit developers use plant measurements for their calculations so engineering teams can check the savings before using the same changes at other sites.
- Manufacturers track energy and water use for each unit produced. Measures such as kWh per unit and water per unit show plant performance more clearly than yearly company totals.
- System integrators connect sensor data with existing plant control and data systems. This keeps efficiency data in one place and reduces extra data work.
- Plant managers use digital models and continuous monitoring when production conditions change often. Regular updates help them make better operating decisions when these changes affect plant performance.
Japan is expected to grow at 9.0% CAGR through 2036 as industries continue to focus on using energy more efficiently. The United States follows at 8.6% as manufacturers invest in energy management and plant data tools. Germany reaches 8.3% as industries with high energy use continue to focus on reducing costs. France records 8.0% as factories closely track energy use and performance, while the UK reaches 7.7% as companies continue to improve plant efficiency.
How does the Sustainable Process Efficiency Toolkits Market break down by segment?
As per Fact.MR analysis, Energy mapping leads Toolkit Module at 36.0%, while Thermal processing leads Process Area at 34.0%. Software toolkit leads Delivery at 30.0%, and kWh/unit leads KPI at 36.0%.
Which Toolkit Module dominates?
Energy mapping is projected to hold 36.0% share in 2026.
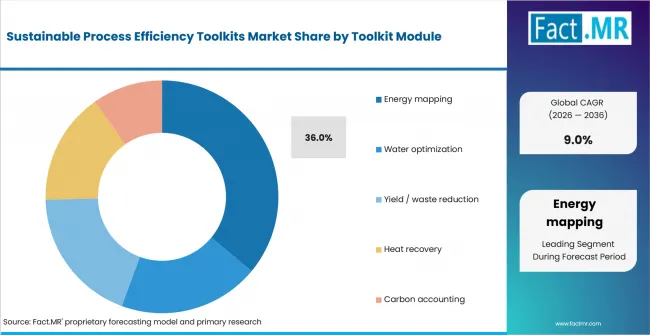
Sustainable Process Efficiency Toolkits Market Analysis By Toolkit Module | Source: Fact.MR
Energy mapping is expected to lead because it gives plant staff a clear view of where energy is being used. They can check electricity, fuel, steam, and compressed air use before choosing equipment, software, or other services. Water management is also important for plants that use large amounts of water for washing, cooling, or production.
What leads the Process Area segment?
Thermal processing is estimated to account for 34.0% share in 2026.
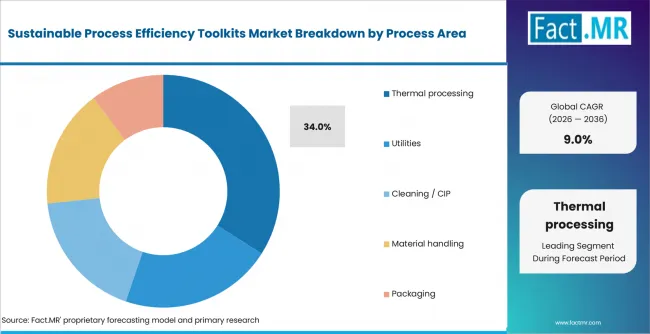
Sustainable Process Efficiency Toolkits Market Analysis By Process Area | Source: Fact.MR
Thermal processing is estimated to lead because plants can easily track temperature, fuel use, and heat loss. Utility systems such as boilers, compressed air, chilled water, and power supply affect several production lines. Cleaning systems also use water, heat, and chemicals, making them an important part of plant efficiency.
How does Delivery shape demand?
Software toolkit is anticipated to capture 30.0% share in 2026.
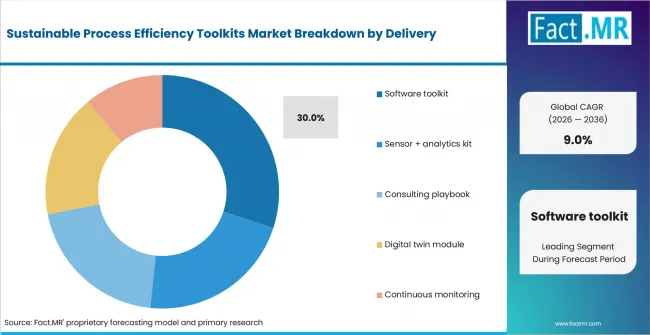
Sustainable Process Efficiency Toolkits Market Analysis By Delivery | Source: Fact.MR
Software toolkits are forecast to lead because companies can use the same calculations at different plants while using data from each location. Sensor and data tools help plants collect better measurements and find where problems occur. Consulting guides are useful when expert knowledge is needed to review plant processes. Digital models help teams test different operating conditions before making changes, while continuous monitoring helps find drops in efficiency quickly. In May 2025, Emerson released AspenTech v15 with more than 175 sample models for sustainability uses [7].
What supports kWh/unit within the KPI segment?
kWh/unit is forecast to hold 36.0% share in 2026.
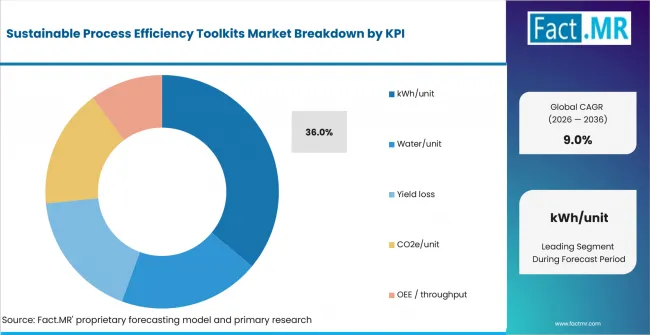
Sustainable Process Efficiency Toolkits Market Analysis By Kpi | Source: Fact.MR
kWh per unit is projected to lead because it shows how much energy is used for each unit produced. Plant staff can track this number over time and check whether changes in production reduce energy use. Water per unit works in the same way for processes that use large amounts of water. Yield loss shows how much material does not become a saleable product, while CO2e per unit shows emissions for each unit produced.
What is accelerating Sustainable Process Efficiency Toolkits Market adoption, and what is holding it back?
Better tracking of energy and resource costs is increasing the use of these tools, while missing data, system setup work, and difficulty in measuring actual savings can slow their use.
Drivers Impact Analysis
| DRIVER | (~) % IMPACT ON CAGR | GEOGRAPHIC RELEVANCE | IMPACT TIMELINE |
|---|---|---|---|
| Plant-level energy visibility | +1.4% | Global | Short term (<= 2 years) |
| Water and material loss reduction | +1.1% | Global | Medium term (2-4 years) |
| Digital twins for process improvement | +0.9% | North America, Europe, East Asia | Medium term (2-4 years) |
| Carbon intensity tracking by unit | +0.7% | Europe, North America | Medium term (2-4 years) |
| Continuous monitoring of efficiency drift | +0.5% | Global | Long term (>= 4 years) |
Opportunity Impact Analysis
| OPPORTUNITY | (~) % IMPACT ON CAGR | GEOGRAPHIC RELEVANCE | IMPACT TIMELINE |
|---|---|---|---|
| Cross-site software standardization | +0.8% | Global | Medium term (2-4 years) |
| Sensor retrofit packages for brownfield plants | +0.7% | Global | Short term (<= 2 years) |
| Heat recovery screening and simulation | +0.6% | Europe, East Asia | Medium term (2-4 years) |
| Integration with plant data platforms | +0.4% | North America, Europe | Long term (>= 4 years) |
Restraints Impact Analysis
| RESTRAINT | (~) % IMPACT ON CAGR | GEOGRAPHIC RELEVANCE | IMPACT TIMELINE |
|---|---|---|---|
| Incomplete submetering and data quality | -0.7% | Global | Short term (<= 2 years) |
| Integration effort across legacy systems | -0.6% | Global | Medium term (2-4 years) |
| Difficulty attributing savings to one action | -0.5% | Global | Medium term (2-4 years) |
| Limited plant engineering capacity | -0.4% | North America, Europe, East Asia | Long term (>= 4 years) |
Which countries are scaling the Sustainable Process Efficiency Toolkits Market through 2036?
- Japan is projected to keep a 0.4-point lead over the United States. Continued attention to manufacturing energy efficiency supports this position.
- The United States is forecast to remain 0.3 points ahead of Germany. Formal plant energy programs keep measurement and improvement tools visible across manufacturing sites.
- Germany is estimated to hold a 0.3-point advantage over France. High industrial energy use keeps efficiency work closely tied to operating cost and process control.
- France is anticipated to stay 0.3 points above the United Kingdom. Industrial energy reduction and carbon tracking remain active operating priorities.
- The United Kingdom is projected to close the range. Further efficiency gains increasingly depend on process improvement within a lower-energy industrial base.
Comparable CAGRs create different entry conditions because plant energy intensity, production mix and policy pressure vary by country. Full report coverage includes North America, Latin America, Western Europe, Eastern Europe, East Asia, South Asia & Pacific, and Middle East & Africa.
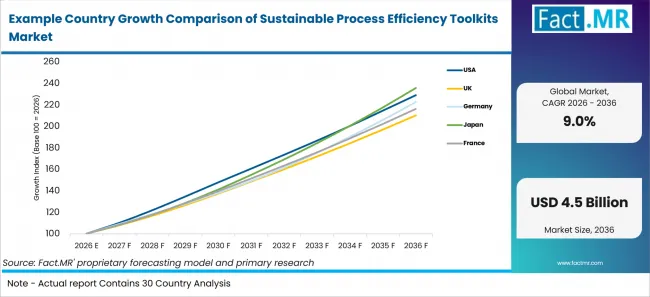
Example Country Growth Comparison Of Sustainable Process Efficiency Toolkits Market | Source: Fact.MR
| Country | CAGR (2026-2036) |
|---|---|
| Japan | 9.0% |
| United States | 8.6% |
| Germany | 8.3% |
| France | 8.0% |
| United Kingdom | 7.7% |
What supports Japan adoption?
9.0% CAGR, supported by continued focus on industrial energy productivity.
Japanese plants regularly track energy use to improve efficiency. In June 2025, the Agency for Natural Resources and Energy reported that final energy use was about 300 million kiloliters of crude-oil equivalent in fiscal 2023 [4].
How is the United States scaling demand?
8.6% CAGR, supported by structured industrial energy management and plant analytics.
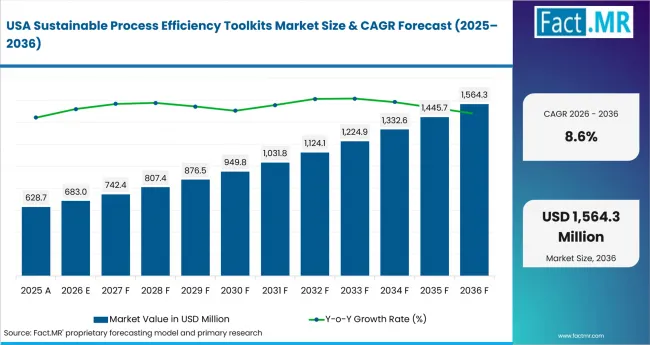
Sustainable Process Efficiency Toolkits Market Country Value Analysis | Source: Fact.MR
Energy management is already common at many U.S. manufacturing plants. In December 2025, the U.S. Energy Information Administration reported that more than 40% of manufacturing sites took part in general energy management activities [2].
What supports Germany’s outlook?
8.3% CAGR, shaped by high industrial energy use and continued efficiency pressure.
High energy use makes plant efficiency important for controlling production costs in Germany. In November 2025, the Federal Statistical Office reported that German industry used 3,343 petajoules of energy in 2024 [3]. This level of energy use increases the focus on tracking energy use, checking heat losses, and improving utility systems based on production output.
How does France perform?
8.0% CAGR, supported by lower industrial energy use and tighter resource tracking.
French plants continue to track energy and other resources used in production. In its 2026 energy statistics, the Service des données et études statistiques reported that industrial energy use, adjusted for weather conditions, reached 274 TWh in 2025 [5]. This level of use supports tracking energy per unit, finding ways to reuse waste heat, and measuring emissions based on production output.
What is supporting the United Kingdom’s adoption?
7.7% CAGR, supported by long-run industrial energy intensity improvement.
UK manufacturers continue to improve how much they produce from the energy they use. In September 2026, the Department for Energy Security and Net Zero reported that industrial energy use reached 17.3 million tonnes of oil equivalent in 2025 [6]. This level of energy use encourages plants to compare energy use with production and check how specific changes affect performance.
Who leads the Sustainable Process Efficiency Toolkits Market?
Competition includes automation companies that help plants connect measurement, control, data analysis, and daily operations.
Siemens and Schneider Electric offer automation and energy management systems, while Honeywell and Emerson provide process and industrial software solutions. ABB combines automation with digital tools, and Rockwell Automation connects plant data with energy and production systems.
In May 2025, ABB India and Steel Authority of India Limited signed an agreement to develop data-based digital models for blast furnaces and steelmaking at Rourkela Steel Plant [8]. These models provide plant data that can help improve efficiency and production performance.
Which companies are the key providers?
Key companies include Siemens; Schneider Electric; Honeywell; Emerson; ABB; and Rockwell Automation.
- Siemens
- Schneider Electric
- Honeywell
- Emerson
- ABB
- Rockwell Automation
Bibliography
- [1] U.S. Department of Energy. (2025, March). Better Plants Program Infographic.
- [2] U.S. Energy Information Administration. (2025, December 17). Final results for energy management activities and establishment counts from the 2022 Manufacturing Energy Consumption Survey (MECS) are now available.
- [3] Statistisches Bundesamt (Destatis). (2025, November 14). Energieverbrauch der Industrie 2024 um 1,9 % gestiegen [Industrial energy consumption increased by 1.9% in 2024].
- [4] Agency for Natural Resources and Energy, Ministry of Economy, Trade and Industry. (2025, June). Energy White Paper 2025 (Summary): FY2024 Annual Report on Energy.
- [5] Service des données et études statistiques. (2026, September 30). Chiffres clés de l'énergie – Édition 2026 [Key Energy Figures – 2026 Edition].
- [6] Department for Energy Security and Net Zero. (2026, September 24). Energy Consumption in the UK (ECUK) 2026.
- [7] Emerson. (2025, May 13). Emerson Enhances Optimization Capabilities to Drive Operational Excellence.
- [8] ABB. (2025, May 22). Steel Authority of India Limited signs digital transformation agreement with ABB.
This Report Answers
- The report explains how sustainable process efficiency toolkits are sold by toolkit module, process area, delivery model and KPI.
- Segment analysis identifies the subsegment that leads each category and the operating reason behind its 2026 share.
- Country analysis compares Japan, the United States, Germany, France and the United Kingdom through industrial energy and process-efficiency mechanisms.
- Competitive analysis reviews automation and industrial software suppliers that provide measurement, analytics, digital twin and improvement tools.
- Technology analysis assesses how software, sensors, digital twins and continuous monitoring connect resource use with plant performance.
What does the Sustainable Process Efficiency Toolkits Market cover?
The market covers practical plant packages that combine measurement, analysis and operating guidance for resource efficiency. Related workflows overlap with industrial automation and control systems when plant data feeds operating decisions. smart factory technologies provide a related environment for connected production data. predictive maintenance tools use many of the same plant signals to improve equipment performance and resource use.
The assessment recognizes adjacent use of digital twin sensors when a toolkit depends on real-time measurements. virtual commissioning tools can support scenario testing before plant changes move into operation.
What is included in the scope?
The scope includes software calculators, dashboards, sensor bundles, consulting playbooks and digital twin modules used to identify and verify efficiency actions. industrial water treatment solutions connect directly with water optimization where resource use is measured against production. digital decarbonization solutions overlap with plant carbon accounting and emissions tracking. digital twin platforms support model-based process reviews where operating conditions change over time.
Continuous monitoring is included when it is used to detect efficiency drift or verify improvement. current sensors can supply electrical measurements for energy mapping and equipment-level tracking. industrial metrology systems provide a related measurement layer where process quality and resource efficiency must be reviewed together.
What is excluded from the scope?
The revenue boundary focuses on toolkits and software sold as measured efficiency offerings. Stand-alone boilers, furnaces, pumps, motors and heat exchangers remain part of core production equipment when sold as equipment. General ESG platforms centered on corporate reporting sit outside the plant-optimization scope. Simple meters that display readings alone sit outside the toolkit boundary. Full engineering and construction projects remain outside the revenue boundary unless a distinct toolkit or software package is sold.
How Was the Analysis Built?
The analysis draws on 120+ sources, 35+ company portfolios, 25+ countries, and more than 20 industry interviews.
- Primary Research: Primary research includes discussions with manufacturers, service providers, technology developers, distributors, end users, and subject-matter experts. These conversations examine purchasing priorities, product adoption, operational challenges, approval requirements, competitive positioning, and the factors that influence wider market acceptance.
- Desk Research: Desk research covers government statistics, regulatory publications, company filings, trade data, technical studies, industry associations, standards, public policy, and other authoritative sources. Every source used in the analysis is documented in the bibliography.
- Market Sizing and Forecasting: Market estimates combine historical performance, demand indicators, pricing and volume trends, segment shares, company participation, country-level growth, adoption patterns, investment activity, and barriers to market expansion.
- Data Validation and Update Cycle: Findings are validated by comparing primary interviews with public data, company activity, regulatory changes, trade patterns, and industry developments. Regular updates review new product launches, capacity changes, partnerships, approvals, and shifts in commercial adoption.
What is the report’s scope and coverage?
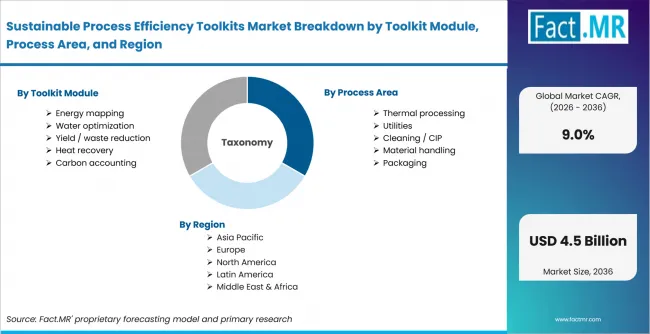
Sustainable Process Efficiency Toolkits Market Breakdown By Toolkit Module, Process Area, And Region | Source: Fact.MR
| Attribute | Details |
|---|---|
| Quantitative Units | USD billion |
| Market Definition | Integrated software, sensor, analytics and operating-guidance packages used by plants to measure and improve process resource efficiency. The scope covers energy, water, yield, heat recovery, carbon and throughput-oriented toolkits used in plant operations. |
| Toolkit Module | Energy mapping; Water optimization; Yield / waste reduction; Heat recovery; Carbon accounting |
| Process Area | Thermal processing; Utilities; Cleaning / CIP; Material handling; Packaging |
| Delivery | Software toolkit; Sensor + analytics kit; Consulting playbook; Digital twin module; Continuous monitoring |
| KPI | kWh/unit; Water/unit; Yield loss; CO2e/unit; OEE / throughput |
| Regions Covered | North America; Latin America; Western Europe; Eastern Europe; East Asia; South Asia & Pacific; Middle East & Africa |
| Countries Covered | Japan; United States; Germany; France; United Kingdom |
| Key Companies Profiled | Siemens; Schneider Electric; Honeywell; Emerson; ABB; Rockwell Automation |
| Forecast Period | 2026 to 2036 |
| Approach | Hybrid top-down and bottom-up approach using industrial efficiency program activity; automation and software portfolio review; resource-intensity indicators; country growth; and primary interviews. |
How is the market segmented?
-
By Toolkit Module:
- Energy mapping
- Water optimization
- Yield / waste reduction
- Heat recovery
- Carbon accounting
-
By Process Area:
- Thermal processing
- Utilities
- Cleaning / CIP
- Material handling
- Packaging
-
By Delivery:
- Software toolkit
- Sensor + analytics kit
- Consulting playbook
- Digital twin module
- Continuous monitoring
-
By KPI:
- kWh/unit
- Water/unit
- Yield loss
- CO2e/unit
- OEE / throughput
-
By Region:
- North America
- Latin America
- Western Europe
- Eastern Europe
- East Asia
- South Asia & Pacific
- Middle East & Africa