- Market Value (2025): USD 460.9 Mn
- Estimated Value (2026): USD 530.0 Mn
- Forecast Value (2036): USD 2144.0 Mn
- CAGR (2026-2036): 15.0%
What is the Sweet Perception Powders Market forecast to be worth by 2036?
USD 530.0 million in 2026 to USD 2,144.0 million by 2036 at 15.0% CAGR.
- The Sweet Perception Powders Market was valued at USD 460.9 million in 2025.
- Demand is projected to increase from USD 530.0 million in 2026 to USD 2,144.0 million by 2036.
- The market is forecast to record 15.0% CAGR from 2026 to 2036 as confectionery brands and beverage formulators shift taste design closer to nutrition reformulation.
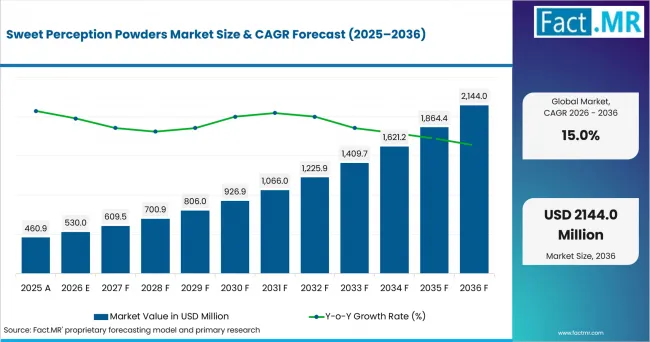
Sweet Perception Powders Market Value Analysis | Source: Fact.MR
What are the defining numbers behind Sweet Perception Powders Market growth?
USD 1,614.0 million absolute opportunity by 2036, led by cocoa alternatives, flavor delivery and confectionery.
- Demand Drivers in the Market
- Food brands need sweetness cues that survive sugar reduction. The FDA proposed a front-of-package Nutrition Info box in January 2025 that covers three nutrients including added sugars.
- Retail channels give reformulated sweets a wide test base. The U.S. Census Bureau reported July 2026 retail and food services sales of USD 763.6 billion.
- Confectionery developers need cocoa-like flavor depth when cocoa exposure makes recipe cost harder to control. Perception powders help rebuild brown notes while preserving the full product format.
- Beverage formulators need dry flavor systems that support sweetness and mouthfeel in mixes. Powdered formats are easier to dose across instant drinks and nutrition products.
- Key Segments Analyzed
- By Product: Cocoa alternatives are expected to hold 37.0% share in 2026 since cocoa-price exposure keeps replacement work active in sweet goods.
- By Function: Flavor delivery is projected to account for 35.0% share in 2026 due to its direct role in carrying sweet aroma and chocolate cues.
- By Application: Confectionery is anticipated to capture 39.0% share in 2026 given its heavy exposure to cocoa and sugar perception.
- By Form: Powder is estimated to represent 48.0% share in 2026. Dry handling supports premixes, fillings and beverage systems with lower handling complexity.
- Analyst Opinion at Fact.MR
- Shambhu Nath Jha, Principal Consultant at Fact.MR, states, “Sweetness is becoming a design problem rather than a simple sugar question. The market is expected to gain value where brands reduce sugar or cocoa and still need a familiar eating experience. Suppliers that combine sensory mapping, masking depth and powder handling data are positioned to win repeat formulation work.”
- Strategic Implications
- Flavor houses should document how powders change onset, linger and mouthfeel across each application format.
- Confectionery brands should pair cocoa alternatives with color and bitterness control before changing mainstream recipes.
- Beverage teams should test powder dispersion and aftertaste under storage conditions that match the finished drink format.
- Ingredient suppliers should build reformulation packs around in September 2025, Kerry launched Smart Taste™, which includes Tastesense™ Sweetness solutions capable of supporting up to 100% sugar reduction.
The USA is projected to post 16.5% CAGR through label-led reformulation and sweet snack manufacturing depth. Germany is expected to record 15.8% CAGR driven by chocolate-price exposure. Japan is forecast to reach 14.7% CAGR with premium taste expectations. France is anticipated to advance at 14.1% CAGR supported by sugar-tax effects. Brazil is estimated to reach 13.5% CAGR where cocoa cost pressure meets front-label sugar rules.
How does the Sweet Perception Powders Market break down by segment?
Cocoa alternatives lead Product at 37.0%; Powder leads Form at 48.0%.
Which Product dominates?
Cocoa alternatives are expected to hold 37.0% share in 2026.
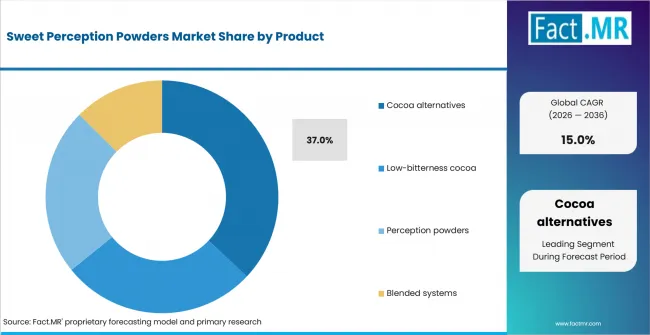
Sweet Perception Powders Market Analysis By Product | Source: Fact.MR
Cocoa alternatives lead because chocolate flavor is exposed to raw-material cost and sensory expectation at the same time. Perception powders help formulators rebuild cocoa aroma and bitterness balance when recipes use lower cocoa solids or blended systems.
The segment also benefits from color and aftertaste control. A cocoa-like powder must hold flavor release after processing and storage, especially in filled chocolates, coatings and bakery inclusions.
What leads the Function segment?
Flavor delivery is projected to account for 35.0% share in 2026.
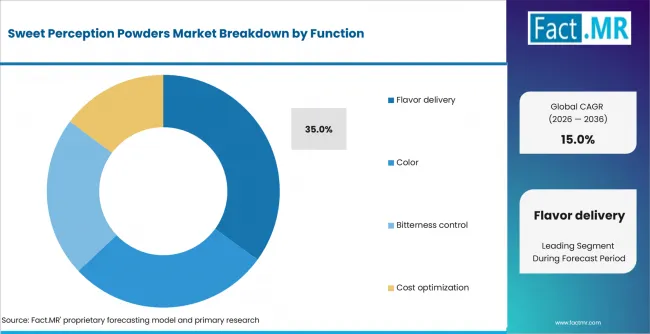
Sweet Perception Powders Market Analysis By Function | Source: Fact.MR
Flavor delivery leads because sweet perception depends on aroma timing as much as sweetener intensity. Powdered delivery systems are used to release sweet, brown and creamy notes at the point of eating.
Tate & Lyle PLC launched its Sensation precision sensory formulation tool in Asia-Pacific in September 2025. Tate & Lyle PLC positioned the tool around mouthfeel and sensory design.
How does Application shape demand?
Confectionery is anticipated to capture 39.0% share in 2026.
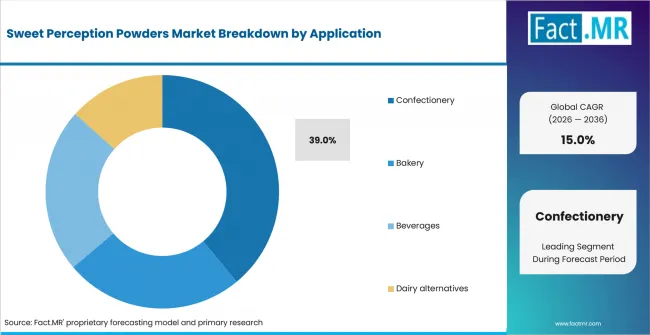
Sweet Perception Powders Market Analysis By Application | Source: Fact.MR
Confectionery leads because shoppers judge sweetness, chocolate depth and aftertaste in the first bite. Small defects are easier to detect in bars, coatings, fillings and sugar confectionery.
Powders used in confectionery need heat stability and even distribution. They also need compatibility with fat systems, starch bases and fillings that can change flavor release during storage.
What supports Powder within Form?
Powder is estimated to represent 48.0% share in 2026.
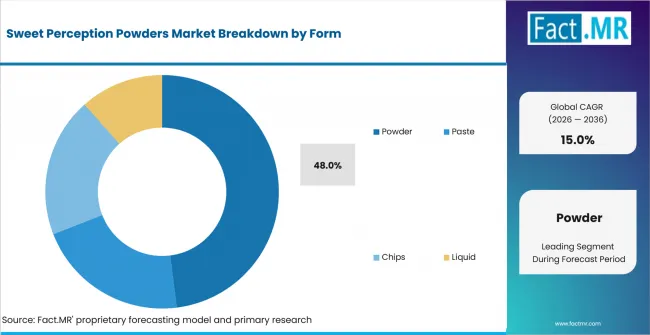
Sweet Perception Powders Market Analysis By Form | Source: Fact.MR
Powder leads because dry forms are easier to dose in beverage mixes, bakery premixes and confectionery fillings. They support repeatable handling in plants that already work with powdered flavors and carriers.
The form is also practical for global supply chains. Moisture control, flow behavior and carrier choice remain central approval factors where powders face humid storage or warm transport routes.
What is accelerating Sweet Perception Powders Market adoption, and what is holding it back?
Demand is expected to rise through sugar reduction, cocoa replacement and flavor masking. Adoption is constrained by taste validation and label review.
Drivers Impact Analysis
| DRIVER | (~) % IMPACT ON CAGR | GEOGRAPHIC RELEVANCE | IMPACT TIMELINE |
|---|---|---|---|
| Sugar reduction with familiar sweetness cues | +1.8% | North America, Europe | Short term (<= 2 years) |
| Cocoa replacement in cost-sensitive confectionery | +1.5% | Global | Medium term (2-4 years) |
| Powder handling in beverages and bakery mixes | +1.0% | North America, East Asia | Medium term (2-4 years) |
| Taste masking for plant-based and dairy alternatives | +0.8% | Europe, East Asia | Long term (>= 4 years) |
Source: Fact.MR analysis. Updated Aug 31, 2026
- Sugar reduction with familiar sweetness cues: Brands value powders that restore mouthfeel and sweetness onset after sucrose reduction.
- Cocoa replacement in cost-sensitive confectionery: Cocoa alternatives are expected to gain trial activity when manufacturers need chocolate-like flavor depth with reduced cocoa dependence.
- Powder handling in beverages and bakery mixes: Dry formats are anticipated to support dosing accuracy across premixes, instant beverages and sweet baked products.
- Taste masking for plant-based and dairy alternatives: Masking powders are expected to help brands manage cereal, nut and protein notes in sweet applications.
Opportunity Impact Analysis
| OPPORTUNITY | (~) % IMPACT ON CAGR | GEOGRAPHIC RELEVANCE | IMPACT TIMELINE |
|---|---|---|---|
| Cocoa-alternative systems for mass confectionery | +1.4% | North America, Europe, Latin America | Medium term (2-4 years) |
| Sweetness design in low-sugar beverages | +1.1% | Europe, East Asia | Short term (<= 2 years) |
| Powdered blends for dairy alternatives | +0.7% | Global | Long term (>= 4 years) |
Source: Fact.MR analysis. Updated Aug 31, 2026
- Cocoa-alternative systems for mass confectionery: The primary opportunity is concentrated in powders that deliver color, bitter balance and cocoa-like aroma together.
- Sweetness design in low-sugar beverages: Beverage reformulation is expected to favor systems that rebuild mouthfeel after sugar reduction and reduce sweetener aftertaste.
- Powdered blends for dairy alternatives: Dairy alternative brands are projected to use perception powders where plant bases need sweetness lift and flavor masking.
Restraints Impact Analysis
| RESTRAINT | (~) % IMPACT ON CAGR | GEOGRAPHIC RELEVANCE | IMPACT TIMELINE |
|---|---|---|---|
| Sensory validation time by application | -0.6% | Global | Short term (<= 2 years) |
| Label and additive review across countries | -0.5% | Europe, Latin America | Medium term (2-4 years) |
| Heat and humidity stability limits | -0.4% | South Asia & Pacific, Latin America | Long term (>= 4 years) |
Source: Fact.MR analysis. Updated Aug 31, 2026
- Sensory validation time by application: Each powder needs testing in the finished food matrix. Chocolate, beverage and bakery systems expose different sweetness defects.
- Label and additive review across countries: Regional sweetener and flavor rules can lengthen approval where powders combine carriers, flavors and masking materials.
- Heat and humidity stability limits: Warm distribution routes can affect flow and flavor release, so tropical applications need stronger shelf-life evidence.
Which countries are scaling the Sweet Perception Powders Market through 2036?
- The country comparison spans 3.0 percentage points and forms three practical growth bands across the forecast period.
- The USA remains 0.7 percentage point above Germany through label-led reformulation and sweet snack manufacturing depth.
- Germany remains 1.1 percentage points above Japan as chocolate-price pressure supports cocoa-alternative testing.
- Japan remains 0.6 percentage point above France through precise taste expectations and premium confectionery occasions.
- France remains 0.6 percentage point above Brazil as sweetened-drink taxation supports sugar-reduction work.
- Brazil closes the displayed range through chocolate-price pressure and front-label sugar thresholds.
Comparable CAGRs create different entry conditions due to cocoa exposure, label rules, sweetness preference and powder-handling readiness. Full report coverage includes North America, Latin America, Western Europe, Eastern Europe, East Asia, South Asia & Pacific, Middle East & Africa.
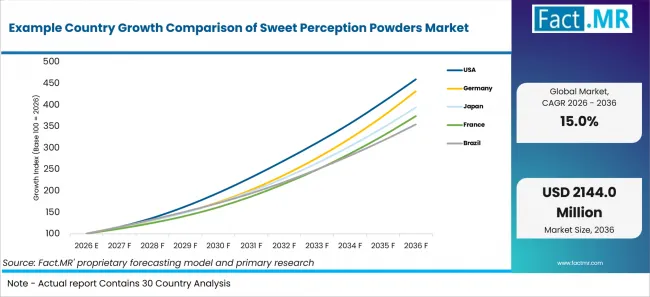
Example Country Growth Comparison Of Sweet Perception Powders Market | Source: Fact.MR
| Country | CAGR (2026-2036) |
|---|---|
| USA | 16.5% |
| Germany | 15.8% |
| Japan | 14.7% |
| France | 14.1% |
| Brazil | 13.5% |
Source: Fact.MR analysis. Updated Aug 31, 2026
What supports USA adoption?
16.5% CAGR, shaped by sugar-label reformulation and confectionery output.
U.S. adoption is anchored in packaged-food reformulation where added sugar visibility and familiar sweetness both influence brand decisions. FDA proposed a front-of-package Nutrition Info box that would display saturated fat, sodium and added sugars on most packaged foods if finalized. Sweet perception powders to support confectionery, beverages and bakery products that need lower sugar exposure while keeping a familiar taste profile.
How is Germany scaling demand?
15.8% CAGR, supported by chocolate-price pressure and controlled additive use.
Destatis reported in January 2026 that chocolate prices in Germany were 18.9% higher year over year in December 2025. The price increase as a relevant cost signal for cocoa-alternative and flavor-delivery testing in confectionery, bakery and dairy-alternative applications.
How does Japan perform?
14.7% CAGR, led by precise taste expectations and premium treat occasions.
Japan’s market is shaped by careful sensory expectations in sweet foods and beverages. The Statistics Bureau of Japan reported that, for two-or-more-person households, average monthly consumption expenditure per household was JPY 314,001 in 2025. Premium snacks, seasonal chocolate and instant beverage formats to support powders that refine sweetness onset and reduce bitterness while preserving product identity.
What supports France’s growth?
14.1% CAGR, backed by sugar-tax effects and nutrition-quality agreements.
INSEE reported that prices of sugar, jam, honey, chocolate and confectionery were 6.1% higher year over year in April 2025; the same release reported an 8.0% increase in soft-drink prices following an increase in taxation of sweetened drinks. These reformulation pressures to remain relevant to sweet-perception systems.
How does Brazil build adoption?
13.5% CAGR, driven by chocolate-price exposure and front-label sugar rules.
Brazil’s adoption path is tied to affordable treats and sugar-label thresholds. IBGE reported in January 2026 that prices for chocolate bars and chocolate candies rose 27.12% over 2025. Cocoa-stretching and sweetness-modulation powders to gain trials where mass confectionery brands need flavor stability across warm distribution routes.
Who leads the Sweet Perception Powders Market?
The competitive set profiled in this report includes Kerry Group plc, IFF, Givaudan SA, Symrise AG, Sensient Technologies Corporation and Tate & Lyle PLC. Kerry’s Smart Taste and Tastesense technologies and Tate & Lyle PLC’s Sensation and Yume platforms are directly documented company sources.
Tate & Lyle PLC and Manus launched Yume™ on February 23, 2026 under The Sweetener Alliance. The first product is Yume™ M Stevia Sweetener, a stevia-derived sweetener produced through an all-Americas supply chain.
Which companies are the key providers?
Key companies include Kerry Group plc; IFF; Givaudan SA; Symrise AG; Sensient Technologies Corporation; and Tate & Lyle PLC.
- Kerry Group plc
- IFF
- Givaudan SA
- Symrise AG
- Sensient Technologies Corporation
- Tate & Lyle PLC
Bibliography
- U.S. Food and Drug Administration. (2025, January 14). FDA proposes requiring at-a-glance nutrition information on the front of packaged foods.
- U.S. Census Bureau. (2026, August 14). Advance monthly sales for retail and food services.
- Kerry. (2025, September 30). Kerry launches Smart Taste™ to help customers navigate market complexities without compromising on taste.
- Tate & Lyle. (2025, September 4). Tate & Lyle launches breakthrough formulation tool in Asia-Pacific to unlock full potential of mouthfeel.
- Tate & Lyle. (2026, February 23). Introducing Yume™: A new standard for sweetness.
- Statistics Bureau of Japan. (2026, February 6). 2025 yearly average.
- Institut national de la statistique et des études économiques. (2025, May 15). In April 2025, consumer prices rose by 0.6% over one month and by 0.8% year on year.
- Instituto Brasileiro de Geografia e Estatística. (2026, January 9). IPCA reaches 0.33% in December and closes the year at 4.26%.
- Agência Nacional de Vigilância Sanitária. (2021, April 27). Rotulagem nutricional [Nutritional labeling].
This Report Answers
- The report explains where sweet perception powders are used across product, function, application and form. It also covers regional adoption patterns.
- Segment analysis identifies the leading subsegments and the practical reasons that formulators prioritize them.
- Country analysis examines the listed markets and the regulation or price mechanisms supporting reformulation.
- Competitive analysis reviews current providers across taste modulation, flavor delivery, sweetening and color systems.
- Application analysis assesses how sweetness onset, bitterness control and powder handling influence buyer decisions.
What does the Sweet Perception Powders Market cover?
The Sweet Perception Powders Market covers powdered ingredient systems that alter sweetness perception, cocoa impression and flavor balance in finished foods. It is adjacent to sugar reduction taste optimization systems, sweetness modulators and cocoa-free chocolate alternatives where formulation work centers on taste recovery.
The assessment includes powders used in confectionery, beverages, bakery and dairy alternatives. These areas need repeatable taste delivery because small sensory shifts can change brand acceptance during reformulation. It also connects to food flavor systems and natural sweetener blends where sweetness profile and mouthfeel need to work together.
What is included in the scope?
The scope includes cocoa-alternative powders, low-bitterness cocoa systems, perception powders and blended systems sold for food-grade use. It covers powders designed for pilot batches, plant trials and commercial recipes where taste performance must be repeated across lots. It includes ingredients used with artificial sweeteners, food sweeteners and flavor carriers where the powder changes taste release.
It includes flavor delivery systems, bitterness control systems, color-support powders and dry blends used by confectionery, bakery, beverage and dairy alternative brands. Related flavors and fragrances capabilities are considered only when they serve food taste performance.
What is excluded from the scope?
The scope excludes table-top sweeteners, bulk sugar, raw cocoa beans and stand-alone flavor compounds sold for a purpose outside sweetness or cocoa perception. Wider food additives are excluded when they serve preservation, acid control or texture for functions outside taste perception.
Finished chocolate bars, finished beverages and generic standardized flavor systems are excluded unless the product is sold as a powder input for sweetness, bitterness or cocoa-cue design.
How Was the Analysis Built?
The analysis draws on 120+ sources, 35+ company portfolios, 25+ countries, and more than 20 industry interviews.
- Primary Research: Primary research includes discussions with manufacturers, ingredient developers, distributors, brand teams and subject-matter experts. These conversations examine approval needs, sensory targets, formulation barriers and wider market acceptance.
- Desk Research: Desk research covers government statistics, regulatory publications, company filings, trade data, technical studies, standards, public policy and other authoritative sources. Every source used in the analysis appears in the bibliography.
- Market Sizing and Forecasting: Market estimates combine historical performance, pricing trends, segment shares, company participation, country-level growth, application patterns and barriers to expansion.
- Data Validation and Update Cycle: Findings are validated by comparing primary interviews with public data, company activity, regulatory changes and industry developments. Regular updates review launches, partnerships, approvals and commercial adoption shifts. The process checks whether the same sensory claim holds across confectionery, beverage, bakery and dairy alternative use.
Segmentation
What is the report’s scope and coverage?
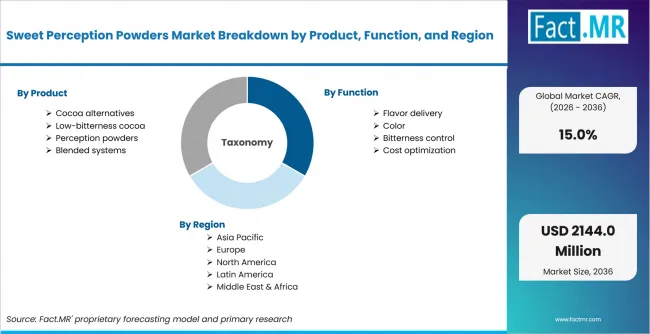
Sweet Perception Powders Market Breakdown By Product, Function, And Region | Source: Fact.MR
| Attribute | Details |
|---|---|
| Quantitative Units | USD million |
| Market Definition | Powdered ingredient systems used to enhance or redirect sweetness, cocoa impression, flavor delivery, bitterness control and mouthfeel in food and beverage reformulation. |
| Product | Cocoa alternatives; Low-bitterness cocoa; Perception powders; Blended systems |
| Function | Flavor delivery; Color; Bitterness control; Cost optimization |
| Application | Confectionery; Bakery; Beverages; Dairy alternatives |
| Form | Powder; Paste; Chips; Liquid |
| Regions Covered | North America; Latin America; Western Europe; Eastern Europe; East Asia; South Asia & Pacific; Middle East & Africa |
| Countries Covered | USA; Germany; Japan; France; Brazil |
| Key Companies Profiled | Kerry Group plc; IFF; Givaudan SA; Symrise AG; Sensient Technologies Corporation; Tate & Lyle PLC |
| Forecast Period | 2026 to 2036 |
| Approach | Hybrid top-down and bottom-up approach using sweetener reformulation, cocoa replacement work, application testing, country indicators and company portfolio review. |
Source: Fact.MR analysis. Updated Aug 31, 2026
How is the market segmented?
-
By Product:
- Cocoa alternatives
- Low-bitterness cocoa
- Perception powders
- Blended systems
-
By Function:
- Flavor delivery
- Color
- Bitterness control
- Cost optimization
-
By Application:
- Confectionery
- Bakery
- Beverages
- Dairy alternatives
-
By Form:
- Powder
- Paste
- Chips
- Liquid
-
By Region:
- North America
- Latin America
- Western Europe
- Eastern Europe
- East Asia
- South Asia & Pacific
- Middle East & Africa
Frequently Asked Questions
How big is the sweet perception powders market in 2026?
What is the CAGR of the sweet perception powders market from 2026 to 2036?
Which product leads the sweet perception powders market?
Which function leads the sweet perception powders market?
Who are the leading companies in the sweet perception powders market?
Who worked on this report


Preview the report firsthand - request a free sample
Free SampleGet the brochure for pricing and purchase details
Download PDF