- Market Value (2025): USD 33.2 Mn
- Estimated Value (2026): USD 40.0 Mn
- Forecast Value (2036): USD 260.0 Mn
- CAGR (2026-2036): 20.6%
What is the Zero Carbon NPG Market forecast to be worth by 2036?
USD 40.0 million in 2026 to USD 260.0 million by 2036, at 20.6% CAGR.
- The low-footprint NPG market reached a valuation of USD 33.2 million in 2025, supported by early commercial use alongside conventional NPG supply.
- Demand is projected to increase from USD 40.0 million in 2026 to USD 260.0 million by 2036.
- The market is forecast to record a 20.6% CAGR from 2026 to 2036 as manufacturers adopt certified allocation, product-level carbon data and drop-in grades for polyester production.
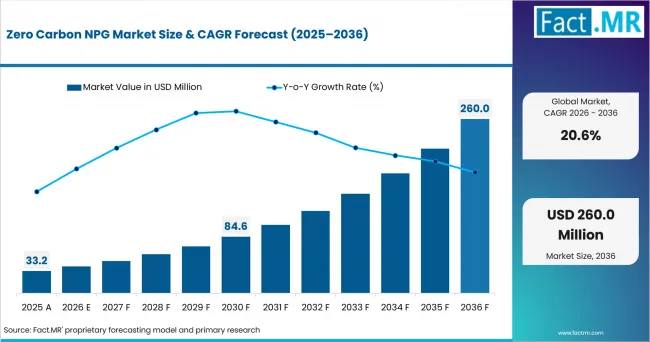
Zero Carbon Npg Market Value Analysis | Source: Fact.MR
What are the defining numbers behind Zero Carbon NPG Market growth?
USD 220.0 million absolute opportunity by 2036, led by Powder coating polyesters and Mass-balanced renewable within their respective segments.
- Demand Drivers in the Market
- Powder-coating polyester manufacturers are expected to lower the reported carbon footprint of a key raw material without changing their formula when the approved NPG grade has the same chemical properties as the standard one.
- Company Scope 3 programs are projected to increase requests for carbon data linked to each NPG product. Companies are also expected to ask for records that show where the material came from and how it moved through the supply chain.
- Mass balance is expected to help large chemical plants use renewable or bio-circular raw materials in their current production systems. The verified environmental value can then be assigned to a set amount of contracted NPG output.
- Key Segments Analyzed
- By Application Chemistry: Powder coating polyesters are expected to hold 44.0% share in 2026. NPG is widely used in saturated polyester resins where weather resistance and coating durability are specified.
- By Carbon Route: Mass-balanced renewable is projected to account for 37.0% share in 2026. The route uses controlled bookkeeping to assign renewable input through an integrated production network.
- By Certification Basis: ISCC PLUS is anticipated to capture 48.0% share in 2026 because its rules cover certified input and quantity bookkeeping for mass-balance claims.
- By Customer Industry: Coatings producers are estimated to represent 46.0% share in 2026 because NPG enters polyester and alkyd resin systems used in industrial coatings.
- By Supply Form: Bulk liquid is forecast to account for 51.0% share in 2026. Large resin plants use heated storage and tank delivery for continuous production.
- Analyst Opinion at Fact.MR
- Shambhu Nath Jha, Senior Analyst at Fact.MR, states, "The product gains value when its lower carbon impact is backed by clear proof, while the NPG molecule stays the same. Coating and resin manufacturers are expected to review how the carbon result was measured and how the claim was tracked through the supply chain. They will also look for test results showing that the approved grade performs like standard NPG."
- Strategic Implications
- NPG producers are expected to provide carbon records for each grade. These records should explain what the assessment covers, how energy use was counted, which raw material route was used and whether the product is certified.
- Coating manufacturers are putting checks in place to stop the same renewable claim from being used twice across different contracts or product lines.
- Resin formulators are likely to launch lower-carbon product ranges more quickly when the approved NPG grade passes their current raw-material tests and production checks.
- Distributors are expected to keep environmental declarations and batch records during storage and resale. These records show that the claimed benefit is linked to a clear and traceable product volume.
The United States is expected to register a 24.3% CAGR from 2026 to 2036 as coatings and materials manufacturers seek verified Scope 3 reductions in existing formulations. Germany is projected to grow at 22.2% over the same period as product carbon footprints enter industrial purchasing decisions. Sweden is anticipated to post 21.8%, followed by the Netherlands at 21.0% and Japan at 20.2%.
How does the Zero Carbon NPG Market break down by segment?
Powder coating polyesters are expected to lead Application Chemistry with 44.0% share in 2026. Mass-balanced renewable is projected to lead Carbon Route with 37.0% share.
Which application dominates?
Powder Coating Polyesters hold 44.0% share in 2026.
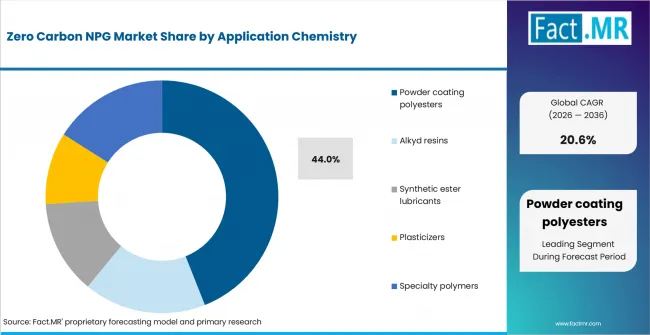
Zero Carbon Npg Market Analysis By Application Chemistry | Source: Fact.MR
Powder Coating Polyesters are expected to hold 44.0% share in 2026. NPG already has an established role in saturated polyester resins used for durable coating finishes. Resin manufacturers can introduce a lower-carbon grade without changing the basic chemistry or existing production process. This makes powder coatings a practical starting point for zero-carbon NPG adoption.
What leads the Carbon Route segment?
Mass-Balanced Renewable NPG accounts for 37.0% share in 2026.
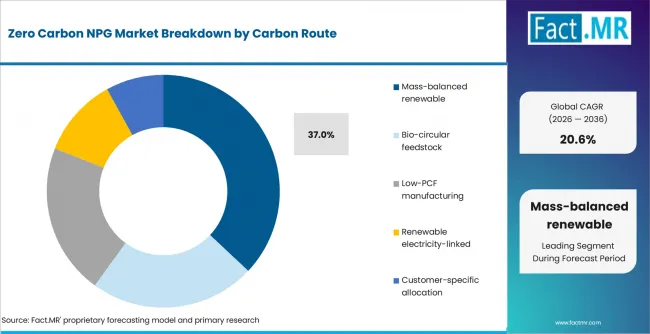
Zero Carbon Npg Market Analysis By Carbon Route | Source: Fact.MR
Mass-Balanced Renewable NPG is projected to account for 37.0% share in 2026. Renewable feedstock is assigned through audited quantity records at integrated production sites. The finished NPG keeps the same technical quality required for polyester and resin production. Manufacturers therefore gain a documented renewable claim without setting up a separate physical supply chain.
How does Certification Basis shape demand?
ISCC PLUS leads with 48.0% share in 2026.
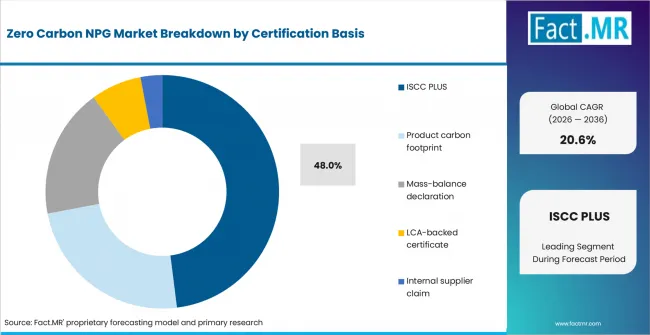
Zero Carbon Npg Market Analysis By Certification Basis | Source: Fact.MR
ISCC PLUS is anticipated to hold 48.0% share in 2026. The framework records renewable inputs, material quantities and mass-balance claims across the value chain. Standardized records give chemical producers, resin formulators and coatings manufacturers a common basis for checking the claimed carbon attribute. This clarity becomes important when the material passes through several companies before reaching the final coating.
Which customer industry holds the leading position?
Coatings Producers represent 46.0% share in 2026.
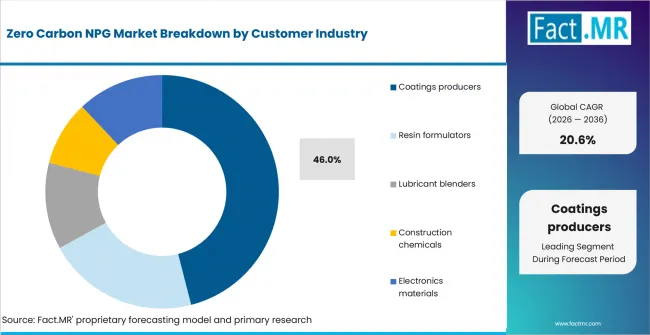
Zero Carbon Npg Market Analysis By Customer Industry | Source: Fact.MR
Coatings Producers are estimated to represent 46.0% share in 2026. Their polyester and alkyd formulations already consume NPG in established production lines. A lower-carbon input can be connected to a defined binder and tracked through product records. Large purchasing volumes and regular qualification programs also make this industry well placed for long-term certified supply agreements.
What leads the Supply Form segment?
Bulk Liquid holds 51.0% share in 2026.
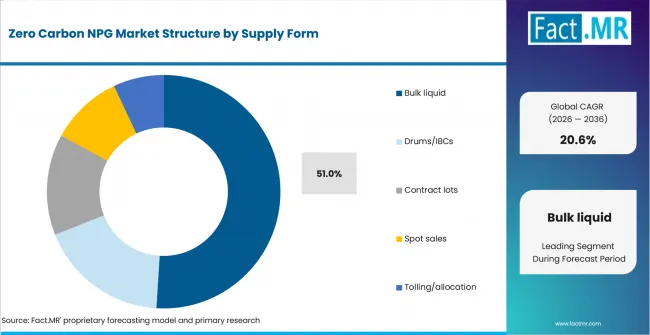
Zero Carbon Npg Market Analysis By Supply Form | Source: Fact.MR
Bulk Liquid is forecast to hold 51.0% share in 2026. Large resin plants commonly receive industrial chemicals through tank delivery and store them in heated systems for continuous production. The format reduces repeated packaging and supports contracted volumes across long manufacturing runs. Delivery records can also be matched with certification documents and carbon-allocation quantities.
What is accelerating Zero Carbon NPG Market adoption, and what is holding it back?
Adoption is expected to accelerate where chemically equivalent NPG carries a certified renewable attribute or a quantified product carbon footprint. Progress is anticipated to slow when manufacturers cannot compare assessment boundaries and allocation rules across competing offers.
Drivers Impact Analysis
| DRIVER | (~) % IMPACT ON CAGR | GEOGRAPHIC RELEVANCE | IMPACT TIMELINE |
|---|---|---|---|
| Purchased-material carbon targets | +3.1% | North America, Europe, Japan, and multinational supply chains | Short term (<= 2 years) |
| Drop-in chemistry | +2.7% | Global | Medium term (2-4 years) |
| Certified mass balance | +2.3% | Europe, United States, and Japan | Long term (>= 4 years) |
| Powder-coating portfolio differentiation | +1.9% | United States, Germany, and Japan | Medium term (2-4 years) |
| Renewable energy in production | +1.4% | Europe and regions with lower-carbon power access | Long term (>= 4 years) |
Source: Fact.MR analysis. Updated Jul 21, 2026
- Purchased-material carbon targets: Coatings and resin companies are examining upstream emissions that sit outside their own plants. A grade-level NPG footprint gives procurement teams a direct lever within an existing bill of materials.
- Drop-in chemistry: Mass-balanced and low-PCF NPG are expected to retain the chemical properties required by established polyester and alkyd processes. Avoiding a formulation change is projected to reduce the technical work needed to adopt the carbon attribute.
- Certified mass balance: Mass balance allows renewable and conventional feedstocks to share production infrastructure while controlled records assign sustainability characteristics to outputs. Independent certification makes that allocation more useful to downstream auditors and brand owners.
Opportunity Impact Analysis
| OPPORTUNITY | (~) % IMPACT ON CAGR | GEOGRAPHIC RELEVANCE | IMPACT TIMELINE |
| Customer-specific carbon allocation | +1.6% | Global contract markets | Short term (<= 2 years) |
|---|---|---|---|
| Certified powder-coating resin chains | +1.4% | United States, Germany, and Japan | Medium term (2-4 years) |
| Low-PCF lubricant esters | +1.2% | North America, Europe, and Japan | Long term (>= 4 years) |
| Auditable distributor programs | +1.0% | Fragmented regional markets | Medium term (2-4 years) |
Source: Fact.MR analysis. Updated Jul 21, 2026
- Customer-specific carbon allocation: Large customers are expected to request a dedicated quantity and carbon attribute linked to an annual purchasing agreement. Producers are projected to structure allocation and reconciliation around that demand without creating a separate plant.
- Certified powder-coating resin chains: NPG manufacturers and polyester resin producers are expected to align chain-of-custody records with powder-coating formulators. A coordinated offer is projected to give end users clearer evidence than an isolated upstream declaration.
- Low-PCF lubricant esters: Synthetic ester lubricant blenders already value NPG for demanding performance profiles. A documented carbon attribute is expected to create a specialty product tier where technical evidence and footprint records are reviewed together.
Restraints Impact Analysis
| RESTRAINT | (~) % IMPACT ON CAGR | GEOGRAPHIC RELEVANCE | IMPACT TIMELINE |
|---|---|---|---|
| Boundary mismatch | -1.4% | Global | Short term (<= 2 years) |
| Limited certified allocation | -1.1% | Global | Medium term (2-4 years) |
| Premium justification | -0.9% | Price-sensitive markets | Medium term (2-4 years) |
| Chain-of-custody complexity | -0.7% | Global multi-tier supply chains | Long term (>= 4 years) |
Source: Fact.MR analysis. Updated Jul 21, 2026
- Boundary mismatch: A zero cradle-to-gate footprint does not cover emissions from transport through end of life. Comparisons become unreliable when companies use different system boundaries or apply different treatment to biogenic carbon.
- Limited certified allocation: Renewable feedstock and lower-carbon energy need to be available before certified volumes are sold. Fast demand growth is anticipated to meet allocation limits even when conventional NPG capacity is sufficient.
- Premium justification: The molecule performs like standard NPG but carries added feedstock and certification costs. Customers without a carbon target are expected to find the price difference harder to justify.
Which countries are committing to zero-carbon NPG first?
A global growth rate is the weighted average of all markets covered in the study. For this reason, several countries can grow faster than the global rate. The five countries shown are examples, and comparing them with the global figure helps explain this difference.
- The United States holds the highest position due to stronger demand for verified cuts in emissions linked to purchased materials. Germany and Sweden form a close group. In both countries, product carbon data, renewable raw-material records and certification play an important role in buying decisions.
- The Netherlands follows close behind, with growth linked more strongly to chemical transport networks and certified distribution across Europe. Japan shows a slower pace. Manufacturers there place more importance on purity, steady supply and detailed testing before approving lower-carbon NPG.
- Countries with similar CAGRs can still develop in very different ways. These differences become important when comparing product approval, certification rules and supply readiness across each market.
The full report reviews these trends across every market included in the study. It provides country-level CAGR analysis for North America, Latin America, Europe, East Asia, South Asia, Oceania, and the Middle East and Africa.
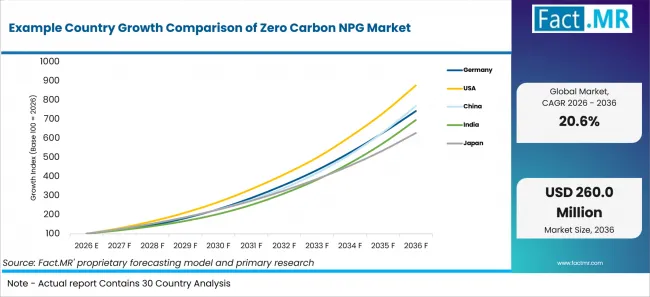
Example Country Growth Comparison Of Zero Carbon Npg Market | Source: Fact.MR
| COUNTRY | CAGR |
|---|---|
| United States | 24.3% |
| Germany | 22.2% |
| Sweden | 21.8% |
| Netherlands | 21.0% |
| Japan | 20.2% |
Source: Fact.MR analysis. Updated Jul 21, 2026
What is driving the United States growth through 2036?
24.3% CAGR, driven by Scope 3 reduction targets and product-level carbon data.
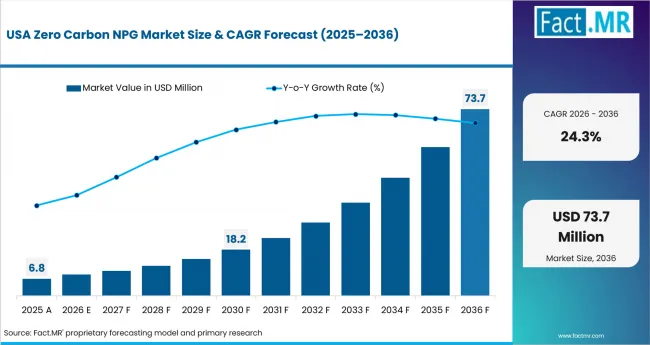
Zero Carbon Npg Market Country Value Analysis | Source: Fact.MR
United States coatings and materials manufacturers are reviewing purchased raw materials for measurable emissions reductions. Zero-carbon NPG offers a direct substitution route since the underlying molecule can remain unchanged. The market is expected to record a 24.3% CAGR by 2036 as contracted supply and audit-ready footprint records support qualification across polyester, alkyd and specialty-polymer production.
Why is Germany an early market for zero-carbon NPG?
22.2% CAGR, supported by carbon-footprint review and chain-of-custody controls.
German resin and coatings manufacturers increasingly assess carbon claims at product level instead of relying on broad neutrality statements. Procurement decisions place weight on recognized certification and clearly stated assessment boundaries. The market is projected to expand at a 22.2% CAGR from 2026 to 2036 as qualified NPG grades become linked with defined formulations and traceable material quantities.
What supports Sweden’s zero-carbon NPG outlook?
21.8% CAGR, owing to renewable feedstock integration and mass-balance supply.
Sweden benefits from an established base in bio-attributed polyols and renewable chemical inputs. This gives resin and coating producers a practical route to combine familiar NPG performance with documented renewable content. Demand is anticipated to post a 21.8% CAGR through 2036 as procurement teams compare feedstock origin, mass-balance records and cradle-to-gate carbon figures before approval.
What positions the Netherlands in certified NPG flows?
21.0% CAGR, backed by chemical logistics and European distribution links.
The Netherlands serves as an important movement point for regional and imported chemical supply through Rotterdam and connected inland routes. Certified NPG can pass from terminals and distributors into coating and resin plants across Europe. The market is estimated to record a 21.0% CAGR by 2036 as chain-of-custody records remain intact through storage, resale and cross-border delivery.
What shapes Japan’s zero-carbon NPG demand?
20.2% CAGR, led by detailed material qualification and process consistency.
Japanese formulators place close attention on purity, delivery reliability and technical fit before approving a new raw-material source. Carbon-footprint evidence must therefore sit alongside the same product records used for conventional NPG qualification. The market is forecast to post a 20.2% CAGR from 2026 to 2036 as powder-coating resin and specialty-material producers adopt lower-footprint grades without altering established process controls.
Who leads the Zero Carbon NPG Market?
Perstorp, BASF, Oxea, and LG Chem are assessed across NPG availability, production footprint, certification readiness, supply form, and customer documentation.
Competition is expected to center on the evidence attached to each NPG grade. BASF markets NPG ZeroPCF, while Perstorp describes Neeture under a traceable mass-balance approach. Oxea and LG Chem remain in the company set for their NPG or related oxo-chemical positions. Product-level evidence is required before a low-carbon claim is assigned.
Manufacturers compare the functional unit and cradle-to-gate boundary before approving a lower-footprint grade. The review also covers renewable-input treatment and whether the qualified material remains interchangeable with standard NPG.
Which companies are the key providers?
The company set includes Perstorp, BASF, Oxea, and LG Chem.
- Perstorp
- BASF
- Oxea
- LG Chem
Bibliography
- BASF. (2025, September 11). BASF, AkzoNobel and Arkema team up to lower carbon footprint of architectural powder coatings. BASF.
- Perstorp. (2024, June 26). Transforming the chemical industry with Perstorp’s Pro-Environment polyols. Perstorp.
- ISCC System GmbH. (2025, November 13). ISCC PLUS system structure and overview of ISCC PLUS documents, Version 1.2. ISCC System GmbH.
- U.S. Department of Energy. (2025, January 17). Scaling sustainable chemistry for an industrial transformation. U.S. Department of Energy.
- European Commission. (2025, July 8). European chemicals industry action plan. European Commission.
This Report Addresses
- The report clarifies how product-footprint boundaries and mass-balance claims affect zero-carbon NPG purchasing.
- Country coverage compares the United States, Germany, Sweden, the Netherlands, and Japan, drawn from analysis of more than 30 countries.
- Competitive analysis benchmarks Perstorp, BASF, Oxea, and LG Chem.
- Product-route analysis separates mass-balanced renewable, bio-circular, low-PCF, renewable-energy-linked, and customer-allocated supply.
- Application assessment covers powder-coating polyesters, alkyd resins, synthetic ester lubricants, plasticizers, and specialty polymers.
- Forecast evidence ties certified volumes and premiums to customer carbon targets, chain-of-custody capacity, and drop-in qualification.
What does the Zero Carbon NPG Market cover?
The market covers NPG sold with a documented carbon-reduction claim or certified renewable attribute for use across the five listed application chemistries.
The analysis measures NPG value instead of the value of the downstream resin or coating. It retains the stated segmentation for application chemistry, carbon route, certification basis, customer industry and supply form.
The study evaluates more than 30 countries and more than 30 companies during the 2026 to 2036 forecast period. Values are reported in USD million. The United States and Europe form the largest early demand centers within the country coverage.
What is included in the scope?
The scope covers certified mass-balanced NPG as well as bio-circular and low-PCF routes. Renewable-energy-linked and customer-allocated offers are included when the sold quantity carries supporting records.
The market includes bulk liquid, drums/IBCs, contract lots, spot sales and tolling/allocation where the sold quantity carries the relevant documented attribute. Certification is based on ISCC PLUS, a product carbon footprint, a mass-balance declaration, LCA evidence or an internal claim tied to the product.
Customer industries include coatings, resin, lubricant, construction-chemical, and electronics-material producers purchasing NPG for the listed chemistries.
What is excluded from the scope?
Unattributed conventional NPG and downstream product value are excluded from the market total.
The scope does not treat every lower-emission corporate action as zero-carbon NPG revenue. It also excludes transport, further processing, use, and end-of-life impacts from any cradle-to-gate claim unless the supporting method expressly includes them.
How Was the Analysis Built?
The analysis draws on 120+ sources, 35+ company portfolios, 25+ countries, and more than 20 industry interviews.
- Primary Research: Primary research includes discussions with manufacturers, service providers, technology developers, distributors, end users, procurement teams, and subject-matter experts. These conversations examine purchasing priorities, product adoption, operational challenges, approval requirements, competitive positioning, and the factors that influence wider market acceptance.
- Desk Research: Desk research covers government statistics, regulatory publications, company filings, trade data, technical studies, industry associations, standards, public policy, and other authoritative sources. Every source used in the analysis is documented in the bibliography.
- Market Sizing and Forecasting: Market estimates combine historical performance, demand indicators, pricing and volume trends, segment shares, company participation, country-level growth, adoption patterns, investment activity, and barriers to market expansion.
- Data Validation and Update Cycle: Findings are validated by comparing primary interviews with public data, company activity, regulatory changes, trade patterns, and industry developments. Regular updates review new product launches, capacity changes, partnerships, approvals, procurement trends, and shifts in commercial adoption.
Segmentation
What is the report's scope and coverage?
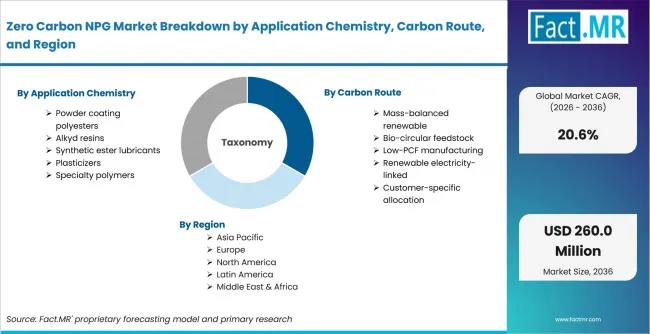
Zero Carbon Npg Market Breakdown By Application Chemistry, Carbon Route, And Region | Source: Fact.MR
| ATTRIBUTE | DETAILS |
|---|---|
| Quantitative Units | USD million in 2026 to USD million by 2036 at a CAGR |
| Market Definition | The market covers neopentyl glycol sold with a documented zero or substantially reduced product carbon footprint, or with certified renewable, bio-circular, energy-linked or mass-balanced attributes, for use in the listed downstream chemistries. |
| Application Chemistry | Powder coating polyesters; Alkyd resins; Synthetic ester lubricants; Plasticizers; Specialty polymers |
| Carbon Route | Mass-balanced renewable; Bio-circular feedstock; Low-PCF manufacturing; Renewable electricity-linked; Customer-specific allocation |
| Certification Basis | ISCC PLUS; Product carbon footprint; Mass-balance declaration; LCA-backed certificate; Internal supplier claim |
| Customer Industry | Coatings producers; Resin formulators; Lubricant blenders; Construction chemicals; Electronics materials |
| Supply Form | Bulk liquid; Drums/IBCs; Contract lots; Spot sales; Tolling/allocation |
| Regions Covered | North America, Latin America, Europe, East Asia, South Asia, Oceania, and the Middle East and Africa |
| Countries Covered | United States; Germany; Sweden; Netherlands; Japan and 30+ countries |
| Key Companies Profiled | Perstorp; BASF; Oxea; LG Chem |
| Forecast Period | 2026 to 2036 |
| Approach | Sizing reconciles attributed or certified NPG volume with contract prices, route premiums, supply form, customer allocation, and adoption across polyester, alkyd, lubricant, plasticizer, and specialty-polymer applications. |
Source: Fact.MR analysis. Updated Jul 21, 2026
How is the market segmented?
-
By Application Chemistry:
- Powder coating polyesters
- Alkyd resins
- Synthetic ester lubricants
- Plasticizers
- Specialty polymers
-
By Carbon Route:
- Mass-balanced renewable
- Bio-circular feedstock
- Low-PCF manufacturing
- Renewable electricity-linked
- Customer-specific allocation
-
By Certification Basis:
- ISCC PLUS
- Product carbon footprint
- Mass-balance declaration
- LCA-backed certificate
- Internal supplier claim
-
By Customer Industry:
- Coatings producers
- Resin formulators
- Lubricant blenders
- Construction chemicals
- Electronics materials
-
By Supply Form:
- Bulk liquid
- Drums/IBCs
- Contract lots
- Spot sales
- Tolling/allocation
-
By Region:
- North America
- United States
- Europe
- Germany
- Sweden
- Netherlands
- Asia Pacific
- Japan
Frequently Asked Questions
Which application chemistry leads demand?
Which carbon route has the largest share?
Which certification basis is most common?
Which supply form leads?
Which countries lead certified NPG uptake?
Does zero-carbon NPG mean there are no emissions anywhere in its life cycle?
What is the main restraint on adoption?
Who worked on this report


Preview the report firsthand - request a free sample
Free SampleGet the brochure for pricing and purchase details
Download PDF