Boom Trucks Market
Boom Trucks Market Analysis, By Product Type, By Application, By Lifting Capacity, By Boom Length, and Region - Market Insights 2025 to 2035
Analysis of Boom Trucks Market Covering 30+ Countries Including Analysis of US, Canada, UK, Germany, France, Nordics, GCC countries, Japan, Korea and many more.
Boom Trucks Market Outlook (2025 to 2035)
The global boom trucks market is forecast to reach USD 9.6 billion by 2035, up from USD 5.9 billion in 2025. During the forecast period, the industry is projected to register a CAGR of 5.0%, driven by growing demand for construction activities, technological advancements, and the need for efficient lifting and loading equipment.
What are the drivers of the Boom Trucks Market?
One of the primary factors driving the boom trucks market is the rapid growth of the global construction industry. The demand for lifting equipment that is both versatile and robust has increased significantly due to growing investments in infrastructure development, particularly in emerging economies. Boom trucks are becoming increasingly essential in contemporary construction projects due to their distinctive ability to transport large loads and offer mobility.
In addition, the construction industry's stringent safety regulations are compelling companies to use reliable and efficient equipment, such as boom trucks, which further stimulates market growth. Technological advancements in the design and functionality of boom trucks are also substantial growth drivers.
The efficiency and safety of boom trucks are being improved by innovations such as enhanced hydraulic systems, increased load capacities, and integration with IoT for remote monitoring. These developments not only enhance operational efficiency but also reduce maintenance costs and outages, making them an attractive investment for various industries.
Furthermore, the demand for sophisticated boom trucks that are capable of performing complex duties with precision is being driven by the growing automation in industries. The market is also significantly influenced by the utility sector. Reliable lifting apparatus is essential for the maintenance and repair of utility infrastructure, including power lines and streetlights.
Boom vehicles are extensively used in these applications due to their adaptability and ability to access difficult-to-reach locations. The demand for boom trucks is anticipated to increase substantially due to the ongoing expansion of utility networks and the ongoing necessity to upgrade existing infrastructure. Additionally, the increasing demand for specialized boom trucks is influenced by the oil and gas sector, which has intricate operational requirements.
What are the regional trends of Boom Trucks Market?
The boom trucks market exhibits distinct growth patterns in key global regions, as evidenced by regional trends. North America accounted for the largest market, a result of significant investments in infrastructure, technological advancements, and a strong emphasis on the upgrading and maintenance of existing facilities, particularly in the United States and Canada.
Rapid urbanization, large-scale construction projects, and expanding telecom and electrification initiatives have resulted in China, India, and Japan being the fastest-growing regions in the Asia Pacific. China alone accounted for over one-third of the region's revenue, and the trend toward domestic manufacturing and localization is significant.
Europe is experiencing consistent development, which is facilitated by stringent environmental regulations, urbanization, and infrastructure modernization. Countries such as the United Kingdom, France, and Germany are emphasizing eco-friendly and hybrid models for both urban and rural projects. In Brazil, Mexico, and Chile, the rental segment is expanding, and demand for utility, energy, and construction applications is on the rise.
Latin America is an emerging market. High-reach trucks are being employed in smart city and grid expansion projects in countries such as the UAE, Saudi Arabia, and South Africa, as the Middle East and Africa are progressively increasing their adoption, particularly in the oil and gas, construction, and public utilities sectors.
What are the challenges and restraining factors of Boom Trucks Market?
The market faces several significant challenges and restraining factors that impact its growth and operational efficiency. Compliance with regional transportation laws, such as axle weight limits and on-road travel restrictions, creates operational hurdles for fleet owners and contractors. Oversized boom truck configurations often require special permits, escort vehicles, or complex route planning, which adds both time and cost to deployment. Differences in municipal and interstate regulations further complicate cross-border equipment transfers, particularly affecting rental companies and logistics providers.
High initial costs and ongoing maintenance expenses also pose barriers, especially for smaller companies. The shortage of skilled and trained operators further limits the effective use of boom trucks and can drive up operational costs. Additionally, the market is sensitive to economic downturns and fluctuations in raw material and fuel prices, which can lead to reduced construction activity and increased operational costs.
Stringent safety and environmental regulations increase compliance costs and operational complexity, while the push for lower emissions is prompting a shift toward hybrid and electric models. However, these newer models come with higher upfront costs and require supporting infrastructure, which can restrain adoption.
The availability of alternative lifting solutions, such as aerial work platforms or traditional cranes, also limits market growth as companies seek the most cost-effective options. Overall, these logistical, regulatory, economic, and technological challenges collectively restrain the market's growth, despite ongoing demand driven by infrastructure development and urbanization.
Country-Wise Outlook
United States boom trucks market sees growth driven by semiconductor and biopharma expansion
The United States boom trucks market is witnessing significant growth, primarily fueled by expanding infrastructure projects, rapid urbanization, and increased demand for mobile construction equipment. As both the government and private sectors invest heavily in upgrading and building infrastructure such as bridges, roads, and high-rise buildings, the need for versatile boom trucks rises, given their essential role in lifting and placing materials at various heights for complex construction tasks.
The trend toward urbanization and the proliferation of high-rise residential and commercial buildings further boost demand, as these projects require specialized equipment for elevated work. North America, led by the U.S., dominated the global market, accounting for a significant portion of the market share, due to robust infrastructure development, industrial activity, and technological advancements in boom truck design.
The U.S. market is expected to maintain a strong growth trajectory, driven by ongoing residential, commercial, and infrastructure development, as well as a growing focus on infrastructure repair and modernization, which increases the need for high-capacity and versatile boom trucks.
China witnesses rapid market growth backed by infrastructure development and urbanization
Large-scale government investments in infrastructure, including smart city projects and urban renewal, are significantly boosting demand for boom trucks. These vehicles are essential for construction, utilities, telecommunications, and logistics, enabling efficient material handling and access to elevated work areas.
China’s government-led industrial policies, macroeconomic stimulus packages, and incentives for modernization and electrification have accelerated the adoption of advanced commercial vehicles, including boom trucks. Notably, a major stimulus package in late 2024 spurred a surge in truck sales, especially for zero-emission and technologically advanced models.
New launches in China’s market highlight a strong focus on innovation, efficiency, and cost-effectiveness. Hyva introduced a new range of stiff boom truck-mounted cranes at its Yangzhou facility, debuting three models: HST8 E4 (17.6m boom, 8tm lifting), HST12 E4 (18.5m boom, 12tm), and HST14 E4 (18.5m boom, 14tm).
These cranes emphasize reliability, high precision, and reduced costs, integrating advanced hydraulic control and cylinder technology for improved performance and efficiency. Features such as high-speed hydraulic winches, large-displacement oil pumps, and proportional control valves enable smooth, high-precision hoisting. An extensive service network across China supports the cranes.
Chinese manufacturers are also launching cost-competitive hydraulic knuckle boom truck-mounted cranes, such as a 25-ton folding arm mobile crane and a 16-ton model, both designed for construction and heavy lifting applications. These models offer advanced hydraulic systems, 360-degree rotation, and compact designs to maximize reach and durability.
These launches reflect China’s dual emphasis on technological advancement and sustainability in the boom truck segment, with new models catering to construction, logistics, and urban infrastructure needs, while also addressing environmental and operational efficiency goals.
Japan is experiencing growth primarily driven by expansion in key industries.
Japan’s boom truck sector is propelled by its strong emphasis on automation, advanced engineering, and continual product innovation, making its offerings highly competitive and efficient for various industrial applications. The adoption of boom trucks is increasing across various sectors, including construction, utilities, telecommunications, and industrial maintenance. These industries rely on boom trucks for their ability to combine transportation and heavy lifting, improving jobsite efficiency and reducing the need for separate cranes or trailers.
Japan’s boom truck market has seen notable new partnerships and acquisitions, particularly involving major domestic manufacturer Tadano. In January 2025, Tadano completed the acquisition of Manitex International, a leading U.S. provider of truck-mounted cranes, as part of its strategy to expand its global product portfolio and strengthen its presence in the lifting equipment sector. This move also involved the integration of other Manitex Group brands, including PM loader cranes, Oil & Steel aerial work platforms, and Valla pick-and-carry cranes, all unified under the Tadano brand.
Such collaborations and integrations are pivotal in meeting Japan’s growing demand for technologically advanced, efficient, and sustainable boom trucks, especially amid government-backed infrastructure and smart city initiatives.
Category-wise Analysis
Behind the Cab Mount to Exhibit Leading by Product Type
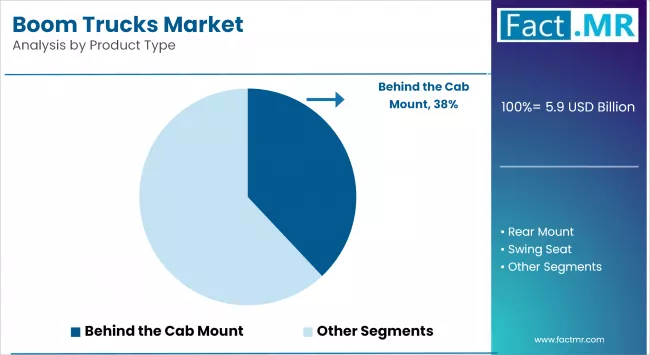
Behind-the-cab mount dominates the boom truck market, holding the largest share in 2025 due to its superior space efficiency and improved maneuverability. This mounting type places the boom just behind the cab, optimizing the truck’s balance and stability while maintaining a compact overall design. Its ability to navigate congested urban environments and tight job sites makes it especially valuable in utility work, urban construction, and municipal services.
Rear mount is a steadily growing segment, projected to experience substantial growth from 2025 to 2035. In this configuration, the boom is positioned at the rear of the truck, providing an unobstructed operator view and enhancing lifting height and reach. This design is particularly advantageous for heavy-duty applications that require high lifting capacity and frequent repositioning. The ability to operate the boom while the vehicle remains stationary improves efficiency in large-scale construction, making rear-mounted boom trucks a preferred choice for demanding industrial and infrastructure projects.
10-20 Metric Tons to Exhibit Leading by Lifting Capacity
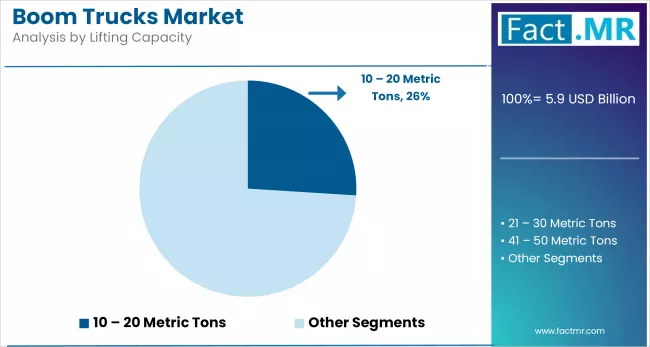
Boom trucks with a 10-20 metric ton lifting capacity dominate the market, accounting for the largest share in 2025. This segment’s growth is driven by rising demand from medium-sized construction projects and industrial applications where moderate yet reliable lifting performance is essential. Their ability to handle tasks such as material placement, equipment installation, and routine maintenance in urban and suburban environments makes them highly versatile. Compact design paired with sufficient lifting power enables these trucks to operate efficiently in confined job sites.
The widespread availability of models in the 10-20 metric ton range further supports this segment’s dominance. Manufacturers like QMC Building Cranes offer several boom truck models-such as the 4033R, 4037R, 4055R, and 4070R-within this capacity range, meeting diverse customer needs. These models are designed for stability, reach, and ease of operation, making them a preferred choice for contractors and utility providers. With infrastructure and urban development projects rising globally, this segment is expected to maintain strong growth through 2035.
Less than 20m to Exhibit Leading by Boom Length
Boom trucks with a boom length of less than 20 meters dominate the market, holding the largest share in 2025. This segment’s growth is driven by the increasing need for lifting equipment suited for confined or low-clearance environments. These boom trucks are widely used in utility work, small-scale construction, and building maintenance tasks where precision and moderate reach are required. Their shorter boom length allows for greater maneuverability and ease of operation in densely populated urban areas with space and height limitations.
The segment's popularity is further supported by its affordability and accessibility, particularly for small to medium-sized enterprises. Boom trucks under 20 meters are generally more cost-effective than larger models, making them an attractive option for contractors with budget constraints or limited operational requirements. Their practicality, combined with lower ownership costs, makes them a preferred choice for routine lifting operations in municipalities, residential zones, and compact work sites. This trend is expected to sustain the segment’s strong growth through 2035.
Infrastructure to Exhibit Leading by Application
Infrastructure dominates the bentonite market, accounting for the largest share due to its critical role in large-scale construction projects such as tunnels, dams, and landfills. Bentonite’s superior sealing and swelling properties make it ideal for use in slurry walls, diaphragm walls, and geosynthetic clay liners that prevent seepage and protect groundwater. With increasing investment in urban development and public infrastructure, especially in Asia and the Middle East, the demand for bentonite continues to grow, supporting its leading position in this segment.
Commercial construction is a steadily growing segment, fueled by the expansion of office buildings, shopping centers, and institutional facilities. Bentonite is widely used in foundation waterproofing, structural sealing, and underground containment systems within this sector. As green building standards and sustainability concerns gain traction globally, the need for environmentally friendly and effective construction materials like bentonite is increasing. Its versatility and performance benefits are driving adoption in both new developments and retrofitting projects across commercial spaces.
Competitive Analysis
The global boom truck market is becoming increasingly competitive, with a mix of established crane manufacturers, construction equipment providers, and emerging mobility solution firms serving diverse sectors including infrastructure, utilities, and urban development.
This competitive environment is largely driven by strategic partnerships, joint ventures, and market expansion efforts aimed at enhancing product portfolios and entering new regional markets. Companies that leverage collaborations to integrate advanced technologies, improve lifting performance, and deliver customized solutions are gaining a distinct competitive advantage in the evolving boom truck landscape.
Furthermore, mergers and acquisitions are also prevalent in the market, enabling companies to expand their customer base, acquire new technologies, and consolidate their position. These strategic movements shape the competitive and dynamic nature of the boom trucks market. Terex Corporation is a prominent participant in the boom truck market, distinguished by its extensive selection of material handling and lifting equipment.
Key players in the boom trucks industry include The Manitowoc Company, Inc., Fassi Gru S.p.A., Elliott Equipment Company, Altec Industries, Manitex International, Inc., Terex Corporation, Palfinger AG, Tadano Ltd., Load King, QMC Building Cranes, and other notable companies.
Recent Development
- In February 2025, Terex Utilities unveiled its next-generation zero-emission bucket trucks, featuring the company's 55-foot Optima HR55 aerial device mounted on a Mack MD7 Electric chassis. This collaboration with Mack Trucks aims to provide the utility industry with a sustainable solution that does not compromise on performance or capability.
- In February 2025, Mack Trucks expanded its presence into the specialized utility industry through a partnership with Terex Utilities. This collaboration led to the creation of an all-electric bucket truck, marking a significant milestone for Mack's battery-electric vehicle (BEV) portfolio.
Segmentation of the Boom Trucks Market
-
By Product Type :
- Behind the Cab Mount
- Rear Mount
- Swing Seat
-
By Lifting Capacity :
- Less than 10 Metric Tons
- 10 - 20 Metric Tons
- 21 - 30 Metric Tons
- 31 - 40 Metric Tons
- 41 - 50 Metric Tons
- More than 50 Metric Tons
-
By Boom length :
- Less than 20 m
- 20-30 m
- 31-40 m
- More than 40 m
-
By Application :
- Infrastructure
- Commercial Construction
- Power & Utility
- Industrial / Petrochemical
- Residential
-
By Region :
- North America
- Latin America
- Western Europe
- Eastern Europe
- East Asia
- South Asia & Pacific
- Middle East & Africa
Table of Content
- Executive Summary
- Global Market Outlook
- Demand-side Trends
- Supply-side Trends
- Technology Roadmap Analysis
- Analysis and Recommendations
- Market Overview
- Market Coverage / Taxonomy
- Market Definition / Scope / Limitations
- Market Background
- Market Dynamics
- Drivers
- Restraints
- Opportunity
- Trends
- Scenario Forecast
- Demand in Optimistic Scenario
- Demand in Likely Scenario
- Demand in Conservative Scenario
- Opportunity Map Analysis
- Product Life Cycle Analysis
- Supply Chain Analysis
- Supply Side Participants and their Roles
- Producers
- Mid-Level Participants (Traders/ Agents/ Brokers)
- Wholesalers and Distributors
- Value Added and Value Created at Node in the Supply Chain
- List of Component Suppliers
- List of Existing and Potential Buyers
- Supply Side Participants and their Roles
- Investment Feasibility Matrix
- Value Chain Analysis
- Profit Margin Analysis
- Wholesalers and Distributors
- Retailers
- PESTLE and Porter’s Analysis
- Regulatory Landscape
- By Key Regions
- By Key Countries
- Production and Consumption Statistics
- Import and Export Statistics
- Market Dynamics
- Global Market Analysis 2020 to 2024 and Forecast, 2025 to 2035
- Historical Market Size Value (USD Bn) & Volume (Units) Analysis, 2020 to 2024
- Current and Future Market Size Value (USD Bn) & Volume (Units) Projections, 2025 to 2035
- Y-o-Y Growth Trend Analysis
- Absolute $ Opportunity Analysis
- Global Market Pricing Analysis 2020 to 2024 and Forecast 2025 to 2035
- Global Market Analysis 2020 to 2024 and Forecast 2025 to 2035, By Product Type
- Introduction / Key Findings
- Historical Market Size Value (USD Bn) & Volume (Units) Analysis By Product Type, 2020 to 2024
- Current and Future Market Size Value (USD Bn) & Volume (Units) Analysis and Forecast By Product Type, 2025 to 2035
- Behind the Cab Mount
- Rear Mount
- Swing Seat
- Y-o-Y Growth Trend Analysis By Product Type, 2020 to 2024
- Absolute $ Opportunity Analysis By Product Type, 2025 to 2035
- Global Market Analysis 2020 to 2024 and Forecast 2025 to 2035, By Lifting Capacity
- Introduction / Key Findings
- Historical Market Size Value (USD Bn) & Volume (Units) Analysis By Lifting Capacity, 2020 to 2024
- Current and Future Market Size Value (USD Bn) & Volume (Units) Analysis and Forecast By Lifting Capacity, 2025 to 2035
- Less than 10 Metric Tons
- 10 - 20 Metric Tons
- 21 - 30 Metric Tons
- 31 - 40 Metric Tons
- 41 - 50 Metric Tons
- More than 50 Metric Tons
- Y-o-Y Growth Trend Analysis By Lifting Capacity, 2020 to 2024
- Absolute $ Opportunity Analysis By Lifting Capacity, 2025 to 2035
- Global Market Analysis 2020 to 2024 and Forecast 2025 to 2035, By Boom Length
- Introduction / Key Findings
- Historical Market Size Value (USD Bn) & Volume (Units) Analysis By Boom Length, 2020 to 2024
- Current and Future Market Size Value (USD Bn) & Volume (Units) Analysis and Forecast By Boom Length, 2025 to 2035
- Less than 20 m
- 20-30 m
- 31-40 m
- More than 40 m
- Y-o-Y Growth Trend Analysis By Boom Length, 2020 to 2024
- Absolute $ Opportunity Analysis By Boom Length, 2025 to 2035
- Global Market Analysis 2020 to 2024 and Forecast 2025 to 2035, By Application
- Introduction / Key Findings
- Historical Market Size Value (USD Bn) & Volume (Units) Analysis By Application, 2020 to 2024
- Current and Future Market Size Value (USD Bn) & Volume (Units) Analysis and Forecast By Application, 2025 to 2035
- Infrastructure
- Commercial Construction
- Power & Utility
- Industrial / Petrochemical
- Residential
- Y-o-Y Growth Trend Analysis By Application, 2020 to 2024
- Absolute $ Opportunity Analysis By Application, 2025 to 2035
- Global Market Analysis 2020 to 2024 and Forecast 2025 to 2035, By Region
- Introduction
- Historical Market Size Value (USD Bn) & Volume (Units) Analysis By Region, 2020 to 2024
- Current Market Size Value (USD Bn) & Volume (Units) Analysis and Forecast By Region, 2025 to 2035
- North America
- Latin America
- Western Europe
- East Asia
- South Asia Pacific
- Eastern Europe
- Middle East & Africa
- Market Attractiveness Analysis By Region
- North America Market Analysis 2020 to 2024 and Forecast 2025 to 2035, By Country
- Historical Market Size Value (USD Bn) & Volume (Units) Trend Analysis By Market Taxonomy, 2020 to 2024
- Market Size Value (USD Bn) & Volume (Units) Forecast By Market Taxonomy, 2025 to 2035
- By Country
- U.S.
- Canada
- Mexico
- By Product Type
- By Lifting Capacity
- By Boom Length
- By Application
- By Country
- Market Attractiveness Analysis
- By Country
- By Product Type
- By Lifting Capacity
- By Boom Length
- By Application
- Key Takeaways
- Latin America Market Analysis 2020 to 2024 and Forecast 2025 to 2035, By Country
- Historical Market Size Value (USD Bn) & Volume (Units) Trend Analysis By Market Taxonomy, 2020 to 2024
- Market Size Value (USD Bn) & Volume (Units) Forecast By Market Taxonomy, 2025 to 2035
- By Country
- Brazil
- Chile
- Rest of Latin America
- By Product Type
- By Lifting Capacity
- By Boom Length
- By Application
- By Country
- Market Attractiveness Analysis
- By Country
- By Product Type
- By Lifting Capacity
- By Boom Length
- By Application
- Key Takeaways
- Western Europe Market Analysis 2020 to 2024 and Forecast 2025 to 2035, By Country
- Historical Market Size Value (USD Bn) & Volume (Units) Trend Analysis By Market Taxonomy, 2020 to 2024
- Market Size Value (USD Bn) & Volume (Units) Forecast By Market Taxonomy, 2025 to 2035
- By Country
- Germany
- Italy
- France
- U.K.
- Spain
- Russia
- BENELUX
- Rest of Europe
- By Product Type
- By Lifting Capacity
- By Boom Length
- By Application
- By Country
- Market Attractiveness Analysis
- By Country
- By Product Type
- By Lifting Capacity
- By Boom Length
- By Application
- Key Takeaways
- East Asia Market Analysis 2020 to 2024 and Forecast 2025 to 2035, By Country
- Historical Market Size Value (USD Bn) & Volume (Units) Trend Analysis By Market Taxonomy, 2020 to 2024
- Market Size Value (USD Bn) & Volume (Units) Forecast By Market Taxonomy, 2025 to 2035
- By Country
- China
- Japan
- South Korea
- By Product Type
- By Lifting Capacity
- By Boom Length
- By Application
- By Country
- Market Attractiveness Analysis
- By Country
- By Product Type
- By Lifting Capacity
- By Boom Length
- By Application
- Key Takeaways
- South Asia Pacific Market Analysis 2020 to 2024 and Forecast 2025 to 2035, By Country
- Historical Market Size Value (USD Bn) & Volume (Units) Trend Analysis By Market Taxonomy, 2020 to 2024
- Market Size Value (USD Bn) & Volume (Units) Forecast By Market Taxonomy, 2025 to 2035
- By Country
- India
- ASEAN Countries
- Australia & New Zealand
- Rest of South Asia Pacific
- By Product Type
- By Lifting Capacity
- By Boom Length
- By Application
- By Country
- Market Attractiveness Analysis
- By Country
- By Product Type
- By Lifting Capacity
- By Boom Length
- By Application
- Key Takeaways
- Eastern Europe Market Analysis 2020 to 2024 and Forecast 2025 to 2035, By Country
- Historical Market Size Value (USD Bn) & Volume (Units) Trend Analysis By Market Taxonomy, 2020 to 2024
- Market Size Value (USD Bn) & Volume (Units) Forecast By Market Taxonomy, 2025 to 2035
- By Country
- Russia
- Poland
- Hungary
- Balkan & Baltics
- Rest of Eastern Europe
- By Product Type
- By Lifting Capacity
- By Boom Length
- By Application
- By Country
- Market Attractiveness Analysis
- By Country
- By Product Type
- By Lifting Capacity
- By Boom Length
- By Application
- Key Takeaways
- Middle East & Africa Market Analysis 2020 to 2024 and Forecast 2025 to 2035, By Country
- Historical Market Size Value (USD Bn) & Volume (Units) Trend Analysis By Market Taxonomy, 2020 to 2024
- Market Size Value (USD Bn) & Volume (Units) Forecast By Market Taxonomy, 2025 to 2035
- By Country
- KSA
- Other GCC Countries
- Turkiye
- South Africa
- Rest of MEA
- By Product Type
- By Lifting Capacity
- By Boom Length
- By Application
- By Country
- Market Attractiveness Analysis
- By Country
- By Product Type
- By Lifting Capacity
- By Boom Length
- By Application
- Key Takeaways
- Key Countries Market Analysis
- United States
- Pricing Analysis
- Market Share Analysis, 2024
- By Product Type
- By Lifting Capacity
- By Boom Length
- By Application
- Germany
- Pricing Analysis
- Market Share Analysis, 2024
- By Product Type
- By Lifting Capacity
- By Boom Length
- By Application
- Canada
- Pricing Analysis
- Market Share Analysis, 2024
- By Product Type
- By Lifting Capacity
- By Boom Length
- By Application
- Japan
- Pricing Analysis
- Market Share Analysis, 2024
- By Product Type
- By Lifting Capacity
- By Boom Length
- By Application
- India
- Pricing Analysis
- Market Share Analysis, 2024
- By Product Type
- By Lifting Capacity
- By Boom Length
- By Application
- United States
- Market Structure Analysis
- Competition Dashboard
- Competition Benchmarking
- Market Share Analysis of Top Players
- By Regional
- By Product Type
- By Lifting Capacity
- By Boom Length
- By Application
- Competition Analysis
- Competition Deep Dive
- The Manitowoc Company, Inc.
- Overview
- Product Portfolio
- Profitability by Market Segments (Product/Age /Sales Channel/Region)
- Sales Footprint
- Strategy Overview
- Marketing Strategy
- Product Strategy
- Channel Strategy
- Fassi Gru S.p.A.
- Overview
- Product Portfolio
- Profitability by Market Segments (Product/Age /Sales Channel/Region)
- Sales Footprint
- Strategy Overview
- Marketing Strategy
- Product Strategy
- Channel Strategy
- Elliott Equipment Company
- Overview
- Product Portfolio
- Profitability by Market Segments (Product/Age /Sales Channel/Region)
- Sales Footprint
- Strategy Overview
- Marketing Strategy
- Product Strategy
- Channel Strategy
- Altec Industries
- Overview
- Product Portfolio
- Profitability by Market Segments (Product/Age /Sales Channel/Region)
- Sales Footprint
- Strategy Overview
- Marketing Strategy
- Product Strategy
- Channel Strategy
- Manitex International, Inc.
- Overview
- Product Portfolio
- Profitability by Market Segments (Product/Age /Sales Channel/Region)
- Sales Footprint
- Strategy Overview
- Marketing Strategy
- Product Strategy
- Channel Strategy
- Terex Corporation
- Overview
- Product Portfolio
- Profitability by Market Segments (Product/Age /Sales Channel/Region)
- Sales Footprint
- Strategy Overview
- Marketing Strategy
- Product Strategy
- Channel Strategy
- Palfinger AG
- Overview
- Product Portfolio
- Profitability by Market Segments (Product/Age /Sales Channel/Region)
- Sales Footprint
- Strategy Overview
- Marketing Strategy
- Product Strategy
- Channel Strategy
- Tadano Ltd.
- Overview
- Product Portfolio
- Profitability by Market Segments (Product/Age /Sales Channel/Region)
- Sales Footprint
- Strategy Overview
- Marketing Strategy
- Product Strategy
- Channel Strategy
- Load King
- Overview
- Product Portfolio
- Profitability by Market Segments (Product/Age /Sales Channel/Region)
- Sales Footprint
- Strategy Overview
- Marketing Strategy
- Product Strategy
- Channel Strategy
- QMC Building Cranes
- Overview
- Product Portfolio
- Profitability by Market Segments (Product/Age /Sales Channel/Region)
- Sales Footprint
- Strategy Overview
- Marketing Strategy
- Product Strategy
- Channel Strategy
- The Manitowoc Company, Inc.
- Competition Deep Dive
- Assumptions & Acronyms Used
- Research Methodology
List Of Table
- Table 1: Global Market Value (USD Bn) Forecast by Region, 2020 to 2035
- Table 2: Global Market Volume (Units) Forecast by Region, 2020 to 2035
- Table 3: Global Market Value (USD Bn) Forecast by Product Type, 2020 to 2035
- Table 4: Global Market Volume (Units) Forecast by Product Type, 2020 to 2035
- Table 5: Global Market Value (USD Bn) Forecast by Lifting Capacity, 2020 to 2035
- Table 6: Global Market Volume (Units) Forecast by Lifting Capacity, 2020 to 2035
- Table 7: Global Market Value (USD Bn) Forecast by Boom Length, 2020 to 2035
- Table 8: Global Market Volume (Units) Forecast by Boom Length, 2020 to 2035
- Table 9: Global Market Value (USD Bn) Forecast by Application, 2020 to 2035
- Table 10: Global Market Volume (Units) Forecast by Application, 2020 to 2035
- Table 11: North America Market Value (USD Bn) Forecast by Country, 2020 to 2035
- Table 12: North America Market Volume (Units) Forecast by Country, 2020 to 2035
- Table 13: North America Market Value (USD Bn) Forecast by Product Type, 2020 to 2035
- Table 14: North America Market Volume (Units) Forecast by Product Type, 2020 to 2035
- Table 15: North America Market Value (USD Bn) Forecast by Lifting Capacity, 2020 to 2035
- Table 16: North America Market Volume (Units) Forecast by Lifting Capacity, 2020 to 2035
- Table 17: North America Market Value (USD Bn) Forecast by Boom Length, 2020 to 2035
- Table 18: North America Market Volume (Units) Forecast by Boom Length, 2020 to 2035
- Table 19: North America Market Value (USD Bn) Forecast by Application, 2020 to 2035
- Table 20: North America Market Volume (Units) Forecast by Application, 2020 to 2035
- Table 21: Latin America Market Value (USD Bn) Forecast by Country, 2020 to 2035
- Table 22: Latin America Market Volume (Units) Forecast by Country, 2020 to 2035
- Table 23: Latin America Market Value (USD Bn) Forecast by Product Type, 2020 to 2035
- Table 24: Latin America Market Volume (Units) Forecast by Product Type, 2020 to 2035
- Table 25: Latin America Market Value (USD Bn) Forecast by Lifting Capacity, 2020 to 2035
- Table 26: Latin America Market Volume (Units) Forecast by Lifting Capacity, 2020 to 2035
- Table 27: Latin America Market Value (USD Bn) Forecast by Boom Length, 2020 to 2035
- Table 28: Latin America Market Volume (Units) Forecast by Boom Length, 2020 to 2035
- Table 29: Latin America Market Value (USD Bn) Forecast by Application, 2020 to 2035
- Table 30: Latin America Market Volume (Units) Forecast by Application, 2020 to 2035
- Table 31: Western Europe Market Value (USD Bn) Forecast by Country, 2020 to 2035
- Table 32: Western Europe Market Volume (Units) Forecast by Country, 2020 to 2035
- Table 33: Western Europe Market Value (USD Bn) Forecast by Product Type, 2020 to 2035
- Table 34: Western Europe Market Volume (Units) Forecast by Product Type, 2020 to 2035
- Table 35: Western Europe Market Value (USD Bn) Forecast by Lifting Capacity, 2020 to 2035
- Table 36: Western Europe Market Volume (Units) Forecast by Lifting Capacity, 2020 to 2035
- Table 37: Western Europe Market Value (USD Bn) Forecast by Boom Length, 2020 to 2035
- Table 38: Western Europe Market Volume (Units) Forecast by Boom Length, 2020 to 2035
- Table 39: Western Europe Market Value (USD Bn) Forecast by Application, 2020 to 2035
- Table 40: Western Europe Market Volume (Units) Forecast by Application, 2020 to 2035
- Table 41: East Asia Market Value (USD Bn) Forecast by Country, 2020 to 2035
- Table 42: East Asia Market Volume (Units) Forecast by Country, 2020 to 2035
- Table 43: East Asia Market Value (USD Bn) Forecast by Product Type, 2020 to 2035
- Table 44: East Asia Market Volume (Units) Forecast by Product Type, 2020 to 2035
- Table 45: East Asia Market Value (USD Bn) Forecast by Lifting Capacity, 2020 to 2035
- Table 46: East Asia Market Volume (Units) Forecast by Lifting Capacity, 2020 to 2035
- Table 47: East Asia Market Value (USD Bn) Forecast by Boom Length, 2020 to 2035
- Table 48: East Asia Market Volume (Units) Forecast by Boom Length, 2020 to 2035
- Table 49: East Asia Market Value (USD Bn) Forecast by Application, 2020 to 2035
- Table 50: East Asia Market Volume (Units) Forecast by Application, 2020 to 2035
- Table 51: South Asia Pacific Market Value (USD Bn) Forecast by Country, 2020 to 2035
- Table 52: South Asia Pacific Market Volume (Units) Forecast by Country, 2020 to 2035
- Table 53: South Asia Pacific Market Value (USD Bn) Forecast by Product Type, 2020 to 2035
- Table 54: South Asia Pacific Market Volume (Units) Forecast by Product Type, 2020 to 2035
- Table 55: South Asia Pacific Market Value (USD Bn) Forecast by Lifting Capacity, 2020 to 2035
- Table 56: South Asia Pacific Market Volume (Units) Forecast by Lifting Capacity, 2020 to 2035
- Table 57: South Asia Pacific Market Value (USD Bn) Forecast by Boom Length, 2020 to 2035
- Table 58: South Asia Pacific Market Volume (Units) Forecast by Boom Length, 2020 to 2035
- Table 59: South Asia Pacific Market Value (USD Bn) Forecast by Application, 2020 to 2035
- Table 60: South Asia Pacific Market Volume (Units) Forecast by Application, 2020 to 2035
- Table 61: Eastern Europe Market Value (USD Bn) Forecast by Country, 2020 to 2035
- Table 62: Eastern Europe Market Volume (Units) Forecast by Country, 2020 to 2035
- Table 63: Eastern Europe Market Value (USD Bn) Forecast by Product Type, 2020 to 2035
- Table 64: Eastern Europe Market Volume (Units) Forecast by Product Type, 2020 to 2035
- Table 65: Eastern Europe Market Value (USD Bn) Forecast by Lifting Capacity, 2020 to 2035
- Table 66: Eastern Europe Market Volume (Units) Forecast by Lifting Capacity, 2020 to 2035
- Table 67: Eastern Europe Market Value (USD Bn) Forecast by Boom Length, 2020 to 2035
- Table 68: Eastern Europe Market Volume (Units) Forecast by Boom Length, 2020 to 2035
- Table 69: Eastern Europe Market Value (USD Bn) Forecast by Application, 2020 to 2035
- Table 70: Eastern Europe Market Volume (Units) Forecast by Application, 2020 to 2035
- Table 71: Middle East & Africa Market Value (USD Bn) Forecast by Country, 2020 to 2035
- Table 72: Middle East & Africa Market Volume (Units) Forecast by Country, 2020 to 2035
- Table 73: Middle East & Africa Market Value (USD Bn) Forecast by Product Type, 2020 to 2035
- Table 74: Middle East & Africa Market Volume (Units) Forecast by Product Type, 2020 to 2035
- Table 75: Middle East & Africa Market Value (USD Bn) Forecast by Lifting Capacity, 2020 to 2035
- Table 76: Middle East & Africa Market Volume (Units) Forecast by Lifting Capacity, 2020 to 2035
- Table 77: Middle East & Africa Market Value (USD Bn) Forecast by Boom Length, 2020 to 2035
- Table 78: Middle East & Africa Market Volume (Units) Forecast by Boom Length, 2020 to 2035
- Table 79: Middle East & Africa Market Value (USD Bn) Forecast by Application, 2020 to 2035
- Table 80: Middle East & Africa Market Volume (Units) Forecast by Application, 2020 to 2035
List Of Figures
- Figure 1: Global Market Volume (Units) Forecast 2020 to 2035
- Figure 2: Global Market Pricing Analysis
- Figure 3: Global Market Value (USD Bn) Forecast 2020 to 2035
- Figure 4: Global Market Value Share and BPS Analysis by Product Type, 2025 and 2035
- Figure 5: Global Market Y-o-Y Growth Comparison by Product Type, 2025 to 2035
- Figure 6: Global Market Attractiveness Analysis by Product Type
- Figure 7: Global Market Value Share and BPS Analysis by Lifting Capacity, 2025 and 2035
- Figure 8: Global Market Y-o-Y Growth Comparison by Lifting Capacity, 2025 to 2035
- Figure 9: Global Market Attractiveness Analysis by Lifting Capacity
- Figure 10: Global Market Value Share and BPS Analysis by Boom Length, 2025 and 2035
- Figure 11: Global Market Y-o-Y Growth Comparison by Boom Length, 2025 to 2035
- Figure 12: Global Market Attractiveness Analysis by Boom Length
- Figure 13: Global Market Value Share and BPS Analysis by Application, 2025 and 2035
- Figure 14: Global Market Y-o-Y Growth Comparison by Application, 2025 to 2035
- Figure 15: Global Market Attractiveness Analysis by Application
- Figure 16: Global Market Value (USD Bn) Share and BPS Analysis by Region, 2025 and 2035
- Figure 17: Global Market Y-o-Y Growth Comparison by Region, 2025 to 2035
- Figure 18: Global Market Attractiveness Analysis by Region
- Figure 19: North America Market Incremental $ Opportunity, 2025 to 2035
- Figure 20: Latin America Market Incremental $ Opportunity, 2025 to 2035
- Figure 21: Western Europe Market Incremental $ Opportunity, 2025 to 2035
- Figure 22: East Asia Market Incremental $ Opportunity, 2025 to 2035
- Figure 23: South Asia Pacific Market Incremental $ Opportunity, 2025 to 2035
- Figure 24: Eastern Europe Market Incremental $ Opportunity, 2025 to 2035
- Figure 25: Middle East & Africa Market Incremental $ Opportunity, 2025 to 2035
- Figure 26: North America Market Value Share and BPS Analysis by Country, 2025 and 2035
- Figure 27: North America Market Value Share and BPS Analysis by Product Type, 2025 and 2035
- Figure 28: North America Market Y-o-Y Growth Comparison by Product Type, 2025 to 2035
- Figure 29: North America Market Attractiveness Analysis by Product Type
- Figure 30: North America Market Value Share and BPS Analysis by Lifting Capacity, 2025 and 2035
- Figure 31: North America Market Y-o-Y Growth Comparison by Lifting Capacity, 2025 to 2035
- Figure 32: North America Market Attractiveness Analysis by Lifting Capacity
- Figure 33: North America Market Value Share and BPS Analysis by Boom Length, 2025 and 2035
- Figure 34: North America Market Y-o-Y Growth Comparison by Boom Length, 2025 to 2035
- Figure 35: North America Market Attractiveness Analysis by Boom Length
- Figure 36: North America Market Value Share and BPS Analysis by Application, 2025 and 2035
- Figure 37: North America Market Y-o-Y Growth Comparison by Application, 2025 to 2035
- Figure 38: North America Market Attractiveness Analysis by Application
- Figure 39: Latin America Market Value Share and BPS Analysis by Country, 2025 and 2035
- Figure 40: Latin America Market Value Share and BPS Analysis by Product Type, 2025 and 2035
- Figure 41: Latin America Market Y-o-Y Growth Comparison by Product Type, 2025 to 2035
- Figure 42: Latin America Market Attractiveness Analysis by Product Type
- Figure 43: Latin America Market Value Share and BPS Analysis by Lifting Capacity, 2025 and 2035
- Figure 44: Latin America Market Y-o-Y Growth Comparison by Lifting Capacity, 2025 to 2035
- Figure 45: Latin America Market Attractiveness Analysis by Lifting Capacity
- Figure 46: Latin America Market Value Share and BPS Analysis by Boom Length, 2025 and 2035
- Figure 47: Latin America Market Y-o-Y Growth Comparison by Boom Length, 2025 to 2035
- Figure 48: Latin America Market Attractiveness Analysis by Boom Length
- Figure 49: Latin America Market Value Share and BPS Analysis by Application, 2025 and 2035
- Figure 50: Latin America Market Y-o-Y Growth Comparison by Application, 2025 to 2035
- Figure 51: Latin America Market Attractiveness Analysis by Application
- Figure 52: Western Europe Market Value Share and BPS Analysis by Country, 2025 and 2035
- Figure 53: Western Europe Market Value Share and BPS Analysis by Product Type, 2025 and 2035
- Figure 54: Western Europe Market Y-o-Y Growth Comparison by Product Type, 2025 to 2035
- Figure 55: Western Europe Market Attractiveness Analysis by Product Type
- Figure 56: Western Europe Market Value Share and BPS Analysis by Lifting Capacity, 2025 and 2035
- Figure 57: Western Europe Market Y-o-Y Growth Comparison by Lifting Capacity, 2025 to 2035
- Figure 58: Western Europe Market Attractiveness Analysis by Lifting Capacity
- Figure 59: Western Europe Market Value Share and BPS Analysis by Boom Length, 2025 and 2035
- Figure 60: Western Europe Market Y-o-Y Growth Comparison by Boom Length, 2025 to 2035
- Figure 61: Western Europe Market Attractiveness Analysis by Boom Length
- Figure 62: Western Europe Market Value Share and BPS Analysis by Application, 2025 and 2035
- Figure 63: Western Europe Market Y-o-Y Growth Comparison by Application, 2025 to 2035
- Figure 64: Western Europe Market Attractiveness Analysis by Application
- Figure 65: East Asia Market Value Share and BPS Analysis by Country, 2025 and 2035
- Figure 66: East Asia Market Value Share and BPS Analysis by Product Type, 2025 and 2035
- Figure 67: East Asia Market Y-o-Y Growth Comparison by Product Type, 2025 to 2035
- Figure 68: East Asia Market Attractiveness Analysis by Product Type
- Figure 69: East Asia Market Value Share and BPS Analysis by Lifting Capacity, 2025 and 2035
- Figure 70: East Asia Market Y-o-Y Growth Comparison by Lifting Capacity, 2025 to 2035
- Figure 71: East Asia Market Attractiveness Analysis by Lifting Capacity
- Figure 72: East Asia Market Value Share and BPS Analysis by Boom Length, 2025 and 2035
- Figure 73: East Asia Market Y-o-Y Growth Comparison by Boom Length, 2025 to 2035
- Figure 74: East Asia Market Attractiveness Analysis by Boom Length
- Figure 75: East Asia Market Value Share and BPS Analysis by Application, 2025 and 2035
- Figure 76: East Asia Market Y-o-Y Growth Comparison by Application, 2025 to 2035
- Figure 77: East Asia Market Attractiveness Analysis by Application
- Figure 78: South Asia Pacific Market Value Share and BPS Analysis by Country, 2025 and 2035
- Figure 79: South Asia Pacific Market Value Share and BPS Analysis by Product Type, 2025 and 2035
- Figure 80: South Asia Pacific Market Y-o-Y Growth Comparison by Product Type, 2025 to 2035
- Figure 81: South Asia Pacific Market Attractiveness Analysis by Product Type
- Figure 82: South Asia Pacific Market Value Share and BPS Analysis by Lifting Capacity, 2025 and 2035
- Figure 83: South Asia Pacific Market Y-o-Y Growth Comparison by Lifting Capacity, 2025 to 2035
- Figure 84: South Asia Pacific Market Attractiveness Analysis by Lifting Capacity
- Figure 85: South Asia Pacific Market Value Share and BPS Analysis by Boom Length, 2025 and 2035
- Figure 86: South Asia Pacific Market Y-o-Y Growth Comparison by Boom Length, 2025 to 2035
- Figure 87: South Asia Pacific Market Attractiveness Analysis by Boom Length
- Figure 88: South Asia Pacific Market Value Share and BPS Analysis by Application, 2025 and 2035
- Figure 89: South Asia Pacific Market Y-o-Y Growth Comparison by Application, 2025 to 2035
- Figure 90: South Asia Pacific Market Attractiveness Analysis by Application
- Figure 91: Eastern Europe Market Value Share and BPS Analysis by Country, 2025 and 2035
- Figure 92: Eastern Europe Market Value Share and BPS Analysis by Product Type, 2025 and 2035
- Figure 93: Eastern Europe Market Y-o-Y Growth Comparison by Product Type, 2025 to 2035
- Figure 94: Eastern Europe Market Attractiveness Analysis by Product Type
- Figure 95: Eastern Europe Market Value Share and BPS Analysis by Lifting Capacity, 2025 and 2035
- Figure 96: Eastern Europe Market Y-o-Y Growth Comparison by Lifting Capacity, 2025 to 2035
- Figure 97: Eastern Europe Market Attractiveness Analysis by Lifting Capacity
- Figure 98: Eastern Europe Market Value Share and BPS Analysis by Boom Length, 2025 and 2035
- Figure 99: Eastern Europe Market Y-o-Y Growth Comparison by Boom Length, 2025 to 2035
- Figure 100: Eastern Europe Market Attractiveness Analysis by Boom Length
- Figure 101: Eastern Europe Market Value Share and BPS Analysis by Application, 2025 and 2035
- Figure 102: Eastern Europe Market Y-o-Y Growth Comparison by Application, 2025 to 2035
- Figure 103: Eastern Europe Market Attractiveness Analysis by Application
- Figure 104: Middle East & Africa Market Value Share and BPS Analysis by Country, 2025 and 2035
- Figure 105: Middle East & Africa Market Value Share and BPS Analysis by Product Type, 2025 and 2035
- Figure 106: Middle East & Africa Market Y-o-Y Growth Comparison by Product Type, 2025 to 2035
- Figure 107: Middle East & Africa Market Attractiveness Analysis by Product Type
- Figure 108: Middle East & Africa Market Value Share and BPS Analysis by Lifting Capacity, 2025 and 2035
- Figure 109: Middle East & Africa Market Y-o-Y Growth Comparison by Lifting Capacity, 2025 to 2035
- Figure 110: Middle East & Africa Market Attractiveness Analysis by Lifting Capacity
- Figure 111: Middle East & Africa Market Value Share and BPS Analysis by Boom Length, 2025 and 2035
- Figure 112: Middle East & Africa Market Y-o-Y Growth Comparison by Boom Length, 2025 to 2035
- Figure 113: Middle East & Africa Market Attractiveness Analysis by Boom Length
- Figure 114: Middle East & Africa Market Value Share and BPS Analysis by Application, 2025 and 2035
- Figure 115: Middle East & Africa Market Y-o-Y Growth Comparison by Application, 2025 to 2035
- Figure 116: Middle East & Africa Market Attractiveness Analysis by Application
- Figure 117: Global Market - Tier Structure Analysis
- Figure 118: Global Market - Company Share Analysis
- FAQs -
What is the global boom trucks market size in 2025?
The boom trucks market is valued at USD 5.9 billion in 2025.
Who are the major players operating in the boom trucks market?
Prominent players in the market include The Manitowoc Company, Inc., Fassi Gru S.p.A., Elliott Equipment Company, Altec Industries, and Manitex International, Inc.
What is the estimated valuation of the boom trucks market by 2035?
The market is expected to reach a valuation of USD 9.6 billion by 2035.
What Value CAGR is the boom trucks market Exhibit Over the Last Years?
The growth rate of the boom trucks market is 4.2% from 2020 to 2024.