
Electric Rice Cooker Market Outlook (2025 to 2035)
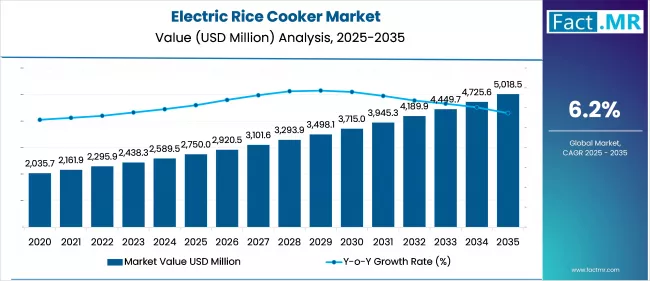
The global electric rice cooker market is expected to reach USD 5,019 million by 2035, up from USD 2,589 million in 2024. During the forecast period (2025-2035), the industry is projected to register a CAGR of 6.2%.
Changing lifestyles, the rise of nuclear families, and the demand for convenient, nutrient-rich cooking solutions are driving the growth of the electric rice cooker market. Smart kitchen technologies, energy-efficient initiatives, and growing e-commerce access are also contributing to global market growth.
What are the drivers of electric rice cooker market?
The electric rice cooker market is shaped by evolving consumer lifestyles and increasing demand for convenient cooking appliances. As more households, particularly in urban areas, adopt faster-paced routines, there is an inclination towards using appliances that save time and effort in the cooking process. This demand aligns with the programmable features of the modern electric rice cookers that include delay timers and multi-cooking features.
The consumption of compact kitchen appliances has increased due to the rise of nuclear families and working professionals. The growth is also driven by the increasing popularity of smart kitchen technologies, including IoT-enabled and voice-controlled rice cookers, among others. There is also increased health awareness promoting the use of rice cookers equipped with advanced heating systems, such as induction, or the use of adaptive cooking technologies.
Government initiatives promoting energy-efficient appliances, combined with increased awareness in emerging economies, further support market expansion. Moreover, increasing market penetration by e-commerce has enhanced access to a wide variety of rice cookers, making the product more widely available in the global market.
What are the regional trends of electric rice cooker market?
The Asia-Pacific region holds a leading position in the electric rice cooker market, supported by cultures that consume more rice-based diets. The penetration of these appliances is significant in countries such as China, Japan, South Korea, and India.
Japan is specifically known for its advancements in rice cooker technologies, and therefore, manufacturers present multi-purpose and luxury rice cookers. The Southeast Asian market is also recording high growth, influenced by urbanization and improving disposable incomes.
North America and Europe are experiencing a greater adoption of electric rice cookers, as Asian cuisines become increasingly popular and the concept of health-conscious consumers continues to evolve. Multifunctional cookers that enable rice cooking, steaming, and slow cooking have been the choice of millennials and health-conscious users in the U.S.
Latin America has been experiencing growth, supported by a growing middle-income population, urbanization, and increased product awareness on online platforms. Although the market share in this region remains relatively small, ongoing improvements in kitchen modernization and electrification are expected to support further growth.
What are the challenges and restraining factors of electric rice cooker market?
The electric rice cooker market faces several challenges despite its potential in this industry. One of the key limitations is the lack of information about product features, especially in low-income or rural areas, which makes penetration unfavorable. In developing countries, modern cooking technologies are still not widely adopted due to cultural familiarity or cost considerations.
Another issue is price sensitivity, particularly with advanced models that feature adaptive logic, induction heating, or smart controls. Initial costs may be high, which discourages uptake in price-sensitive markets. Additionally, the presence of counterfeit and substandard products in the market may also negatively impact consumer trust and the brand's reputation.
Electric rice cookers face limited versatility against more general appliances such as a multi-cooker or pressure cookers that perform multiple tasks. Customer satisfaction is further curtailed by frequent replacement of the product since components are not durable or after-sales service is lacking in some areas.
Environmental concerns related to e-waste products and the use of non-recyclable materials in lower-priced models are reportedly raising concerns that may prompt regulatory enforcement in the future.
Country-Wise Outlook
Smart tech and urban demand make China a hotspot for electric rice cookers
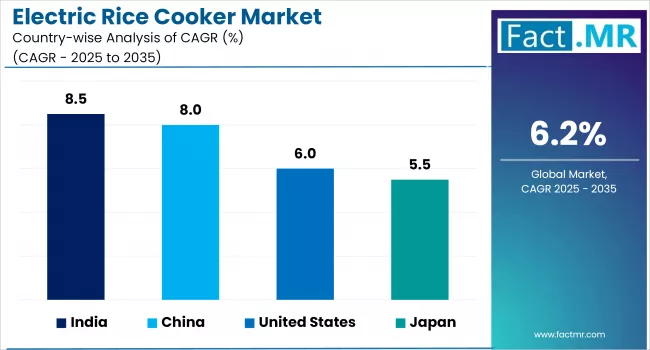
China holds a leading position in the electric rice cooker industry worldwide and is being propelled by the large consumer market, evolving food culture, and practical use of highly efficient kitchenware. Industrialization and the expanding middle class are intensifying the need of multi-functional rice cooker units designed for steam, bake, and slow cook.
The Made in China 2025 policy supports local innovation, and technologies such as adaptive logic control and induction heating are widely adopted in the market.
Electric rice cookers in Japan rise on the back of culinary precision and AI
Japan market is well-developed and is considered a high-end precisions-oriented electric rice cooker market. The demand has been facilitated by consumer focus on quality, consistency, and ease of cooking rice. The pressure IH (Induction Heating), variable pressure control, and platinum-infused inner pots are some innovations reflects this trend.
Leading brands often integrate AI algorithms to modify cooking by type of rice or its moisture. The country's shrinking household size also has an impact on design trends the compact models, single serving units and the two serving options becoming increasingly common.
Lifestyle shifts and rural electrification fuel India’s electric rice cooker boom
India is also becoming a major growth market, supported by an upward trend of disposable income, time constrained urbanite youth and the penetration of electricity in the countryside. The change in traditional pressure cookers towards the electric variation is facilitated by a government electrification initiative and a growing participation of women within the workforce.
Local brands such as Bajaj, Prestige are diversifying into smart and non-stick models and international brands are modifying their products addressing the local needs and the different variety of rice. Digital timers, keep-warm functions and multi-menu settings are also gaining interests, particularly in nuclear families and working individuals in metropolitan areas.
Category-Wise Analysis
Multifunctional electric rice cookers lead the charge in smart household kitchens
Electric rice cookers today are redefining convenience and versatility in modern households. These devices are no longer limited to rice cookers; they can steam, slow cook, bake, and even produce yogurt, making them a core component amongst time-efficient consumers and kitchen space-saving designs.
They are particularly appealing to urban residents, where multi-functionality is preferred over the existence of several appliances. Contributing to their appeal are features such as precise temperature control, pre-set menus and electronic interfaces that keep on adding value to their offer.
Household use drives sustained demand for smart cooking appliances
The main driver of electric rice cooker adoption remains the household segment, supported by changing lifestyles, the rise of dual-income families, and the growing value placed on home-cooked meals. Electric rice cookers are a kitchen must-have in places like the Asia-Pacific, and this trend is increasing in Western markets as consumers discover meal preparation and healthier food options. The domestic orientation ensures ongoing innovations are compatible with utility and safety functions, making them easy to maintain.
Offline retail channels remain dominant despite e-commerce growth
Despite the emergence of e-commerce, electric rice cooker marketing continues to rely heavily on offline distribution channels, particularly the appliance stores and large-format retailers.
When purchasing kitchen appliances, consumers often prefer to assess products in person through demonstrations, visit in-store displays, and access reliable after-sales support. Physical stores, too, enable brands build consumer trust in markets where digital adoption is still limited and where in-person comparison remains a common part of the buying process.
Competitive Analysis
The electric rice cooker industry is highly competitive, shaped by ongoing innovation, brand competition, and price pressures. To gain a technological edge, competitors seek to provide multi-functional products like pressure-cooking, induction heating, as well as intelligent connective features.
High velocity in urbanization and growing discretionary income, primarily in the Asia-Pacific and Latin America regions, have driven the need for convenient cooking appliances, promoting the entry of new players and intensifying competition among established brands.
Domestic manufacturers have the advantage of serving a local taste or preference, such as in specific presets tailored to regional rice varieties, which allows them to occupy a niche. Regional competition also varies, with offline distribution being prominent in rural areas and online platforms dominating urban markets.
There is also considerable competitive intensity due to low switching costs and high product substitution where a consumer is likely to use alternatives such as microwave rice steamers or multi-cookers. Sustainability considerations, including recyclable materials and energy efficiency, are shaping product strategies as companies respond to the expectations of eco-conscious consumers.
Key players in the electric rice cooker industry include Toshiba Corporation, TTK Prestige Limited, Panasonic Inc., Zojirushi America Corporation, Tiger Corporation, Sunbeam Products Inc., Aroma Houseware Company, Pigeon Corporation, Koninklijke Philips N.V., Conair Corporation, Winco Corp, and other notable players.
Recent Development
- In August 2024, Toshiba unveiled the Dew Series, enhancing rice cooking with patented vacuum and induction heating technologies. These innovations aim to enhance the texture and flavor of rice, reflecting Toshiba's commitment to advancing household appliances.
- In January 2024, Xiaomi listed its Smart Multifunctional Rice Cooker on its global website, indicating an imminent launch. This 3L capacity cooker offers eight functions and can be controlled via the MI Home/Xiaomi Home app, allowing users to adjust cooking parameters and schedule meals up to 24 hours in advance.
Methodology and Industry Tracking Approach
The electric rice cooker market is completely analyzed by Fact.MR in 2025, engaging 4,250 stakeholders from 21 countries. The survey was finalized in October 2020 and featured at least 100 experts from each participating country. The experts were engineers in the consumer appliances field, culinary technology researchers, and developers of sustainable home appliances. It focused on introducing kitchen electronics, such as induction heating, smart multi-functional construction, and sustainable materials.
Case-wise, between July 2024 and June 2025, some of the main trends dominating the market were the introduction of AI-based cooking customization, the use of applications to run multi-cookers, and voice-enabled rice cookers.
Moreover, environmentally friendly changes, such as energy-efficient certification, the use of recyclable resources, and the development of repairable modules, have become more popular. Modular replacements of accessories by subscription, reusable inner pots, and space-saving designs are also gaining popularity, particularly in urban markets.
Premium smart rice cookers with app and Wi-Fi functions have been early adopters in North America and Western Europe. In contrast, the trend-setters in the arena of fuzzy logic and induction heating technologies are the East Asian countries. Fact.MR has been monitoring the shift of rice cooking appliances towards greater sustainability, intelligence, and multifunctionality since 2018, in line with new lifestyles and evolving consumer preferences.
Fact.MR has provided detailed information about the price points of key manufacturers in the Electric Rice Cooker Market, positioned across regions, including sales growth, production capacity, and speculative technological expansion, in the recently published report.
Segmentation of Electric rice cooker market
-
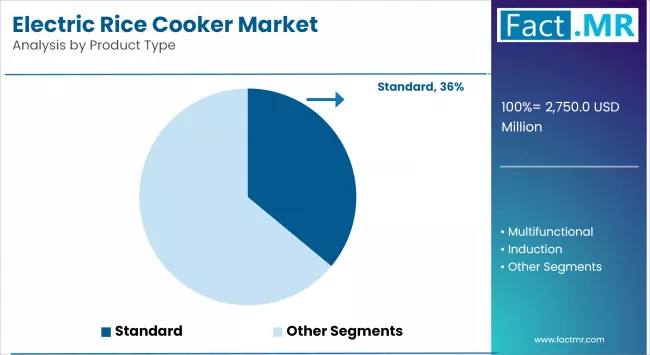
By Product Type :
- Standard
- Multifunctional
- Induction
- Others
-
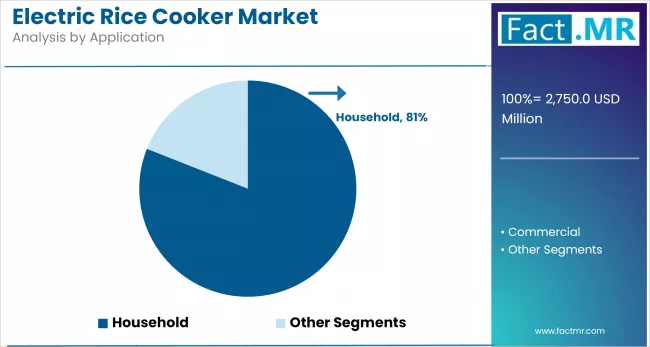
By Application :
- Household
- Commercial
-
By Distributional Channel :
- Offline
- Online
-
By Region :
- North America
- Latin America
- Western Europe
- Eastern Europe
- East Asia
- South Asia & Pacific
- Middle East & Africa
- Frequently Asked Questions -
What was the global Electric rice cooker market size reported by Fact.MR for 2025?
The global electric rice cooker market was valued at USD 2,750 Million in 2025.
Who are the major players operating in the electric rice cooker market?
Prominent players in the market are Toshiba Corporation, TTK Prestige Limited, Panasonic Inc., Zojirushi America Corporation, Tiger Corporation, among others.
What is the Estimated Valuation of the electric rice cooker market in 2035?
The market is expected to reach a valuation of USD 5,019 Million in 2035.
What value CAGR did the Electric rice cooker market exhibit over the last five years?
The historic growth rate of the Electric rice cooker market was 4.7% from 2020-2024.

Author:
Ayush Raj

Editor:
Anushree Karale